Zip Codes with the Highest Percentage of Population with a Degree in Literature and Languages in Portland, OR

RELATED REPORTS & OPTIONS

Literature and Languages
Population
Families and Households
Female Fertility
Female Fertility (Unmarried)
Race (Community Size)
Race (Percentage)
Ancestry (Community Size)
AfghanAfricanAlaska NativeAlaskan AthabascanAlbanianAleutAlsatianAmericanApacheArabArgentineanArmenianAustralianAustrianBahamianBangladeshiBasqueBelgianBelizeanBhutaneseBlackfeetBolivianBrazilianBritishBritish West IndianBulgarianBurmeseCajunCambodianCanadianCelticCentral AmericanCentral American IndianCherokeeCheyenneChickasawChileanChineseChippewaChoctawColombianColvilleCosta RicanCreeCreekCroatianCubanCzechCzechoslovakianDanishDelawareDominicanDutchEastern EuropeanEcuadorianEgyptianEnglishEstonianEthiopianEuropeanFijianFilipinoFinnishFrenchFrench American IndianFrench CanadianGermanGerman RussianGhanaianGreekGuamanian / ChamorroGuatemalanGuyaneseHaitianHonduranHopiHungarianIcelanderIndian (Asian)IndonesianInupiatIranianIraqiIrishIroquoisIsraeliItalianJamaicanJapaneseJordanianKenyanKoreanLaotianLatvianLebaneseLiberianLithuanianLumbeeLuxembourgerMacedonianMalaysianMalteseMarshalleseMexicanMexican American IndianMongolianMoroccanNative HawaiianNavajoNepaleseNew ZealanderNicaraguanNigerianNorthern EuropeanNorwegianOkinawanOsagePaiutePakistaniPalestinianPanamanianParaguayanPennsylvania GermanPeruvianPimaPolishPortuguesePotawatomiPuebloPuerto RicanPuget Sound SalishRomanianRussianSalvadoranSamoanScandinavianScotch-IrishScottishSeminoleSenegaleseSerbianShoshoneSierra LeoneanSiouxSlavicSlovakSloveneSomaliSouth AfricanSouth AmericanSouth American IndianSoviet UnionSpaniardSpanishSpanish AmericanSpanish American IndianSri LankanSubsaharan AfricanSwedishSwissSyrianThaiTlingit-HaidaTonganTrinidadian and TobagonianTsimshianTurkishUgandanUkrainianUruguayanUteVenezuelanVietnameseWelshWest IndianYakamaYaquiYugoslavianYup'ik
Ancestry (Percentage)
AfghanAfricanAlaska NativeAlaskan AthabascanAlbanianAleutAlsatianAmericanApacheArabArgentineanArmenianAustralianAustrianBahamianBangladeshiBasqueBelgianBelizeanBhutaneseBlackfeetBolivianBrazilianBritishBritish West IndianBulgarianBurmeseCajunCambodianCanadianCelticCentral AmericanCentral American IndianCherokeeCheyenneChickasawChileanChineseChippewaChoctawColombianColvilleCosta RicanCreeCreekCroatianCubanCzechCzechoslovakianDanishDelawareDominicanDutchEastern EuropeanEcuadorianEgyptianEnglishEstonianEthiopianEuropeanFijianFilipinoFinnishFrenchFrench American IndianFrench CanadianGermanGerman RussianGhanaianGreekGuamanian / ChamorroGuatemalanGuyaneseHaitianHonduranHopiHungarianIcelanderIndian (Asian)IndonesianInupiatIranianIraqiIrishIroquoisIsraeliItalianJamaicanJapaneseJordanianKenyanKoreanLaotianLatvianLebaneseLiberianLithuanianLumbeeLuxembourgerMacedonianMalaysianMalteseMarshalleseMexicanMexican American IndianMongolianMoroccanNative HawaiianNavajoNepaleseNew ZealanderNicaraguanNigerianNorthern EuropeanNorwegianOkinawanOsagePaiutePakistaniPalestinianPanamanianParaguayanPennsylvania GermanPeruvianPimaPolishPortuguesePotawatomiPuebloPuerto RicanPuget Sound SalishRomanianRussianSalvadoranSamoanScandinavianScotch-IrishScottishSeminoleSenegaleseSerbianShoshoneSierra LeoneanSiouxSlavicSlovakSloveneSomaliSouth AfricanSouth AmericanSouth American IndianSoviet UnionSpaniardSpanishSpanish AmericanSpanish American IndianSri LankanSubsaharan AfricanSwedishSwissSyrianThaiTlingit-HaidaTonganTrinidadian and TobagonianTsimshianTurkishUgandanUkrainianUruguayanUteVenezuelanVietnameseWelshWest IndianYakamaYaquiYugoslavianYup'ik
Immigrant Origin (Total)
AfghanistanAfricaArgentinaArmeniaAsiaAustraliaAustriaBahamasBangladeshBarbadosBelarusBelgiumBelizeBosnia and HerzegovinaBrazilBulgariaBurma / MyanmarCambodiaCameroonCanadaCaribbeanCentral AmericaChileChinaColombiaCongoCosta RicaCroatiaCubaCzechoslovakiaDenmarkDominican RepublicEastern AfricaEastern AsiaEastern EuropeEcuadorEgyptEl SalvadorEnglandEritreaEthiopiaEuropeFijiFranceGermanyGhanaGreeceGuatemalaHaitiHondurasHong KongHungaryIndiaIndonesiaIranIraqIrelandIsraelItalyJamaicaJapanJordanKazakhstanKenyaKoreaKuwaitLaosLatin AmericaLatviaLebanonLiberiaLithuaniaMalaysiaMexicoMicronesiaMiddle AfricaMoldovaMoroccoNepalNetherlandsNicaraguaNigeriaNorth MacedoniaNorthern AfricaNorthern EuropeNorwayOceaniaPakistanPanamaPeruPhilippinesPolandPortugalRomaniaRussiaSaudi ArabiaScotlandSerbiaSingaporeSomaliaSouth AfricaSouth AmericaSouth Central AsiaSouth Eastern AsiaSouthern EuropeSpainSri LankaSudanSwedenSwitzerlandSyriaTaiwanThailandTrinidad and TobagoTurkeyUgandaUkraineUruguayUzbekistanVenezuelaVietnamWestern AfricaWestern AsiaWestern EuropeYemen
Immigrant Origin (Percentage)
AfghanistanAfricaArgentinaArmeniaAsiaAustraliaAustriaBahamasBangladeshBarbadosBelarusBelgiumBelizeBosnia and HerzegovinaBrazilBulgariaBurma / MyanmarCambodiaCameroonCanadaCaribbeanCentral AmericaChileChinaColombiaCongoCosta RicaCroatiaCubaCzechoslovakiaDenmarkDominican RepublicEastern AfricaEastern AsiaEastern EuropeEcuadorEgyptEl SalvadorEnglandEritreaEthiopiaEuropeFijiFranceGermanyGhanaGreeceGuatemalaHaitiHondurasHong KongHungaryIndiaIndonesiaIranIraqIrelandIsraelItalyJamaicaJapanJordanKazakhstanKenyaKoreaKuwaitLaosLatin AmericaLatviaLebanonLiberiaLithuaniaMalaysiaMexicoMicronesiaMiddle AfricaMoldovaMoroccoNepalNetherlandsNicaraguaNigeriaNorth MacedoniaNorthern AfricaNorthern EuropeNorwayOceaniaPakistanPanamaPeruPhilippinesPolandPortugalRomaniaRussiaSaudi ArabiaScotlandSerbiaSingaporeSomaliaSouth AfricaSouth AmericaSouth Central AsiaSouth Eastern AsiaSouthern EuropeSpainSri LankaSudanSwedenSwitzerlandSyriaTaiwanThailandTrinidad and TobagoTurkeyUgandaUkraineUruguayUzbekistanVenezuelaVietnamWestern AfricaWestern AsiaWestern EuropeYemen
Income
Income (Families)
Income (Households)
Poverty
Poverty (Families)
Unemployment
Employment Occupations
Employment Industries
Employer Class
Commute Time
Commute Means
School Enrollment
Education by Degree Field
Occupancy
Finances
Physical Characteristics
Portland
Compare Zip Codes
Comparison Subject

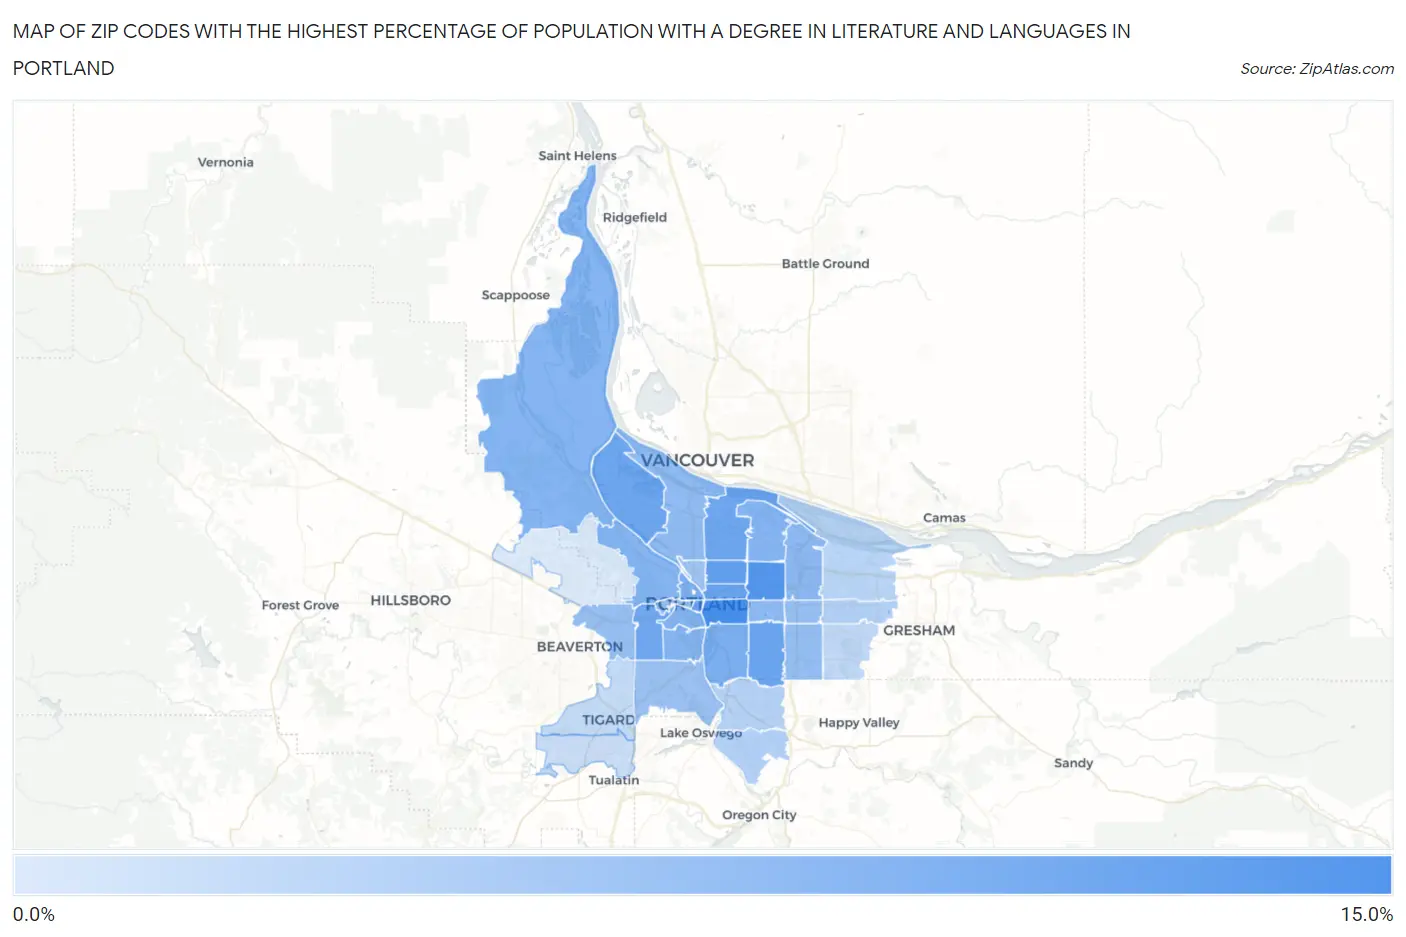
Map of Zip Codes with the Highest Percentage of Population with a Degree in Literature and Languages in Portland

0.0%
15.0%
Zip Codes with the Highest Percentage of Population with a Degree in Literature and Languages in Portland Map

Zip Codes with the Highest Percentage of Population with a Degree in Literature and Languages in Portland, OR

Zip Code % Graduates vs State vs National
1.9721412.5%6.1%(+6.43)#274.4%(+8.12)#1,135
2.9721311.6%6.1%(+5.46)#314.4%(+7.15)#1,318
3.9721210.7%6.1%(+4.63)#344.4%(+6.32)#1,549
4.9720410.5%6.1%(+4.38)#364.4%(+6.07)#1,647
5.9723210.3%6.1%(+4.24)#384.4%(+5.93)#1,700
6.9720610.2%6.1%(+4.10)#404.4%(+5.79)#1,744
7.9721110.1%6.1%(+3.95)#434.4%(+5.64)#1,797
8.9720310.0%6.1%(+3.94)#454.4%(+5.63)#1,804
9.972219.8%6.1%(+3.73)#484.4%(+5.42)#1,902
10.972029.1%6.1%(+3.05)#574.4%(+4.74)#2,238
11.972099.1%6.1%(+2.99)#584.4%(+4.68)#2,263
12.972018.7%6.1%(+2.65)#644.4%(+4.34)#2,442
13.972188.6%6.1%(+2.53)#674.4%(+4.21)#2,527
14.972398.6%6.1%(+2.49)#684.4%(+4.18)#2,555
15.972108.5%6.1%(+2.45)#694.4%(+4.14)#2,579
16.972318.5%6.1%(+2.40)#704.4%(+4.09)#2,614
17.972208.1%6.1%(+2.00)#784.4%(+3.69)#2,902
18.972158.0%6.1%(+1.91)#794.4%(+3.60)#2,972
19.972177.9%6.1%(+1.81)#824.4%(+3.50)#3,059
20.972057.6%6.1%(+1.53)#894.4%(+3.22)#3,328
21.972667.5%6.1%(+1.41)#904.4%(+3.09)#3,431
22.972257.5%6.1%(+1.39)#914.4%(+3.08)#3,456
23.972167.4%6.1%(+1.30)#964.4%(+2.98)#3,559
24.972197.1%6.1%(+1.02)#1024.4%(+2.71)#3,845
25.972276.8%6.1%(+0.720)#1074.4%(+2.41)#4,210
26.972675.8%6.1%(-0.346)#1334.4%(+1.34)#5,838
27.972335.7%6.1%(-0.410)#1404.4%(+1.28)#5,961
28.972225.6%6.1%(-0.525)#1464.4%(+1.16)#6,178
29.972305.3%6.1%(-0.846)#1584.4%(+0.843)#6,843
30.972364.9%6.1%(-1.18)#1644.4%(+0.512)#7,555
31.972234.6%6.1%(-1.47)#1774.4%(+0.223)#8,345
32.972244.3%6.1%(-1.76)#1854.4%(-0.071)#9,187
33.972293.2%6.1%(-2.87)#2224.4%(-1.18)#12,791

Common Questions

What are the Top 10 Zip Codes with the Highest Percentage of Population with a Degree in Literature and Languages in Portland, OR?
Top 10 Zip Codes with the Highest Percentage of Population with a Degree in Literature and Languages in Portland, OR are:
#1
12.5%
#2
11.6%
#3
10.7%
#4
10.5%
#5
10.3%
#6
10.2%
#7
10.1%
#8
10.0%
#9
9.8%
#10
9.1%
What zip code has the Highest Percentage of Population with a Degree in Literature and Languages in Portland, OR?
97214 has the Highest Percentage of Population with a Degree in Literature and Languages in Portland, OR with 12.5%.
What is the Percentage of Population with a Degree in Literature and Languages in Portland, OR?
Percentage of Population with a Degree in Literature and Languages in Portland is 9.0%.
What is the Percentage of Population with a Degree in Literature and Languages in Oregon?
Percentage of Population with a Degree in Literature and Languages in Oregon is 6.1%.
What is the Percentage of Population with a Degree in Literature and Languages in the United States?
Percentage of Population with a Degree in Literature and Languages in the United States is 4.4%.