Zip Codes with the Highest Percentage of Population Employed in Firefighting & Prevention in Portland, OR

RELATED REPORTS & OPTIONS

Firefighting & Prevention
Population
Families and Households
Female Fertility
Female Fertility (Unmarried)
Race (Community Size)
Race (Percentage)
Ancestry (Community Size)
AfghanAfricanAlaska NativeAlaskan AthabascanAlbanianAleutAlsatianAmericanApacheArabArgentineanArmenianAustralianAustrianBahamianBangladeshiBasqueBelgianBelizeanBhutaneseBlackfeetBolivianBrazilianBritishBritish West IndianBulgarianBurmeseCajunCambodianCanadianCelticCentral AmericanCentral American IndianCherokeeCheyenneChickasawChileanChineseChippewaChoctawColombianColvilleCosta RicanCreeCreekCroatianCubanCzechCzechoslovakianDanishDelawareDominicanDutchEastern EuropeanEcuadorianEgyptianEnglishEstonianEthiopianEuropeanFijianFilipinoFinnishFrenchFrench American IndianFrench CanadianGermanGerman RussianGhanaianGreekGuamanian / ChamorroGuatemalanGuyaneseHaitianHonduranHopiHungarianIcelanderIndian (Asian)IndonesianInupiatIranianIraqiIrishIroquoisIsraeliItalianJamaicanJapaneseJordanianKenyanKoreanLaotianLatvianLebaneseLiberianLithuanianLumbeeLuxembourgerMacedonianMalaysianMalteseMarshalleseMexicanMexican American IndianMongolianMoroccanNative HawaiianNavajoNepaleseNew ZealanderNicaraguanNigerianNorthern EuropeanNorwegianOkinawanOsagePaiutePakistaniPalestinianPanamanianParaguayanPennsylvania GermanPeruvianPimaPolishPortuguesePotawatomiPuebloPuerto RicanPuget Sound SalishRomanianRussianSalvadoranSamoanScandinavianScotch-IrishScottishSeminoleSenegaleseSerbianShoshoneSierra LeoneanSiouxSlavicSlovakSloveneSomaliSouth AfricanSouth AmericanSouth American IndianSoviet UnionSpaniardSpanishSpanish AmericanSpanish American IndianSri LankanSubsaharan AfricanSwedishSwissSyrianThaiTlingit-HaidaTonganTrinidadian and TobagonianTsimshianTurkishUgandanUkrainianUruguayanUteVenezuelanVietnameseWelshWest IndianYakamaYaquiYugoslavianYup'ik
Ancestry (Percentage)
AfghanAfricanAlaska NativeAlaskan AthabascanAlbanianAleutAlsatianAmericanApacheArabArgentineanArmenianAustralianAustrianBahamianBangladeshiBasqueBelgianBelizeanBhutaneseBlackfeetBolivianBrazilianBritishBritish West IndianBulgarianBurmeseCajunCambodianCanadianCelticCentral AmericanCentral American IndianCherokeeCheyenneChickasawChileanChineseChippewaChoctawColombianColvilleCosta RicanCreeCreekCroatianCubanCzechCzechoslovakianDanishDelawareDominicanDutchEastern EuropeanEcuadorianEgyptianEnglishEstonianEthiopianEuropeanFijianFilipinoFinnishFrenchFrench American IndianFrench CanadianGermanGerman RussianGhanaianGreekGuamanian / ChamorroGuatemalanGuyaneseHaitianHonduranHopiHungarianIcelanderIndian (Asian)IndonesianInupiatIranianIraqiIrishIroquoisIsraeliItalianJamaicanJapaneseJordanianKenyanKoreanLaotianLatvianLebaneseLiberianLithuanianLumbeeLuxembourgerMacedonianMalaysianMalteseMarshalleseMexicanMexican American IndianMongolianMoroccanNative HawaiianNavajoNepaleseNew ZealanderNicaraguanNigerianNorthern EuropeanNorwegianOkinawanOsagePaiutePakistaniPalestinianPanamanianParaguayanPennsylvania GermanPeruvianPimaPolishPortuguesePotawatomiPuebloPuerto RicanPuget Sound SalishRomanianRussianSalvadoranSamoanScandinavianScotch-IrishScottishSeminoleSenegaleseSerbianShoshoneSierra LeoneanSiouxSlavicSlovakSloveneSomaliSouth AfricanSouth AmericanSouth American IndianSoviet UnionSpaniardSpanishSpanish AmericanSpanish American IndianSri LankanSubsaharan AfricanSwedishSwissSyrianThaiTlingit-HaidaTonganTrinidadian and TobagonianTsimshianTurkishUgandanUkrainianUruguayanUteVenezuelanVietnameseWelshWest IndianYakamaYaquiYugoslavianYup'ik
Immigrant Origin (Total)
AfghanistanAfricaArgentinaArmeniaAsiaAustraliaAustriaBahamasBangladeshBarbadosBelarusBelgiumBelizeBosnia and HerzegovinaBrazilBulgariaBurma / MyanmarCambodiaCameroonCanadaCaribbeanCentral AmericaChileChinaColombiaCongoCosta RicaCroatiaCubaCzechoslovakiaDenmarkDominican RepublicEastern AfricaEastern AsiaEastern EuropeEcuadorEgyptEl SalvadorEnglandEritreaEthiopiaEuropeFijiFranceGermanyGhanaGreeceGuatemalaHaitiHondurasHong KongHungaryIndiaIndonesiaIranIraqIrelandIsraelItalyJamaicaJapanJordanKazakhstanKenyaKoreaKuwaitLaosLatin AmericaLatviaLebanonLiberiaLithuaniaMalaysiaMexicoMicronesiaMiddle AfricaMoldovaMoroccoNepalNetherlandsNicaraguaNigeriaNorth MacedoniaNorthern AfricaNorthern EuropeNorwayOceaniaPakistanPanamaPeruPhilippinesPolandPortugalRomaniaRussiaSaudi ArabiaScotlandSerbiaSingaporeSomaliaSouth AfricaSouth AmericaSouth Central AsiaSouth Eastern AsiaSouthern EuropeSpainSri LankaSudanSwedenSwitzerlandSyriaTaiwanThailandTrinidad and TobagoTurkeyUgandaUkraineUruguayUzbekistanVenezuelaVietnamWestern AfricaWestern AsiaWestern EuropeYemen
Immigrant Origin (Percentage)
AfghanistanAfricaArgentinaArmeniaAsiaAustraliaAustriaBahamasBangladeshBarbadosBelarusBelgiumBelizeBosnia and HerzegovinaBrazilBulgariaBurma / MyanmarCambodiaCameroonCanadaCaribbeanCentral AmericaChileChinaColombiaCongoCosta RicaCroatiaCubaCzechoslovakiaDenmarkDominican RepublicEastern AfricaEastern AsiaEastern EuropeEcuadorEgyptEl SalvadorEnglandEritreaEthiopiaEuropeFijiFranceGermanyGhanaGreeceGuatemalaHaitiHondurasHong KongHungaryIndiaIndonesiaIranIraqIrelandIsraelItalyJamaicaJapanJordanKazakhstanKenyaKoreaKuwaitLaosLatin AmericaLatviaLebanonLiberiaLithuaniaMalaysiaMexicoMicronesiaMiddle AfricaMoldovaMoroccoNepalNetherlandsNicaraguaNigeriaNorth MacedoniaNorthern AfricaNorthern EuropeNorwayOceaniaPakistanPanamaPeruPhilippinesPolandPortugalRomaniaRussiaSaudi ArabiaScotlandSerbiaSingaporeSomaliaSouth AfricaSouth AmericaSouth Central AsiaSouth Eastern AsiaSouthern EuropeSpainSri LankaSudanSwedenSwitzerlandSyriaTaiwanThailandTrinidad and TobagoTurkeyUgandaUkraineUruguayUzbekistanVenezuelaVietnamWestern AfricaWestern AsiaWestern EuropeYemen
Income
Income (Families)
Income (Households)
Poverty
Poverty (Families)
Unemployment
Employment Occupations
Employment Industries
Employer Class
Commute Time
Commute Means
School Enrollment
Education by Degree Field
Occupancy
Finances
Physical Characteristics
Portland
Compare Zip Codes
Comparison Subject

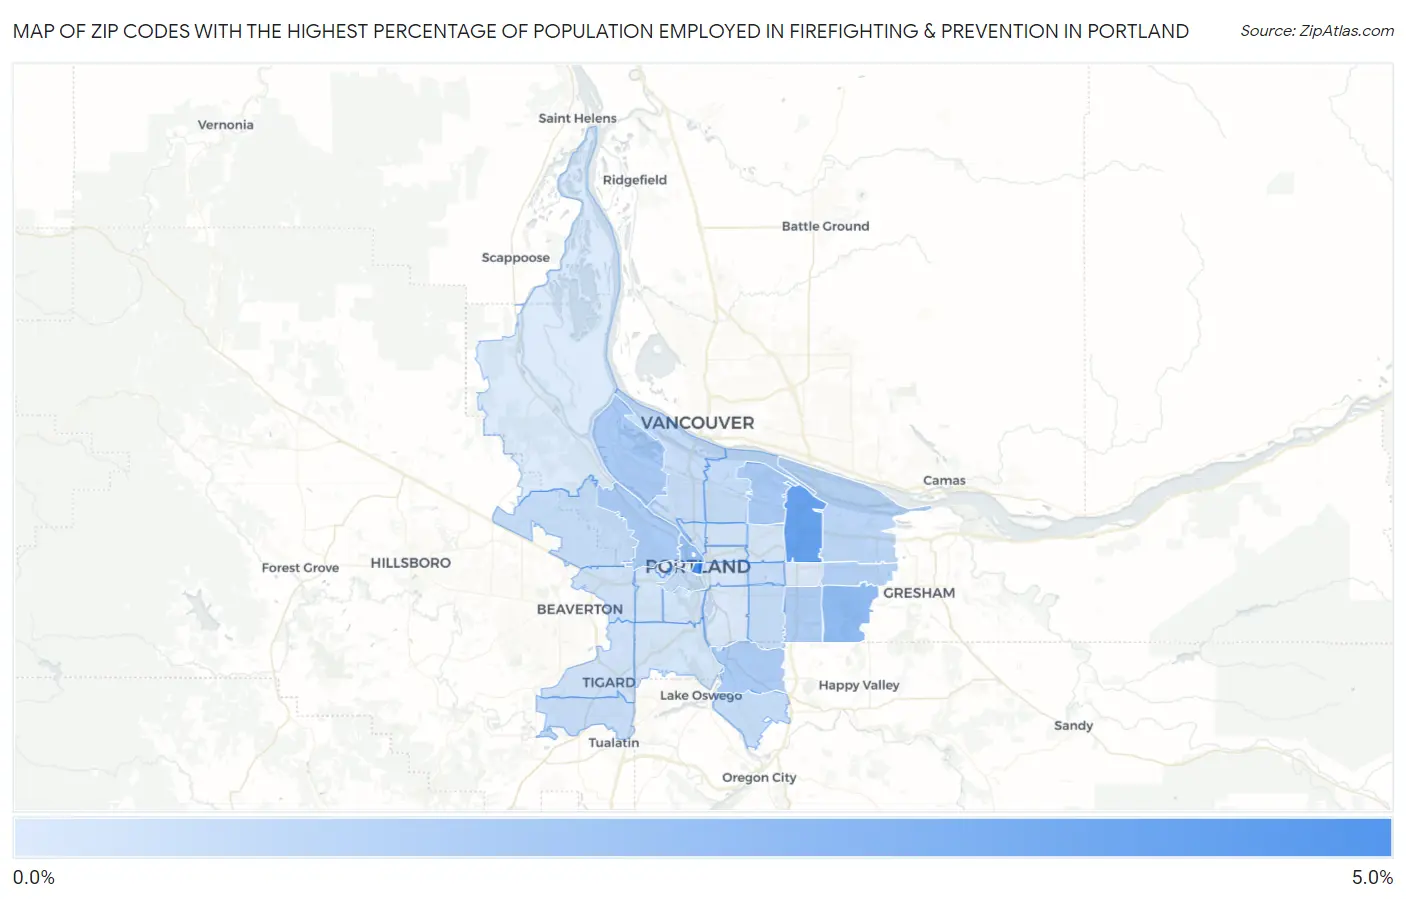
Map of Zip Codes with the Highest Percentage of Population Employed in Firefighting & Prevention in Portland

0.0%
5.0%
Zip Codes with the Highest Percentage of Population Employed in Firefighting & Prevention in Portland Map

Zip Codes with the Highest Percentage of Population Employed in Firefighting & Prevention in Portland, OR

Zip Code % Employed vs State vs National
1.972044.1%1.1%(+3.02)#211.2%(+2.90)#1,302
2.972203.2%1.1%(+2.14)#351.2%(+2.02)#2,012
3.972362.2%1.1%(+1.10)#601.2%(+0.978)#3,975
4.972092.0%1.1%(+0.960)#671.2%(+0.843)#4,409
5.972031.5%1.1%(+0.411)#1081.2%(+0.294)#7,110
6.972181.4%1.1%(+0.374)#1091.2%(+0.257)#7,364
7.972221.4%1.1%(+0.359)#1111.2%(+0.242)#7,458
8.972101.4%1.1%(+0.314)#1191.2%(+0.196)#7,764
9.972661.3%1.1%(+0.265)#1261.2%(+0.147)#8,110
10.972331.2%1.1%(+0.094)#1421.2%(-0.023)#9,484
11.972300.96%1.1%(-0.106)#1641.2%(-0.224)#11,512
12.972010.79%1.1%(-0.279)#1811.2%(-0.397)#13,343
13.972110.77%1.1%(-0.303)#1871.2%(-0.420)#13,602
14.972670.74%1.1%(-0.326)#1901.2%(-0.443)#13,847
15.972290.73%1.1%(-0.340)#1911.2%(-0.457)#14,002
16.972060.72%1.1%(-0.344)#1921.2%(-0.461)#14,046
17.972150.72%1.1%(-0.351)#1961.2%(-0.468)#14,123
18.972170.69%1.1%(-0.376)#1981.2%(-0.493)#14,412
19.972240.67%1.1%(-0.394)#2031.2%(-0.511)#14,611
20.972270.53%1.1%(-0.537)#2211.2%(-0.655)#16,189
21.972230.45%1.1%(-0.618)#2291.2%(-0.736)#17,094
22.972250.45%1.1%(-0.621)#2301.2%(-0.738)#17,127
23.972210.42%1.1%(-0.652)#2351.2%(-0.769)#17,460
24.972390.41%1.1%(-0.662)#2361.2%(-0.779)#17,575
25.972120.39%1.1%(-0.681)#2391.2%(-0.799)#17,804
26.972190.35%1.1%(-0.717)#2421.2%(-0.835)#18,217
27.972130.31%1.1%(-0.755)#2451.2%(-0.872)#18,611
28.972140.30%1.1%(-0.765)#2471.2%(-0.883)#18,736
29.972320.25%1.1%(-0.815)#2501.2%(-0.932)#19,207
30.972160.24%1.1%(-0.832)#2531.2%(-0.949)#19,365
31.972020.20%1.1%(-0.869)#2571.2%(-0.986)#19,685
32.972310.16%1.1%(-0.910)#2581.2%(-1.03)#19,978

Common Questions

What are the Top 10 Zip Codes with the Highest Percentage of Population Employed in Firefighting & Prevention in Portland, OR?
Top 10 Zip Codes with the Highest Percentage of Population Employed in Firefighting & Prevention in Portland, OR are:
#1
4.1%
#2
3.2%
#3
2.2%
#4
2.0%
#5
1.5%
#6
1.4%
#7
1.4%
#8
1.4%
#9
1.3%
#10
1.2%
What zip code has the Highest Percentage of Population Employed in Firefighting & Prevention in Portland, OR?
97204 has the Highest Percentage of Population Employed in Firefighting & Prevention in Portland, OR with 4.1%.
What is the Percentage of Population Employed in Firefighting & Prevention in Portland, OR?
Percentage of Population Employed in Firefighting & Prevention in Portland is 0.92%.
What is the Percentage of Population Employed in Firefighting & Prevention in Oregon?
Percentage of Population Employed in Firefighting & Prevention in Oregon is 1.1%.
What is the Percentage of Population Employed in Firefighting & Prevention in the United States?
Percentage of Population Employed in Firefighting & Prevention in the United States is 1.2%.