Zip Codes with the Highest Percentage of Households with Income Below $10,000 in Medford, OR
RELATED REPORTS & OPTIONS
Household Income | $0-10k
Medford
Compare Zip Codes
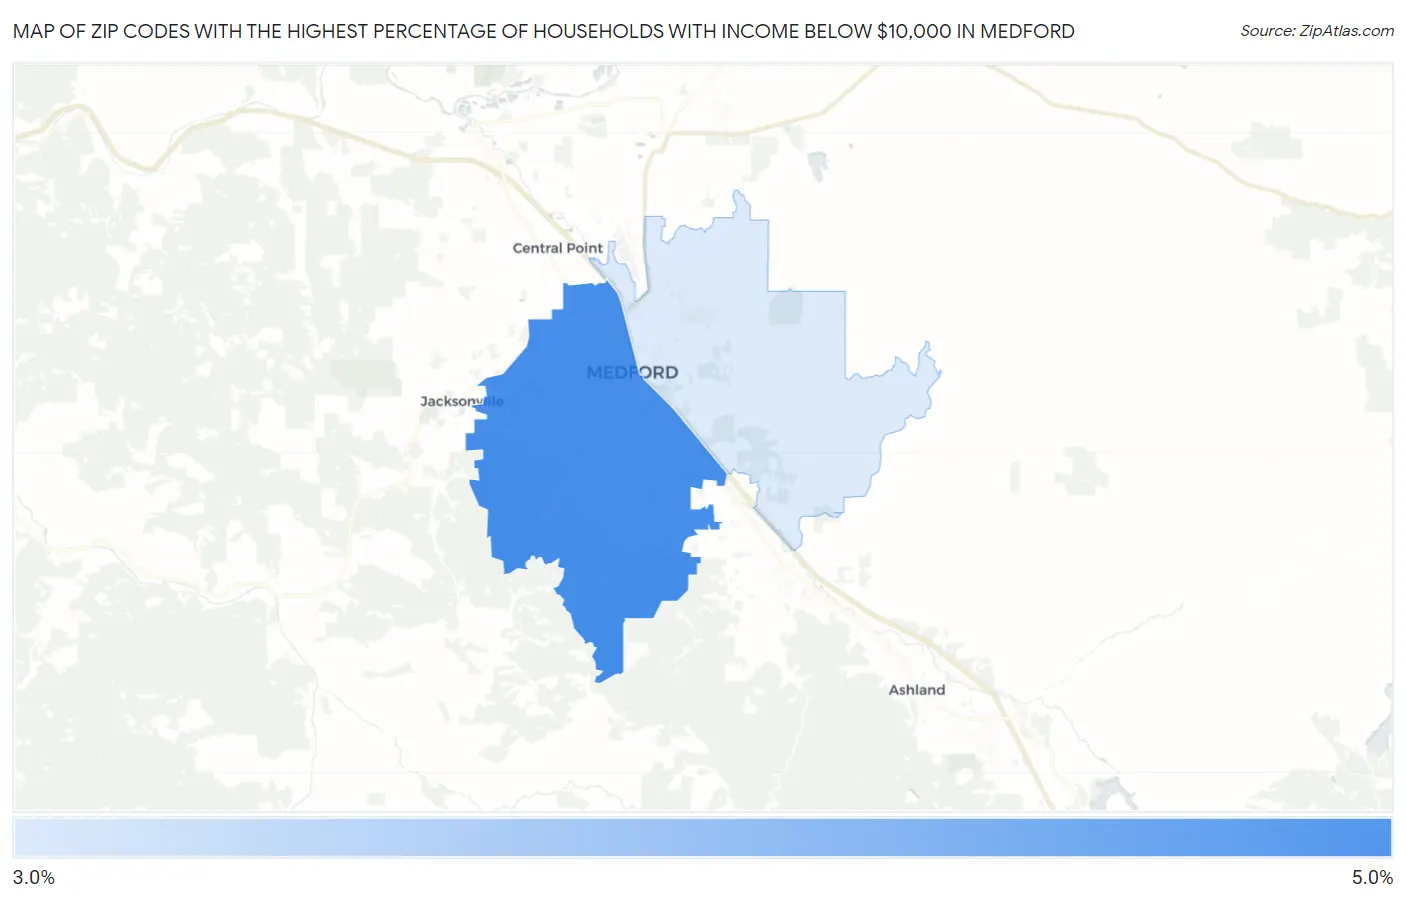
Map of Zip Codes with the Highest Percentage of Households with Income Below $10,000 in Medford
3.6%
4.1%
Zip Codes with the Highest Percentage of Households with Income Below $10,000 in Medford, OR
| Zip Code | Households with Income < $10k | vs State | vs National | |
| 1. | 97501 | 4.1% | 4.4%(-0.300)#184 | 4.9%(-0.800)#14,808 |
| 2. | 97504 | 3.6% | 4.4%(-0.800)#211 | 4.9%(-1.30)#16,786 |
1
Common Questions
What are the Top Zip Codes with the Highest Percentage of Households with Income Below $10,000 in Medford, OR?
Top Zip Codes with the Highest Percentage of Households with Income Below $10,000 in Medford, OR are:
What zip code has the Highest Percentage of Households with Income Below $10,000 in Medford, OR?
97501 has the Highest Percentage of Households with Income Below $10,000 in Medford, OR with 4.1%.
What is the Percentage of Households with Income Below $10,000 in Medford, OR?
Percentage of Households with Income Below $10,000 in Medford is 4.1%.
What is the Percentage of Households with Income Below $10,000 in Oregon?
Percentage of Households with Income Below $10,000 in Oregon is 4.4%.
What is the Percentage of Households with Income Below $10,000 in the United States?
Percentage of Households with Income Below $10,000 in the United States is 4.9%.