Zip Codes with the Highest Percentage of Population with a Degree in Computers and Mathematics in Portland, OR

RELATED REPORTS & OPTIONS

Computers and Mathematics
Population
Families and Households
Female Fertility
Female Fertility (Unmarried)
Race (Community Size)
Race (Percentage)
Ancestry (Community Size)
AfghanAfricanAlaska NativeAlaskan AthabascanAlbanianAleutAlsatianAmericanApacheArabArgentineanArmenianAustralianAustrianBahamianBangladeshiBasqueBelgianBelizeanBhutaneseBlackfeetBolivianBrazilianBritishBritish West IndianBulgarianBurmeseCajunCambodianCanadianCelticCentral AmericanCentral American IndianCherokeeCheyenneChickasawChileanChineseChippewaChoctawColombianColvilleCosta RicanCreeCreekCroatianCubanCzechCzechoslovakianDanishDelawareDominicanDutchEastern EuropeanEcuadorianEgyptianEnglishEstonianEthiopianEuropeanFijianFilipinoFinnishFrenchFrench American IndianFrench CanadianGermanGerman RussianGhanaianGreekGuamanian / ChamorroGuatemalanGuyaneseHaitianHonduranHopiHungarianIcelanderIndian (Asian)IndonesianInupiatIranianIraqiIrishIroquoisIsraeliItalianJamaicanJapaneseJordanianKenyanKoreanLaotianLatvianLebaneseLiberianLithuanianLumbeeLuxembourgerMacedonianMalaysianMalteseMarshalleseMexicanMexican American IndianMongolianMoroccanNative HawaiianNavajoNepaleseNew ZealanderNicaraguanNigerianNorthern EuropeanNorwegianOkinawanOsagePaiutePakistaniPalestinianPanamanianParaguayanPennsylvania GermanPeruvianPimaPolishPortuguesePotawatomiPuebloPuerto RicanPuget Sound SalishRomanianRussianSalvadoranSamoanScandinavianScotch-IrishScottishSeminoleSenegaleseSerbianShoshoneSierra LeoneanSiouxSlavicSlovakSloveneSomaliSouth AfricanSouth AmericanSouth American IndianSoviet UnionSpaniardSpanishSpanish AmericanSpanish American IndianSri LankanSubsaharan AfricanSwedishSwissSyrianThaiTlingit-HaidaTonganTrinidadian and TobagonianTsimshianTurkishUgandanUkrainianUruguayanUteVenezuelanVietnameseWelshWest IndianYakamaYaquiYugoslavianYup'ik
Ancestry (Percentage)
AfghanAfricanAlaska NativeAlaskan AthabascanAlbanianAleutAlsatianAmericanApacheArabArgentineanArmenianAustralianAustrianBahamianBangladeshiBasqueBelgianBelizeanBhutaneseBlackfeetBolivianBrazilianBritishBritish West IndianBulgarianBurmeseCajunCambodianCanadianCelticCentral AmericanCentral American IndianCherokeeCheyenneChickasawChileanChineseChippewaChoctawColombianColvilleCosta RicanCreeCreekCroatianCubanCzechCzechoslovakianDanishDelawareDominicanDutchEastern EuropeanEcuadorianEgyptianEnglishEstonianEthiopianEuropeanFijianFilipinoFinnishFrenchFrench American IndianFrench CanadianGermanGerman RussianGhanaianGreekGuamanian / ChamorroGuatemalanGuyaneseHaitianHonduranHopiHungarianIcelanderIndian (Asian)IndonesianInupiatIranianIraqiIrishIroquoisIsraeliItalianJamaicanJapaneseJordanianKenyanKoreanLaotianLatvianLebaneseLiberianLithuanianLumbeeLuxembourgerMacedonianMalaysianMalteseMarshalleseMexicanMexican American IndianMongolianMoroccanNative HawaiianNavajoNepaleseNew ZealanderNicaraguanNigerianNorthern EuropeanNorwegianOkinawanOsagePaiutePakistaniPalestinianPanamanianParaguayanPennsylvania GermanPeruvianPimaPolishPortuguesePotawatomiPuebloPuerto RicanPuget Sound SalishRomanianRussianSalvadoranSamoanScandinavianScotch-IrishScottishSeminoleSenegaleseSerbianShoshoneSierra LeoneanSiouxSlavicSlovakSloveneSomaliSouth AfricanSouth AmericanSouth American IndianSoviet UnionSpaniardSpanishSpanish AmericanSpanish American IndianSri LankanSubsaharan AfricanSwedishSwissSyrianThaiTlingit-HaidaTonganTrinidadian and TobagonianTsimshianTurkishUgandanUkrainianUruguayanUteVenezuelanVietnameseWelshWest IndianYakamaYaquiYugoslavianYup'ik
Immigrant Origin (Total)
AfghanistanAfricaArgentinaArmeniaAsiaAustraliaAustriaBahamasBangladeshBarbadosBelarusBelgiumBelizeBosnia and HerzegovinaBrazilBulgariaBurma / MyanmarCambodiaCameroonCanadaCaribbeanCentral AmericaChileChinaColombiaCongoCosta RicaCroatiaCubaCzechoslovakiaDenmarkDominican RepublicEastern AfricaEastern AsiaEastern EuropeEcuadorEgyptEl SalvadorEnglandEritreaEthiopiaEuropeFijiFranceGermanyGhanaGreeceGuatemalaHaitiHondurasHong KongHungaryIndiaIndonesiaIranIraqIrelandIsraelItalyJamaicaJapanJordanKazakhstanKenyaKoreaKuwaitLaosLatin AmericaLatviaLebanonLiberiaLithuaniaMalaysiaMexicoMicronesiaMiddle AfricaMoldovaMoroccoNepalNetherlandsNicaraguaNigeriaNorth MacedoniaNorthern AfricaNorthern EuropeNorwayOceaniaPakistanPanamaPeruPhilippinesPolandPortugalRomaniaRussiaSaudi ArabiaScotlandSerbiaSingaporeSomaliaSouth AfricaSouth AmericaSouth Central AsiaSouth Eastern AsiaSouthern EuropeSpainSri LankaSudanSwedenSwitzerlandSyriaTaiwanThailandTrinidad and TobagoTurkeyUgandaUkraineUruguayUzbekistanVenezuelaVietnamWestern AfricaWestern AsiaWestern EuropeYemen
Immigrant Origin (Percentage)
AfghanistanAfricaArgentinaArmeniaAsiaAustraliaAustriaBahamasBangladeshBarbadosBelarusBelgiumBelizeBosnia and HerzegovinaBrazilBulgariaBurma / MyanmarCambodiaCameroonCanadaCaribbeanCentral AmericaChileChinaColombiaCongoCosta RicaCroatiaCubaCzechoslovakiaDenmarkDominican RepublicEastern AfricaEastern AsiaEastern EuropeEcuadorEgyptEl SalvadorEnglandEritreaEthiopiaEuropeFijiFranceGermanyGhanaGreeceGuatemalaHaitiHondurasHong KongHungaryIndiaIndonesiaIranIraqIrelandIsraelItalyJamaicaJapanJordanKazakhstanKenyaKoreaKuwaitLaosLatin AmericaLatviaLebanonLiberiaLithuaniaMalaysiaMexicoMicronesiaMiddle AfricaMoldovaMoroccoNepalNetherlandsNicaraguaNigeriaNorth MacedoniaNorthern AfricaNorthern EuropeNorwayOceaniaPakistanPanamaPeruPhilippinesPolandPortugalRomaniaRussiaSaudi ArabiaScotlandSerbiaSingaporeSomaliaSouth AfricaSouth AmericaSouth Central AsiaSouth Eastern AsiaSouthern EuropeSpainSri LankaSudanSwedenSwitzerlandSyriaTaiwanThailandTrinidad and TobagoTurkeyUgandaUkraineUruguayUzbekistanVenezuelaVietnamWestern AfricaWestern AsiaWestern EuropeYemen
Income
Income (Families)
Income (Households)
Poverty
Poverty (Families)
Unemployment
Employment Occupations
Employment Industries
Employer Class
Commute Time
Commute Means
School Enrollment
Education by Degree Field
Occupancy
Finances
Physical Characteristics
Portland
Compare Zip Codes
Comparison Subject

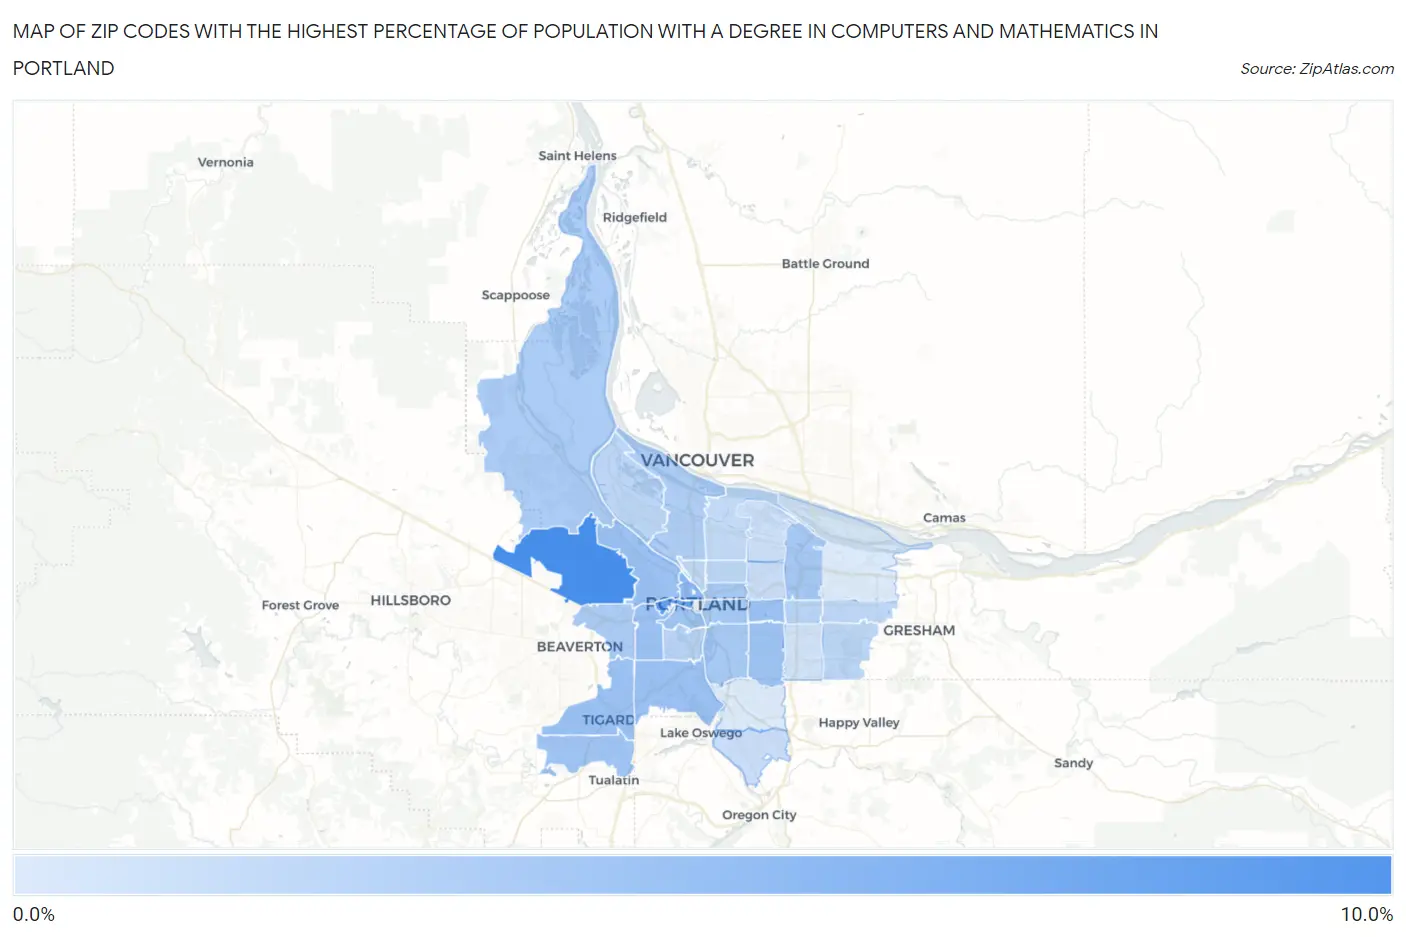
Map of Zip Codes with the Highest Percentage of Population with a Degree in Computers and Mathematics in Portland

0.0%
10.0%
Zip Codes with the Highest Percentage of Population with a Degree in Computers and Mathematics in Portland Map

Zip Codes with the Highest Percentage of Population with a Degree in Computers and Mathematics in Portland, OR

Zip Code % Graduates vs State vs National
1.972299.1%3.9%(+5.28)#184.9%(+4.25)#2,153
2.972057.4%3.9%(+3.57)#324.9%(+2.54)#3,405
3.972095.6%3.9%(+1.72)#524.9%(+0.695)#6,093
4.972214.9%3.9%(+1.03)#634.9%(+0.002)#7,706
5.972104.9%3.9%(+0.991)#654.9%(-0.037)#7,819
6.972154.8%3.9%(+0.950)#664.9%(-0.079)#7,942
7.972194.8%3.9%(+0.924)#674.9%(-0.104)#8,017
8.972234.7%3.9%(+0.865)#694.9%(-0.163)#8,181
9.972064.7%3.9%(+0.819)#714.9%(-0.209)#8,316
10.972014.7%3.9%(+0.814)#724.9%(-0.214)#8,337
11.972244.5%3.9%(+0.657)#764.9%(-0.371)#8,801
12.972204.4%3.9%(+0.503)#804.9%(-0.526)#9,293
13.972144.2%3.9%(+0.354)#864.9%(-0.675)#9,773
14.972324.2%3.9%(+0.304)#874.9%(-0.724)#9,927
15.972024.2%3.9%(+0.291)#894.9%(-0.737)#9,968
16.972254.0%3.9%(+0.096)#944.9%(-0.933)#10,587
17.972313.9%3.9%(+0.082)#954.9%(-0.947)#10,628
18.972173.8%3.9%(-0.066)#1024.9%(-1.09)#11,185
19.972393.4%3.9%(-0.438)#1184.9%(-1.47)#12,565
20.972163.3%3.9%(-0.567)#1254.9%(-1.60)#13,026
21.972123.2%3.9%(-0.711)#1314.9%(-1.74)#13,536
22.972033.1%3.9%(-0.732)#1324.9%(-1.76)#13,610
23.972363.1%3.9%(-0.744)#1344.9%(-1.77)#13,657
24.972273.1%3.9%(-0.771)#1354.9%(-1.80)#13,746
25.972333.1%3.9%(-0.782)#1364.9%(-1.81)#13,784
26.972112.8%3.9%(-1.02)#1554.9%(-2.05)#14,625
27.972672.5%3.9%(-1.33)#1704.9%(-2.36)#15,778
28.972132.5%3.9%(-1.37)#1744.9%(-2.40)#15,919
29.972182.4%3.9%(-1.49)#1784.9%(-2.52)#16,353
30.972662.1%3.9%(-1.75)#1974.9%(-2.78)#17,264
31.972221.6%3.9%(-2.24)#2184.9%(-3.27)#18,786
32.972301.6%3.9%(-2.28)#2234.9%(-3.31)#18,898

Common Questions

What are the Top 10 Zip Codes with the Highest Percentage of Population with a Degree in Computers and Mathematics in Portland, OR?
Top 10 Zip Codes with the Highest Percentage of Population with a Degree in Computers and Mathematics in Portland, OR are:
#1
9.1%
#2
7.4%
#3
5.6%
#4
4.9%
#5
4.9%
#6
4.8%
#7
4.8%
#8
4.7%
#9
4.7%
#10
4.7%
What zip code has the Highest Percentage of Population with a Degree in Computers and Mathematics in Portland, OR?
97229 has the Highest Percentage of Population with a Degree in Computers and Mathematics in Portland, OR with 9.1%.
What is the Percentage of Population with a Degree in Computers and Mathematics in Portland, OR?
Percentage of Population with a Degree in Computers and Mathematics in Portland is 4.0%.
What is the Percentage of Population with a Degree in Computers and Mathematics in Oregon?
Percentage of Population with a Degree in Computers and Mathematics in Oregon is 3.9%.
What is the Percentage of Population with a Degree in Computers and Mathematics in the United States?
Percentage of Population with a Degree in Computers and Mathematics in the United States is 4.9%.