Zip Codes with the Highest Percentage of Families with Income Above $200,000 in Portland, OR

RELATED REPORTS & OPTIONS

Family Income | $200k+
Population
Families and Households
Female Fertility
Female Fertility (Unmarried)
Race (Community Size)
Race (Percentage)
Ancestry (Community Size)
AfghanAfricanAlaska NativeAlaskan AthabascanAlbanianAleutAlsatianAmericanApacheArabArgentineanArmenianAustralianAustrianBahamianBangladeshiBasqueBelgianBelizeanBhutaneseBlackfeetBolivianBrazilianBritishBritish West IndianBulgarianBurmeseCajunCambodianCanadianCelticCentral AmericanCentral American IndianCherokeeCheyenneChickasawChileanChineseChippewaChoctawColombianColvilleCosta RicanCreeCreekCroatianCubanCzechCzechoslovakianDanishDelawareDominicanDutchEastern EuropeanEcuadorianEgyptianEnglishEstonianEthiopianEuropeanFijianFilipinoFinnishFrenchFrench American IndianFrench CanadianGermanGerman RussianGhanaianGreekGuamanian / ChamorroGuatemalanGuyaneseHaitianHonduranHopiHungarianIcelanderIndian (Asian)IndonesianInupiatIranianIraqiIrishIroquoisIsraeliItalianJamaicanJapaneseJordanianKenyanKoreanLaotianLatvianLebaneseLiberianLithuanianLumbeeLuxembourgerMacedonianMalaysianMalteseMarshalleseMexicanMexican American IndianMongolianMoroccanNative HawaiianNavajoNepaleseNew ZealanderNicaraguanNigerianNorthern EuropeanNorwegianOkinawanOsagePaiutePakistaniPalestinianPanamanianParaguayanPennsylvania GermanPeruvianPimaPolishPortuguesePotawatomiPuebloPuerto RicanPuget Sound SalishRomanianRussianSalvadoranSamoanScandinavianScotch-IrishScottishSeminoleSenegaleseSerbianShoshoneSierra LeoneanSiouxSlavicSlovakSloveneSomaliSouth AfricanSouth AmericanSouth American IndianSoviet UnionSpaniardSpanishSpanish AmericanSpanish American IndianSri LankanSubsaharan AfricanSwedishSwissSyrianThaiTlingit-HaidaTonganTrinidadian and TobagonianTsimshianTurkishUgandanUkrainianUruguayanUteVenezuelanVietnameseWelshWest IndianYakamaYaquiYugoslavianYup'ik
Ancestry (Percentage)
AfghanAfricanAlaska NativeAlaskan AthabascanAlbanianAleutAlsatianAmericanApacheArabArgentineanArmenianAustralianAustrianBahamianBangladeshiBasqueBelgianBelizeanBhutaneseBlackfeetBolivianBrazilianBritishBritish West IndianBulgarianBurmeseCajunCambodianCanadianCelticCentral AmericanCentral American IndianCherokeeCheyenneChickasawChileanChineseChippewaChoctawColombianColvilleCosta RicanCreeCreekCroatianCubanCzechCzechoslovakianDanishDelawareDominicanDutchEastern EuropeanEcuadorianEgyptianEnglishEstonianEthiopianEuropeanFijianFilipinoFinnishFrenchFrench American IndianFrench CanadianGermanGerman RussianGhanaianGreekGuamanian / ChamorroGuatemalanGuyaneseHaitianHonduranHopiHungarianIcelanderIndian (Asian)IndonesianInupiatIranianIraqiIrishIroquoisIsraeliItalianJamaicanJapaneseJordanianKenyanKoreanLaotianLatvianLebaneseLiberianLithuanianLumbeeLuxembourgerMacedonianMalaysianMalteseMarshalleseMexicanMexican American IndianMongolianMoroccanNative HawaiianNavajoNepaleseNew ZealanderNicaraguanNigerianNorthern EuropeanNorwegianOkinawanOsagePaiutePakistaniPalestinianPanamanianParaguayanPennsylvania GermanPeruvianPimaPolishPortuguesePotawatomiPuebloPuerto RicanPuget Sound SalishRomanianRussianSalvadoranSamoanScandinavianScotch-IrishScottishSeminoleSenegaleseSerbianShoshoneSierra LeoneanSiouxSlavicSlovakSloveneSomaliSouth AfricanSouth AmericanSouth American IndianSoviet UnionSpaniardSpanishSpanish AmericanSpanish American IndianSri LankanSubsaharan AfricanSwedishSwissSyrianThaiTlingit-HaidaTonganTrinidadian and TobagonianTsimshianTurkishUgandanUkrainianUruguayanUteVenezuelanVietnameseWelshWest IndianYakamaYaquiYugoslavianYup'ik
Immigrant Origin (Total)
AfghanistanAfricaArgentinaArmeniaAsiaAustraliaAustriaBahamasBangladeshBarbadosBelarusBelgiumBelizeBosnia and HerzegovinaBrazilBulgariaBurma / MyanmarCambodiaCameroonCanadaCaribbeanCentral AmericaChileChinaColombiaCongoCosta RicaCroatiaCubaCzechoslovakiaDenmarkDominican RepublicEastern AfricaEastern AsiaEastern EuropeEcuadorEgyptEl SalvadorEnglandEritreaEthiopiaEuropeFijiFranceGermanyGhanaGreeceGuatemalaHaitiHondurasHong KongHungaryIndiaIndonesiaIranIraqIrelandIsraelItalyJamaicaJapanJordanKazakhstanKenyaKoreaKuwaitLaosLatin AmericaLatviaLebanonLiberiaLithuaniaMalaysiaMexicoMicronesiaMiddle AfricaMoldovaMoroccoNepalNetherlandsNicaraguaNigeriaNorth MacedoniaNorthern AfricaNorthern EuropeNorwayOceaniaPakistanPanamaPeruPhilippinesPolandPortugalRomaniaRussiaSaudi ArabiaScotlandSerbiaSingaporeSomaliaSouth AfricaSouth AmericaSouth Central AsiaSouth Eastern AsiaSouthern EuropeSpainSri LankaSudanSwedenSwitzerlandSyriaTaiwanThailandTrinidad and TobagoTurkeyUgandaUkraineUruguayUzbekistanVenezuelaVietnamWestern AfricaWestern AsiaWestern EuropeYemen
Immigrant Origin (Percentage)
AfghanistanAfricaArgentinaArmeniaAsiaAustraliaAustriaBahamasBangladeshBarbadosBelarusBelgiumBelizeBosnia and HerzegovinaBrazilBulgariaBurma / MyanmarCambodiaCameroonCanadaCaribbeanCentral AmericaChileChinaColombiaCongoCosta RicaCroatiaCubaCzechoslovakiaDenmarkDominican RepublicEastern AfricaEastern AsiaEastern EuropeEcuadorEgyptEl SalvadorEnglandEritreaEthiopiaEuropeFijiFranceGermanyGhanaGreeceGuatemalaHaitiHondurasHong KongHungaryIndiaIndonesiaIranIraqIrelandIsraelItalyJamaicaJapanJordanKazakhstanKenyaKoreaKuwaitLaosLatin AmericaLatviaLebanonLiberiaLithuaniaMalaysiaMexicoMicronesiaMiddle AfricaMoldovaMoroccoNepalNetherlandsNicaraguaNigeriaNorth MacedoniaNorthern AfricaNorthern EuropeNorwayOceaniaPakistanPanamaPeruPhilippinesPolandPortugalRomaniaRussiaSaudi ArabiaScotlandSerbiaSingaporeSomaliaSouth AfricaSouth AmericaSouth Central AsiaSouth Eastern AsiaSouthern EuropeSpainSri LankaSudanSwedenSwitzerlandSyriaTaiwanThailandTrinidad and TobagoTurkeyUgandaUkraineUruguayUzbekistanVenezuelaVietnamWestern AfricaWestern AsiaWestern EuropeYemen
Income
Income (Families)
Income (Households)
Poverty
Poverty (Families)
Unemployment
Employment Occupations
Employment Industries
Employer Class
Commute Time
Commute Means
School Enrollment
Education by Degree Field
Occupancy
Finances
Physical Characteristics
Portland
Compare Zip Codes
Comparison Subject

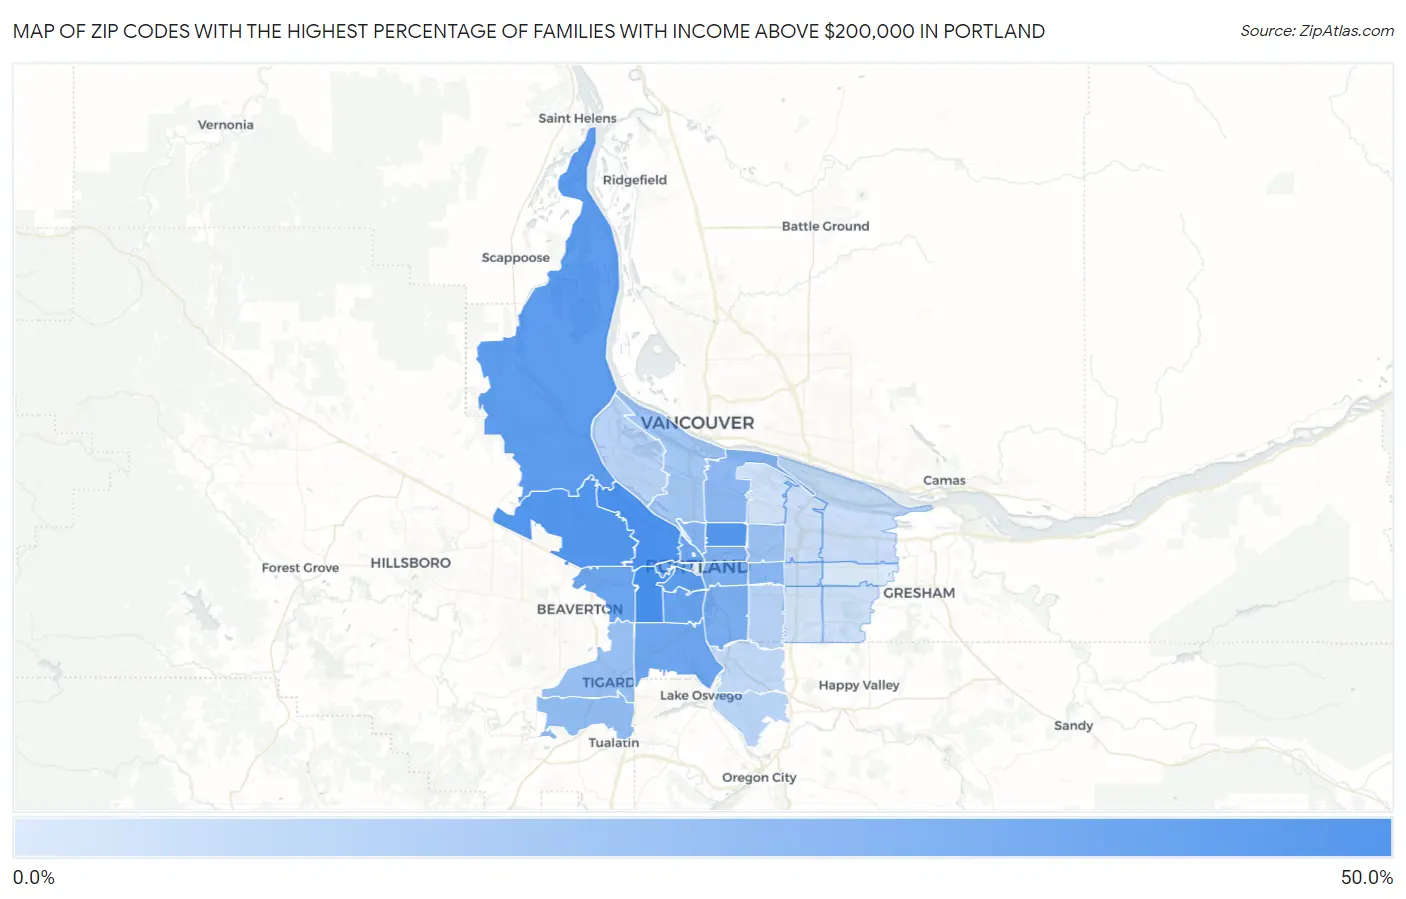
Map of Zip Codes with the Highest Percentage of Families with Income Above $200,000 in Portland

0.0%
50.0%
Zip Codes with the Highest Percentage of Families with Income Above $200,000 in Portland Map

Zip Codes with the Highest Percentage of Families with Income Above $200,000 in Portland, OR

Zip Code Families with Income > $200k vs State vs National
1.9722147.2%14.0%(+33.2)#114.8%(+32.4)#803
2.9721045.4%14.0%(+31.4)#314.8%(+30.6)#917
3.9722943.2%14.0%(+29.2)#414.8%(+28.4)#1,036
4.9721242.5%14.0%(+28.5)#614.8%(+27.7)#1,091
5.9720140.1%14.0%(+26.1)#814.8%(+25.3)#1,306
6.9723139.5%14.0%(+25.5)#914.8%(+24.7)#1,362
7.9723936.4%14.0%(+22.4)#1214.8%(+21.6)#1,686
8.9720935.3%14.0%(+21.3)#1414.8%(+20.5)#1,801
9.9722535.1%14.0%(+21.1)#1514.8%(+20.3)#1,829
10.9720534.8%14.0%(+20.8)#1614.8%(+20.0)#1,864
11.9721933.9%14.0%(+19.9)#1714.8%(+19.1)#1,970
12.9720230.7%14.0%(+16.7)#2214.8%(+15.9)#2,415
13.9721430.2%14.0%(+16.2)#2314.8%(+15.4)#2,492
14.9723229.2%14.0%(+15.2)#2614.8%(+14.4)#2,634
15.9722727.4%14.0%(+13.4)#2814.8%(+12.6)#2,981
16.9721526.3%14.0%(+12.3)#2914.8%(+11.5)#3,183
17.9721125.0%14.0%(+11.0)#3314.8%(+10.2)#3,453
18.9722423.8%14.0%(+9.80)#3714.8%(+9.00)#3,757
19.9722321.6%14.0%(+7.60)#4514.8%(+6.80)#4,322
20.9721320.6%14.0%(+6.60)#4914.8%(+5.80)#4,626
21.9721718.7%14.0%(+4.70)#5714.8%(+3.90)#5,279
22.9720613.0%14.0%(-1.00)#10714.8%(-1.80)#8,199
23.9720312.7%14.0%(-1.30)#10914.8%(-2.10)#8,420
24.9726712.0%14.0%(-2.00)#11714.8%(-2.80)#8,967
25.9722210.5%14.0%(-3.50)#13514.8%(-4.30)#10,284
26.972168.6%14.0%(-5.40)#16714.8%(-6.20)#12,405
27.972208.3%14.0%(-5.70)#17314.8%(-6.50)#12,779
28.972308.0%14.0%(-6.00)#17814.8%(-6.80)#13,167
29.972366.9%14.0%(-7.10)#21214.8%(-7.90)#14,848
30.972186.4%14.0%(-7.60)#22314.8%(-8.40)#15,714
31.972666.3%14.0%(-7.70)#22614.8%(-8.50)#15,870
32.972333.5%14.0%(-10.5)#29314.8%(-11.3)#21,464

Common Questions

What are the Top 10 Zip Codes with the Highest Percentage of Families with Income Above $200,000 in Portland, OR?
Top 10 Zip Codes with the Highest Percentage of Families with Income Above $200,000 in Portland, OR are:
#1
47.2%
#2
45.4%
#3
43.2%
#4
42.5%
#5
40.1%
#6
39.5%
#7
36.4%
#8
35.3%
#9
35.1%
#10
34.8%
What zip code has the Highest Percentage of Families with Income Above $200,000 in Portland, OR?
97221 has the Highest Percentage of Families with Income Above $200,000 in Portland, OR with 47.2%.
What is the Percentage of Families with Income Above $200,000 in Portland, OR?
Percentage of Families with Income Above $200,000 in Portland is 21.9%.
What is the Percentage of Families with Income Above $200,000 in Oregon?
Percentage of Families with Income Above $200,000 in Oregon is 14.0%.
What is the Percentage of Families with Income Above $200,000 in the United States?
Percentage of Families with Income Above $200,000 in the United States is 14.8%.