Zip Codes with the Highest Percentage of Population Employed in Computer & Mathematics in Portland, OR

RELATED REPORTS & OPTIONS

Computer & Mathematics
Population
Families and Households
Female Fertility
Female Fertility (Unmarried)
Race (Community Size)
Race (Percentage)
Ancestry (Community Size)
AfghanAfricanAlaska NativeAlaskan AthabascanAlbanianAleutAlsatianAmericanApacheArabArgentineanArmenianAustralianAustrianBahamianBangladeshiBasqueBelgianBelizeanBhutaneseBlackfeetBolivianBrazilianBritishBritish West IndianBulgarianBurmeseCajunCambodianCanadianCelticCentral AmericanCentral American IndianCherokeeCheyenneChickasawChileanChineseChippewaChoctawColombianColvilleCosta RicanCreeCreekCroatianCubanCzechCzechoslovakianDanishDelawareDominicanDutchEastern EuropeanEcuadorianEgyptianEnglishEstonianEthiopianEuropeanFijianFilipinoFinnishFrenchFrench American IndianFrench CanadianGermanGerman RussianGhanaianGreekGuamanian / ChamorroGuatemalanGuyaneseHaitianHonduranHopiHungarianIcelanderIndian (Asian)IndonesianInupiatIranianIraqiIrishIroquoisIsraeliItalianJamaicanJapaneseJordanianKenyanKoreanLaotianLatvianLebaneseLiberianLithuanianLumbeeLuxembourgerMacedonianMalaysianMalteseMarshalleseMexicanMexican American IndianMongolianMoroccanNative HawaiianNavajoNepaleseNew ZealanderNicaraguanNigerianNorthern EuropeanNorwegianOkinawanOsagePaiutePakistaniPalestinianPanamanianParaguayanPennsylvania GermanPeruvianPimaPolishPortuguesePotawatomiPuebloPuerto RicanPuget Sound SalishRomanianRussianSalvadoranSamoanScandinavianScotch-IrishScottishSeminoleSenegaleseSerbianShoshoneSierra LeoneanSiouxSlavicSlovakSloveneSomaliSouth AfricanSouth AmericanSouth American IndianSoviet UnionSpaniardSpanishSpanish AmericanSpanish American IndianSri LankanSubsaharan AfricanSwedishSwissSyrianThaiTlingit-HaidaTonganTrinidadian and TobagonianTsimshianTurkishUgandanUkrainianUruguayanUteVenezuelanVietnameseWelshWest IndianYakamaYaquiYugoslavianYup'ik
Ancestry (Percentage)
AfghanAfricanAlaska NativeAlaskan AthabascanAlbanianAleutAlsatianAmericanApacheArabArgentineanArmenianAustralianAustrianBahamianBangladeshiBasqueBelgianBelizeanBhutaneseBlackfeetBolivianBrazilianBritishBritish West IndianBulgarianBurmeseCajunCambodianCanadianCelticCentral AmericanCentral American IndianCherokeeCheyenneChickasawChileanChineseChippewaChoctawColombianColvilleCosta RicanCreeCreekCroatianCubanCzechCzechoslovakianDanishDelawareDominicanDutchEastern EuropeanEcuadorianEgyptianEnglishEstonianEthiopianEuropeanFijianFilipinoFinnishFrenchFrench American IndianFrench CanadianGermanGerman RussianGhanaianGreekGuamanian / ChamorroGuatemalanGuyaneseHaitianHonduranHopiHungarianIcelanderIndian (Asian)IndonesianInupiatIranianIraqiIrishIroquoisIsraeliItalianJamaicanJapaneseJordanianKenyanKoreanLaotianLatvianLebaneseLiberianLithuanianLumbeeLuxembourgerMacedonianMalaysianMalteseMarshalleseMexicanMexican American IndianMongolianMoroccanNative HawaiianNavajoNepaleseNew ZealanderNicaraguanNigerianNorthern EuropeanNorwegianOkinawanOsagePaiutePakistaniPalestinianPanamanianParaguayanPennsylvania GermanPeruvianPimaPolishPortuguesePotawatomiPuebloPuerto RicanPuget Sound SalishRomanianRussianSalvadoranSamoanScandinavianScotch-IrishScottishSeminoleSenegaleseSerbianShoshoneSierra LeoneanSiouxSlavicSlovakSloveneSomaliSouth AfricanSouth AmericanSouth American IndianSoviet UnionSpaniardSpanishSpanish AmericanSpanish American IndianSri LankanSubsaharan AfricanSwedishSwissSyrianThaiTlingit-HaidaTonganTrinidadian and TobagonianTsimshianTurkishUgandanUkrainianUruguayanUteVenezuelanVietnameseWelshWest IndianYakamaYaquiYugoslavianYup'ik
Immigrant Origin (Total)
AfghanistanAfricaArgentinaArmeniaAsiaAustraliaAustriaBahamasBangladeshBarbadosBelarusBelgiumBelizeBosnia and HerzegovinaBrazilBulgariaBurma / MyanmarCambodiaCameroonCanadaCaribbeanCentral AmericaChileChinaColombiaCongoCosta RicaCroatiaCubaCzechoslovakiaDenmarkDominican RepublicEastern AfricaEastern AsiaEastern EuropeEcuadorEgyptEl SalvadorEnglandEritreaEthiopiaEuropeFijiFranceGermanyGhanaGreeceGuatemalaHaitiHondurasHong KongHungaryIndiaIndonesiaIranIraqIrelandIsraelItalyJamaicaJapanJordanKazakhstanKenyaKoreaKuwaitLaosLatin AmericaLatviaLebanonLiberiaLithuaniaMalaysiaMexicoMicronesiaMiddle AfricaMoldovaMoroccoNepalNetherlandsNicaraguaNigeriaNorth MacedoniaNorthern AfricaNorthern EuropeNorwayOceaniaPakistanPanamaPeruPhilippinesPolandPortugalRomaniaRussiaSaudi ArabiaScotlandSerbiaSingaporeSomaliaSouth AfricaSouth AmericaSouth Central AsiaSouth Eastern AsiaSouthern EuropeSpainSri LankaSudanSwedenSwitzerlandSyriaTaiwanThailandTrinidad and TobagoTurkeyUgandaUkraineUruguayUzbekistanVenezuelaVietnamWestern AfricaWestern AsiaWestern EuropeYemen
Immigrant Origin (Percentage)
AfghanistanAfricaArgentinaArmeniaAsiaAustraliaAustriaBahamasBangladeshBarbadosBelarusBelgiumBelizeBosnia and HerzegovinaBrazilBulgariaBurma / MyanmarCambodiaCameroonCanadaCaribbeanCentral AmericaChileChinaColombiaCongoCosta RicaCroatiaCubaCzechoslovakiaDenmarkDominican RepublicEastern AfricaEastern AsiaEastern EuropeEcuadorEgyptEl SalvadorEnglandEritreaEthiopiaEuropeFijiFranceGermanyGhanaGreeceGuatemalaHaitiHondurasHong KongHungaryIndiaIndonesiaIranIraqIrelandIsraelItalyJamaicaJapanJordanKazakhstanKenyaKoreaKuwaitLaosLatin AmericaLatviaLebanonLiberiaLithuaniaMalaysiaMexicoMicronesiaMiddle AfricaMoldovaMoroccoNepalNetherlandsNicaraguaNigeriaNorth MacedoniaNorthern AfricaNorthern EuropeNorwayOceaniaPakistanPanamaPeruPhilippinesPolandPortugalRomaniaRussiaSaudi ArabiaScotlandSerbiaSingaporeSomaliaSouth AfricaSouth AmericaSouth Central AsiaSouth Eastern AsiaSouthern EuropeSpainSri LankaSudanSwedenSwitzerlandSyriaTaiwanThailandTrinidad and TobagoTurkeyUgandaUkraineUruguayUzbekistanVenezuelaVietnamWestern AfricaWestern AsiaWestern EuropeYemen
Income
Income (Families)
Income (Households)
Poverty
Poverty (Families)
Unemployment
Employment Occupations
Employment Industries
Employer Class
Commute Time
Commute Means
School Enrollment
Education by Degree Field
Occupancy
Finances
Physical Characteristics
Portland
Compare Zip Codes
Comparison Subject

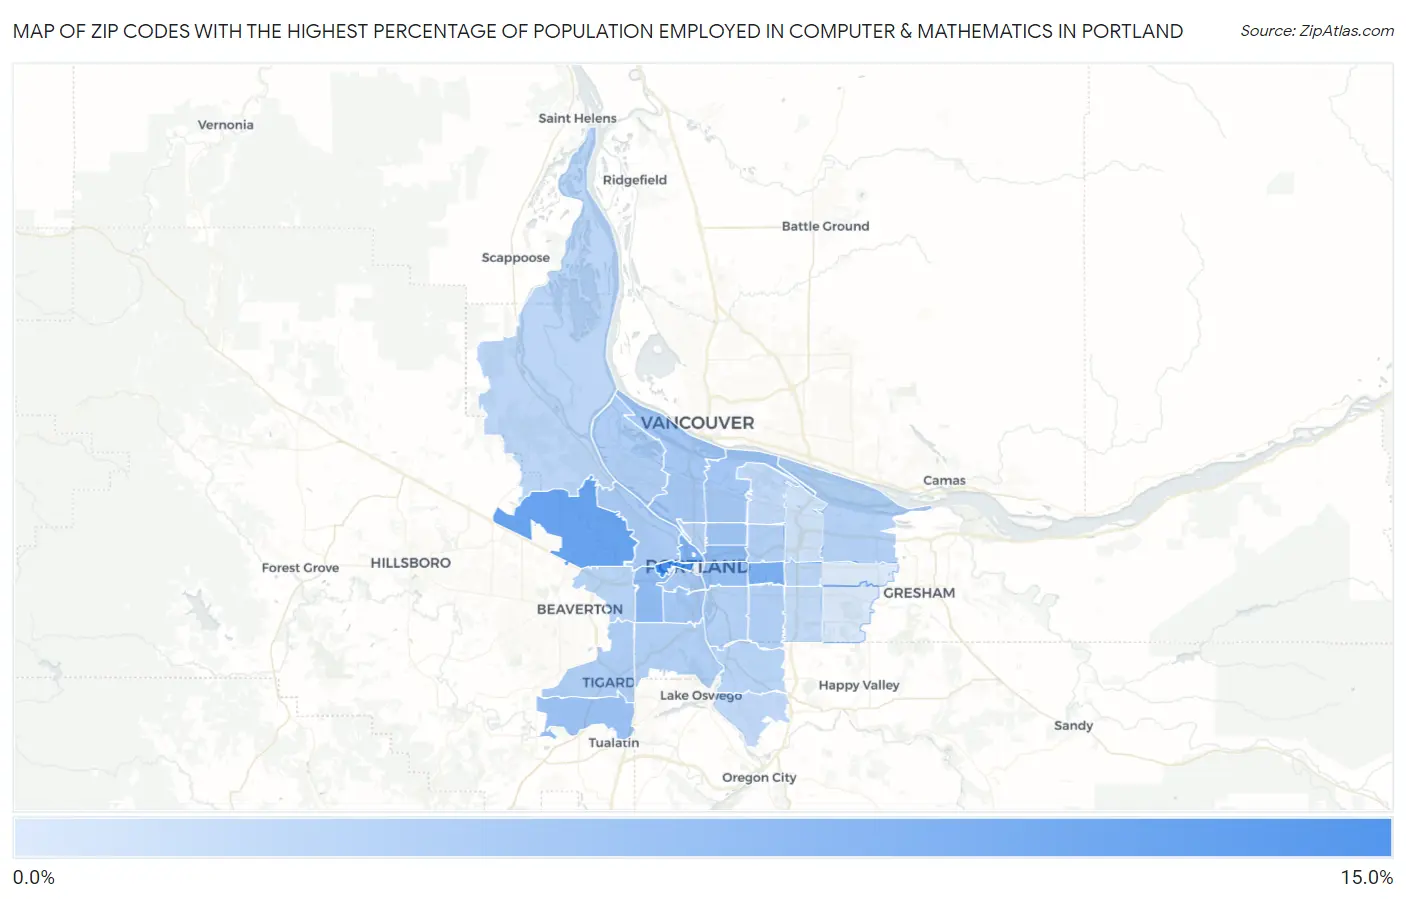
Map of Zip Codes with the Highest Percentage of Population Employed in Computer & Mathematics in Portland

0.0%
15.0%
Zip Codes with the Highest Percentage of Population Employed in Computer & Mathematics in Portland Map

Zip Codes with the Highest Percentage of Population Employed in Computer & Mathematics in Portland, OR

Zip Code % Employed vs State vs National
1.9720512.9%3.5%(+9.42)#73.5%(+9.34)#371
2.9722910.0%3.5%(+6.57)#83.5%(+6.50)#706
3.972158.6%3.5%(+5.17)#153.5%(+5.10)#1,016
4.972098.6%3.5%(+5.10)#163.5%(+5.03)#1,034
5.972327.3%3.5%(+3.87)#183.5%(+3.80)#1,451
6.972217.1%3.5%(+3.65)#193.5%(+3.58)#1,566
7.972146.6%3.5%(+3.14)#213.5%(+3.07)#1,861
8.972246.2%3.5%(+2.72)#243.5%(+2.65)#2,163
9.972125.8%3.5%(+2.37)#273.5%(+2.30)#2,482
10.972175.5%3.5%(+2.00)#333.5%(+1.93)#2,838
11.972395.5%3.5%(+2.00)#343.5%(+1.93)#2,842
12.972115.4%3.5%(+1.98)#353.5%(+1.91)#2,854
13.972015.3%3.5%(+1.83)#373.5%(+1.76)#3,026
14.972105.0%3.5%(+1.51)#413.5%(+1.44)#3,397
15.972034.8%3.5%(+1.39)#443.5%(+1.32)#3,570
16.972234.7%3.5%(+1.27)#473.5%(+1.20)#3,753
17.972194.5%3.5%(+1.08)#493.5%(+1.01)#4,030
18.972064.5%3.5%(+1.02)#513.5%(+0.945)#4,132
19.972134.4%3.5%(+0.989)#523.5%(+0.919)#4,194
20.972024.3%3.5%(+0.848)#593.5%(+0.777)#4,428
21.972304.3%3.5%(+0.804)#613.5%(+0.733)#4,499
22.972274.2%3.5%(+0.794)#623.5%(+0.723)#4,522
23.972254.0%3.5%(+0.572)#643.5%(+0.502)#4,979
24.972223.9%3.5%(+0.470)#693.5%(+0.400)#5,202
25.972313.8%3.5%(+0.298)#763.5%(+0.228)#5,589
26.972163.7%3.5%(+0.266)#793.5%(+0.195)#5,668
27.972183.5%3.5%(+0.061)#873.5%(-0.010)#6,169
28.972673.4%3.5%(-0.103)#923.5%(-0.174)#6,621
29.972663.2%3.5%(-0.278)#1003.5%(-0.348)#7,171
30.972202.4%3.5%(-1.06)#1383.5%(-1.13)#10,059
31.972361.6%3.5%(-1.85)#1793.5%(-1.92)#13,796
32.972331.4%3.5%(-2.05)#1883.5%(-2.12)#14,917

Common Questions

What are the Top 10 Zip Codes with the Highest Percentage of Population Employed in Computer & Mathematics in Portland, OR?
Top 10 Zip Codes with the Highest Percentage of Population Employed in Computer & Mathematics in Portland, OR are:
#1
12.9%
#2
10.0%
#3
8.6%
#4
8.6%
#5
7.3%
#6
7.1%
#7
6.6%
#8
6.2%
#9
5.8%
#10
5.5%
What zip code has the Highest Percentage of Population Employed in Computer & Mathematics in Portland, OR?
97205 has the Highest Percentage of Population Employed in Computer & Mathematics in Portland, OR with 12.9%.
What is the Percentage of Population Employed in Computer & Mathematics in Portland, OR?
Percentage of Population Employed in Computer & Mathematics in Portland is 4.9%.
What is the Percentage of Population Employed in Computer & Mathematics in Oregon?
Percentage of Population Employed in Computer & Mathematics in Oregon is 3.5%.
What is the Percentage of Population Employed in Computer & Mathematics in the United States?
Percentage of Population Employed in Computer & Mathematics in the United States is 3.5%.