Zip Codes with the Highest Percentage of Population with a Degree in Education in Portland, OR

RELATED REPORTS & OPTIONS

Education
Population
Families and Households
Female Fertility
Female Fertility (Unmarried)
Race (Community Size)
Race (Percentage)
Ancestry (Community Size)
AfghanAfricanAlaska NativeAlaskan AthabascanAlbanianAleutAlsatianAmericanApacheArabArgentineanArmenianAustralianAustrianBahamianBangladeshiBasqueBelgianBelizeanBhutaneseBlackfeetBolivianBrazilianBritishBritish West IndianBulgarianBurmeseCajunCambodianCanadianCelticCentral AmericanCentral American IndianCherokeeCheyenneChickasawChileanChineseChippewaChoctawColombianColvilleCosta RicanCreeCreekCroatianCubanCzechCzechoslovakianDanishDelawareDominicanDutchEastern EuropeanEcuadorianEgyptianEnglishEstonianEthiopianEuropeanFijianFilipinoFinnishFrenchFrench American IndianFrench CanadianGermanGerman RussianGhanaianGreekGuamanian / ChamorroGuatemalanGuyaneseHaitianHonduranHopiHungarianIcelanderIndian (Asian)IndonesianInupiatIranianIraqiIrishIroquoisIsraeliItalianJamaicanJapaneseJordanianKenyanKoreanLaotianLatvianLebaneseLiberianLithuanianLumbeeLuxembourgerMacedonianMalaysianMalteseMarshalleseMexicanMexican American IndianMongolianMoroccanNative HawaiianNavajoNepaleseNew ZealanderNicaraguanNigerianNorthern EuropeanNorwegianOkinawanOsagePaiutePakistaniPalestinianPanamanianParaguayanPennsylvania GermanPeruvianPimaPolishPortuguesePotawatomiPuebloPuerto RicanPuget Sound SalishRomanianRussianSalvadoranSamoanScandinavianScotch-IrishScottishSeminoleSenegaleseSerbianShoshoneSierra LeoneanSiouxSlavicSlovakSloveneSomaliSouth AfricanSouth AmericanSouth American IndianSoviet UnionSpaniardSpanishSpanish AmericanSpanish American IndianSri LankanSubsaharan AfricanSwedishSwissSyrianThaiTlingit-HaidaTonganTrinidadian and TobagonianTsimshianTurkishUgandanUkrainianUruguayanUteVenezuelanVietnameseWelshWest IndianYakamaYaquiYugoslavianYup'ik
Ancestry (Percentage)
AfghanAfricanAlaska NativeAlaskan AthabascanAlbanianAleutAlsatianAmericanApacheArabArgentineanArmenianAustralianAustrianBahamianBangladeshiBasqueBelgianBelizeanBhutaneseBlackfeetBolivianBrazilianBritishBritish West IndianBulgarianBurmeseCajunCambodianCanadianCelticCentral AmericanCentral American IndianCherokeeCheyenneChickasawChileanChineseChippewaChoctawColombianColvilleCosta RicanCreeCreekCroatianCubanCzechCzechoslovakianDanishDelawareDominicanDutchEastern EuropeanEcuadorianEgyptianEnglishEstonianEthiopianEuropeanFijianFilipinoFinnishFrenchFrench American IndianFrench CanadianGermanGerman RussianGhanaianGreekGuamanian / ChamorroGuatemalanGuyaneseHaitianHonduranHopiHungarianIcelanderIndian (Asian)IndonesianInupiatIranianIraqiIrishIroquoisIsraeliItalianJamaicanJapaneseJordanianKenyanKoreanLaotianLatvianLebaneseLiberianLithuanianLumbeeLuxembourgerMacedonianMalaysianMalteseMarshalleseMexicanMexican American IndianMongolianMoroccanNative HawaiianNavajoNepaleseNew ZealanderNicaraguanNigerianNorthern EuropeanNorwegianOkinawanOsagePaiutePakistaniPalestinianPanamanianParaguayanPennsylvania GermanPeruvianPimaPolishPortuguesePotawatomiPuebloPuerto RicanPuget Sound SalishRomanianRussianSalvadoranSamoanScandinavianScotch-IrishScottishSeminoleSenegaleseSerbianShoshoneSierra LeoneanSiouxSlavicSlovakSloveneSomaliSouth AfricanSouth AmericanSouth American IndianSoviet UnionSpaniardSpanishSpanish AmericanSpanish American IndianSri LankanSubsaharan AfricanSwedishSwissSyrianThaiTlingit-HaidaTonganTrinidadian and TobagonianTsimshianTurkishUgandanUkrainianUruguayanUteVenezuelanVietnameseWelshWest IndianYakamaYaquiYugoslavianYup'ik
Immigrant Origin (Total)
AfghanistanAfricaArgentinaArmeniaAsiaAustraliaAustriaBahamasBangladeshBarbadosBelarusBelgiumBelizeBosnia and HerzegovinaBrazilBulgariaBurma / MyanmarCambodiaCameroonCanadaCaribbeanCentral AmericaChileChinaColombiaCongoCosta RicaCroatiaCubaCzechoslovakiaDenmarkDominican RepublicEastern AfricaEastern AsiaEastern EuropeEcuadorEgyptEl SalvadorEnglandEritreaEthiopiaEuropeFijiFranceGermanyGhanaGreeceGuatemalaHaitiHondurasHong KongHungaryIndiaIndonesiaIranIraqIrelandIsraelItalyJamaicaJapanJordanKazakhstanKenyaKoreaKuwaitLaosLatin AmericaLatviaLebanonLiberiaLithuaniaMalaysiaMexicoMicronesiaMiddle AfricaMoldovaMoroccoNepalNetherlandsNicaraguaNigeriaNorth MacedoniaNorthern AfricaNorthern EuropeNorwayOceaniaPakistanPanamaPeruPhilippinesPolandPortugalRomaniaRussiaSaudi ArabiaScotlandSerbiaSingaporeSomaliaSouth AfricaSouth AmericaSouth Central AsiaSouth Eastern AsiaSouthern EuropeSpainSri LankaSudanSwedenSwitzerlandSyriaTaiwanThailandTrinidad and TobagoTurkeyUgandaUkraineUruguayUzbekistanVenezuelaVietnamWestern AfricaWestern AsiaWestern EuropeYemen
Immigrant Origin (Percentage)
AfghanistanAfricaArgentinaArmeniaAsiaAustraliaAustriaBahamasBangladeshBarbadosBelarusBelgiumBelizeBosnia and HerzegovinaBrazilBulgariaBurma / MyanmarCambodiaCameroonCanadaCaribbeanCentral AmericaChileChinaColombiaCongoCosta RicaCroatiaCubaCzechoslovakiaDenmarkDominican RepublicEastern AfricaEastern AsiaEastern EuropeEcuadorEgyptEl SalvadorEnglandEritreaEthiopiaEuropeFijiFranceGermanyGhanaGreeceGuatemalaHaitiHondurasHong KongHungaryIndiaIndonesiaIranIraqIrelandIsraelItalyJamaicaJapanJordanKazakhstanKenyaKoreaKuwaitLaosLatin AmericaLatviaLebanonLiberiaLithuaniaMalaysiaMexicoMicronesiaMiddle AfricaMoldovaMoroccoNepalNetherlandsNicaraguaNigeriaNorth MacedoniaNorthern AfricaNorthern EuropeNorwayOceaniaPakistanPanamaPeruPhilippinesPolandPortugalRomaniaRussiaSaudi ArabiaScotlandSerbiaSingaporeSomaliaSouth AfricaSouth AmericaSouth Central AsiaSouth Eastern AsiaSouthern EuropeSpainSri LankaSudanSwedenSwitzerlandSyriaTaiwanThailandTrinidad and TobagoTurkeyUgandaUkraineUruguayUzbekistanVenezuelaVietnamWestern AfricaWestern AsiaWestern EuropeYemen
Income
Income (Families)
Income (Households)
Poverty
Poverty (Families)
Unemployment
Employment Occupations
Employment Industries
Employer Class
Commute Time
Commute Means
School Enrollment
Education by Degree Field
Occupancy
Finances
Physical Characteristics
Portland
Compare Zip Codes
Comparison Subject

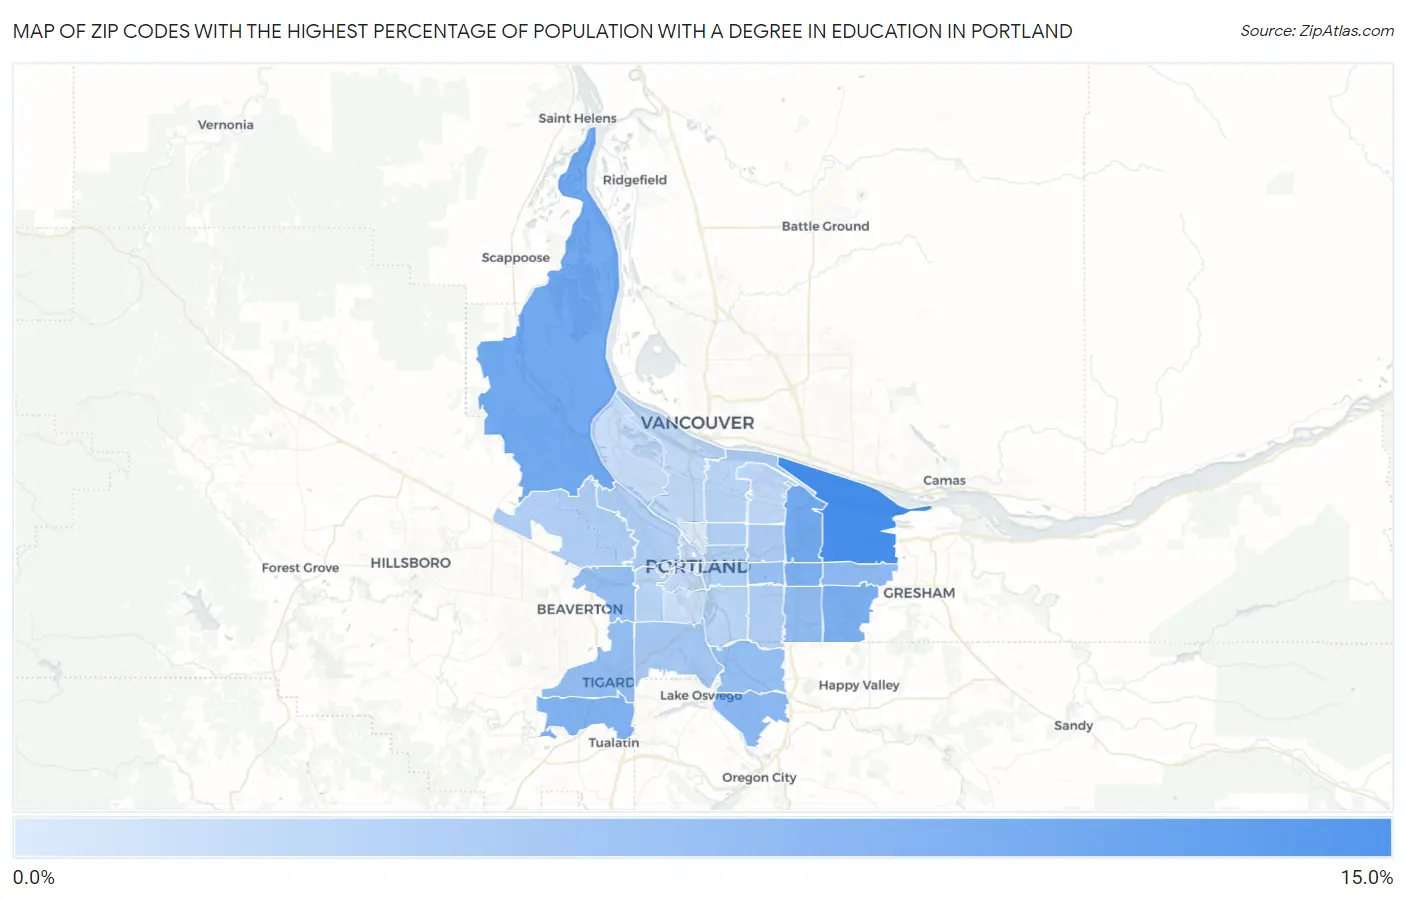
Map of Zip Codes with the Highest Percentage of Population with a Degree in Education in Portland

0.0%
15.0%
Zip Codes with the Highest Percentage of Population with a Degree in Education in Portland Map

Zip Codes with the Highest Percentage of Population with a Degree in Education in Portland, OR

Zip Code % Graduates vs State vs National
1.9723013.1%9.1%(+3.98)#16211.1%(+2.07)#18,083
2.972209.7%9.1%(+0.555)#23911.1%(-1.36)#22,750
3.972319.6%9.1%(+0.472)#24211.1%(-1.44)#22,853
4.972369.0%9.1%(-0.161)#25411.1%(-2.08)#23,713
5.972168.7%9.1%(-0.477)#25811.1%(-2.39)#24,088
6.972248.5%9.1%(-0.672)#26211.1%(-2.59)#24,321
7.972677.8%9.1%(-1.31)#28211.1%(-3.23)#25,060
8.972337.4%9.1%(-1.75)#29411.1%(-3.66)#25,503
9.972667.3%9.1%(-1.84)#29611.1%(-3.76)#25,595
10.972237.2%9.1%(-1.95)#29711.1%(-3.86)#25,705
11.972257.0%9.1%(-2.16)#30211.1%(-4.07)#25,941
12.972226.9%9.1%(-2.22)#30411.1%(-4.13)#25,992
13.972156.8%9.1%(-2.34)#30511.1%(-4.26)#26,112
14.972195.7%9.1%(-3.47)#31511.1%(-5.38)#27,082
15.972135.1%9.1%(-4.00)#32511.1%(-5.92)#27,473
16.972324.9%9.1%(-4.25)#32711.1%(-6.17)#27,630
17.972104.9%9.1%(-4.26)#32811.1%(-6.18)#27,636
18.972064.8%9.1%(-4.30)#33011.1%(-6.22)#27,659
19.972294.8%9.1%(-4.37)#33111.1%(-6.29)#27,701
20.972144.6%9.1%(-4.51)#33311.1%(-6.43)#27,814
21.972124.6%9.1%(-4.56)#33411.1%(-6.48)#27,842
22.972114.2%9.1%(-4.92)#33611.1%(-6.84)#28,048
23.972214.2%9.1%(-4.98)#33711.1%(-6.89)#28,083
24.972024.2%9.1%(-4.98)#33811.1%(-6.89)#28,097
25.972183.8%9.1%(-5.39)#34211.1%(-7.31)#28,343
26.972173.7%9.1%(-5.45)#34311.1%(-7.36)#28,378
27.972093.6%9.1%(-5.55)#34511.1%(-7.47)#28,426
28.972013.6%9.1%(-5.56)#34611.1%(-7.48)#28,431
29.972033.1%9.1%(-6.01)#35011.1%(-7.93)#28,637
30.972392.8%9.1%(-6.33)#35311.1%(-8.25)#28,758
31.972051.7%9.1%(-7.40)#35611.1%(-9.31)#29,043
32.972271.6%9.1%(-7.55)#35811.1%(-9.47)#29,073

Common Questions

What are the Top 10 Zip Codes with the Highest Percentage of Population with a Degree in Education in Portland, OR?
Top 10 Zip Codes with the Highest Percentage of Population with a Degree in Education in Portland, OR are:
#1
13.1%
#2
9.7%
#3
9.6%
#4
9.0%
#5
8.7%
#6
8.5%
#7
7.8%
#8
7.4%
#9
7.3%
#10
7.2%
What zip code has the Highest Percentage of Population with a Degree in Education in Portland, OR?
97230 has the Highest Percentage of Population with a Degree in Education in Portland, OR with 13.1%.
What is the Percentage of Population with a Degree in Education in Portland, OR?
Percentage of Population with a Degree in Education in Portland is 4.9%.
What is the Percentage of Population with a Degree in Education in Oregon?
Percentage of Population with a Degree in Education in Oregon is 9.1%.
What is the Percentage of Population with a Degree in Education in the United States?
Percentage of Population with a Degree in Education in the United States is 11.1%.