Zip Codes with the Highest Percentage of Population Employed in Agriculture, Fishing & Hunting in Portland, OR
RELATED REPORTS & OPTIONS
Agriculture, Fishing & Hunting
Portland
Compare Zip Codes
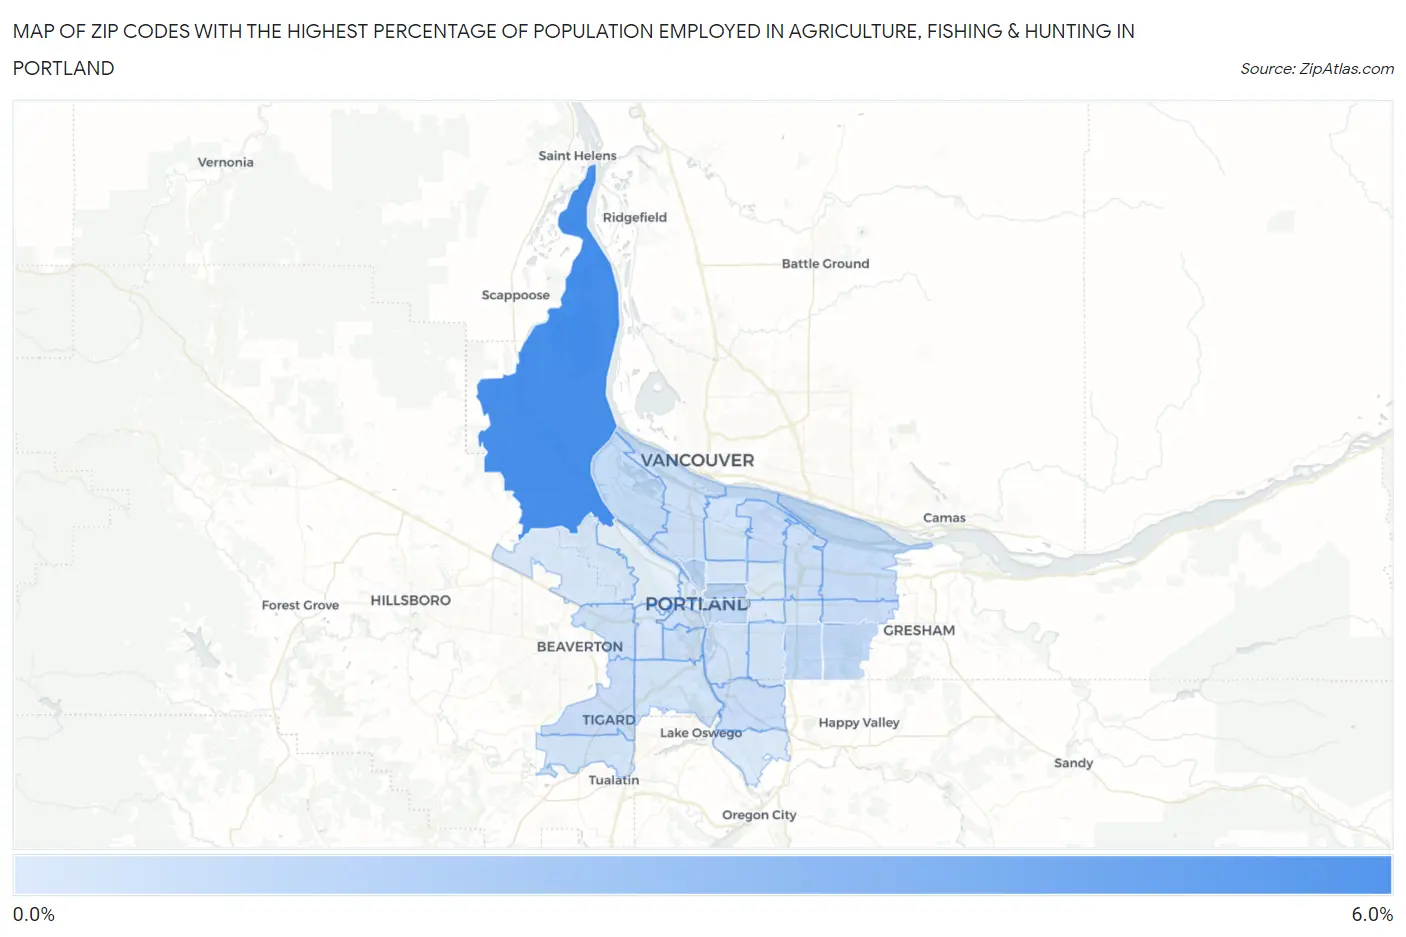
Map of Zip Codes with the Highest Percentage of Population Employed in Agriculture, Fishing & Hunting in Portland
0.078%
5.8%
Zip Codes with the Highest Percentage of Population Employed in Agriculture, Fishing & Hunting in Portland, OR
| Zip Code | % Employed | vs State | vs National | |
| 1. | 97231 | 5.8% | 2.7%(+3.09)#174 | 1.2%(+4.61)#7,082 |
| 2. | 97227 | 1.5% | 2.7%(-1.22)#300 | 1.2%(+0.309)#14,266 |
| 3. | 97232 | 1.5% | 2.7%(-1.27)#304 | 1.2%(+0.259)#14,447 |
| 4. | 97236 | 1.1% | 2.7%(-1.60)#310 | 1.2%(-0.073)#15,695 |
| 5. | 97266 | 1.1% | 2.7%(-1.64)#313 | 1.2%(-0.110)#15,848 |
| 6. | 97214 | 1.0% | 2.7%(-1.70)#319 | 1.2%(-0.176)#16,114 |
| 7. | 97203 | 0.97% | 2.7%(-1.76)#323 | 1.2%(-0.234)#16,382 |
| 8. | 97230 | 0.87% | 2.7%(-1.85)#329 | 1.2%(-0.326)#16,852 |
| 9. | 97222 | 0.81% | 2.7%(-1.92)#334 | 1.2%(-0.394)#17,209 |
| 10. | 97239 | 0.79% | 2.7%(-1.93)#335 | 1.2%(-0.407)#17,279 |
| 11. | 97223 | 0.75% | 2.7%(-1.97)#336 | 1.2%(-0.448)#17,526 |
| 12. | 97233 | 0.73% | 2.7%(-1.99)#337 | 1.2%(-0.465)#17,635 |
| 13. | 97218 | 0.73% | 2.7%(-1.99)#338 | 1.2%(-0.467)#17,650 |
| 14. | 97220 | 0.71% | 2.7%(-2.02)#339 | 1.2%(-0.491)#17,800 |
| 15. | 97201 | 0.61% | 2.7%(-2.11)#343 | 1.2%(-0.587)#18,401 |
| 16. | 97217 | 0.57% | 2.7%(-2.15)#345 | 1.2%(-0.628)#18,697 |
| 17. | 97225 | 0.56% | 2.7%(-2.17)#347 | 1.2%(-0.644)#18,803 |
| 18. | 97202 | 0.48% | 2.7%(-2.24)#350 | 1.2%(-0.717)#19,427 |
| 19. | 97206 | 0.44% | 2.7%(-2.28)#354 | 1.2%(-0.756)#19,761 |
| 20. | 97211 | 0.44% | 2.7%(-2.29)#356 | 1.2%(-0.763)#19,835 |
| 21. | 97219 | 0.41% | 2.7%(-2.32)#359 | 1.2%(-0.791)#20,077 |
| 22. | 97224 | 0.40% | 2.7%(-2.32)#360 | 1.2%(-0.794)#20,113 |
| 23. | 97216 | 0.31% | 2.7%(-2.42)#362 | 1.2%(-0.891)#21,080 |
| 24. | 97212 | 0.28% | 2.7%(-2.45)#363 | 1.2%(-0.922)#21,442 |
| 25. | 97229 | 0.21% | 2.7%(-2.51)#364 | 1.2%(-0.990)#22,246 |
| 26. | 97221 | 0.18% | 2.7%(-2.55)#366 | 1.2%(-1.02)#22,619 |
| 27. | 97209 | 0.12% | 2.7%(-2.60)#367 | 1.2%(-1.08)#23,403 |
| 28. | 97213 | 0.10% | 2.7%(-2.62)#368 | 1.2%(-1.09)#23,609 |
| 29. | 97267 | 0.085% | 2.7%(-2.64)#369 | 1.2%(-1.11)#23,886 |
| 30. | 97215 | 0.078% | 2.7%(-2.65)#371 | 1.2%(-1.12)#23,992 |
1
Common Questions
What are the Top 10 Zip Codes with the Highest Percentage of Population Employed in Agriculture, Fishing & Hunting in Portland, OR?
Top 10 Zip Codes with the Highest Percentage of Population Employed in Agriculture, Fishing & Hunting in Portland, OR are:
What zip code has the Highest Percentage of Population Employed in Agriculture, Fishing & Hunting in Portland, OR?
97231 has the Highest Percentage of Population Employed in Agriculture, Fishing & Hunting in Portland, OR with 5.8%.
What is the Percentage of Population Employed in Agriculture, Fishing & Hunting in Portland, OR?
Percentage of Population Employed in Agriculture, Fishing & Hunting in Portland is 0.54%.
What is the Percentage of Population Employed in Agriculture, Fishing & Hunting in Oregon?
Percentage of Population Employed in Agriculture, Fishing & Hunting in Oregon is 2.7%.
What is the Percentage of Population Employed in Agriculture, Fishing & Hunting in the United States?
Percentage of Population Employed in Agriculture, Fishing & Hunting in the United States is 1.2%.