Zip Codes with the Highest Percentage of Population Employed in Legal Services & Support in Portland, OR

RELATED REPORTS & OPTIONS

Legal Services & Support
Population
Families and Households
Female Fertility
Female Fertility (Unmarried)
Race (Community Size)
Race (Percentage)
Ancestry (Community Size)
AfghanAfricanAlaska NativeAlaskan AthabascanAlbanianAleutAlsatianAmericanApacheArabArgentineanArmenianAustralianAustrianBahamianBangladeshiBasqueBelgianBelizeanBhutaneseBlackfeetBolivianBrazilianBritishBritish West IndianBulgarianBurmeseCajunCambodianCanadianCelticCentral AmericanCentral American IndianCherokeeCheyenneChickasawChileanChineseChippewaChoctawColombianColvilleCosta RicanCreeCreekCroatianCubanCzechCzechoslovakianDanishDelawareDominicanDutchEastern EuropeanEcuadorianEgyptianEnglishEstonianEthiopianEuropeanFijianFilipinoFinnishFrenchFrench American IndianFrench CanadianGermanGerman RussianGhanaianGreekGuamanian / ChamorroGuatemalanGuyaneseHaitianHonduranHopiHungarianIcelanderIndian (Asian)IndonesianInupiatIranianIraqiIrishIroquoisIsraeliItalianJamaicanJapaneseJordanianKenyanKoreanLaotianLatvianLebaneseLiberianLithuanianLumbeeLuxembourgerMacedonianMalaysianMalteseMarshalleseMexicanMexican American IndianMongolianMoroccanNative HawaiianNavajoNepaleseNew ZealanderNicaraguanNigerianNorthern EuropeanNorwegianOkinawanOsagePaiutePakistaniPalestinianPanamanianParaguayanPennsylvania GermanPeruvianPimaPolishPortuguesePotawatomiPuebloPuerto RicanPuget Sound SalishRomanianRussianSalvadoranSamoanScandinavianScotch-IrishScottishSeminoleSenegaleseSerbianShoshoneSierra LeoneanSiouxSlavicSlovakSloveneSomaliSouth AfricanSouth AmericanSouth American IndianSoviet UnionSpaniardSpanishSpanish AmericanSpanish American IndianSri LankanSubsaharan AfricanSwedishSwissSyrianThaiTlingit-HaidaTonganTrinidadian and TobagonianTsimshianTurkishUgandanUkrainianUruguayanUteVenezuelanVietnameseWelshWest IndianYakamaYaquiYugoslavianYup'ik
Ancestry (Percentage)
AfghanAfricanAlaska NativeAlaskan AthabascanAlbanianAleutAlsatianAmericanApacheArabArgentineanArmenianAustralianAustrianBahamianBangladeshiBasqueBelgianBelizeanBhutaneseBlackfeetBolivianBrazilianBritishBritish West IndianBulgarianBurmeseCajunCambodianCanadianCelticCentral AmericanCentral American IndianCherokeeCheyenneChickasawChileanChineseChippewaChoctawColombianColvilleCosta RicanCreeCreekCroatianCubanCzechCzechoslovakianDanishDelawareDominicanDutchEastern EuropeanEcuadorianEgyptianEnglishEstonianEthiopianEuropeanFijianFilipinoFinnishFrenchFrench American IndianFrench CanadianGermanGerman RussianGhanaianGreekGuamanian / ChamorroGuatemalanGuyaneseHaitianHonduranHopiHungarianIcelanderIndian (Asian)IndonesianInupiatIranianIraqiIrishIroquoisIsraeliItalianJamaicanJapaneseJordanianKenyanKoreanLaotianLatvianLebaneseLiberianLithuanianLumbeeLuxembourgerMacedonianMalaysianMalteseMarshalleseMexicanMexican American IndianMongolianMoroccanNative HawaiianNavajoNepaleseNew ZealanderNicaraguanNigerianNorthern EuropeanNorwegianOkinawanOsagePaiutePakistaniPalestinianPanamanianParaguayanPennsylvania GermanPeruvianPimaPolishPortuguesePotawatomiPuebloPuerto RicanPuget Sound SalishRomanianRussianSalvadoranSamoanScandinavianScotch-IrishScottishSeminoleSenegaleseSerbianShoshoneSierra LeoneanSiouxSlavicSlovakSloveneSomaliSouth AfricanSouth AmericanSouth American IndianSoviet UnionSpaniardSpanishSpanish AmericanSpanish American IndianSri LankanSubsaharan AfricanSwedishSwissSyrianThaiTlingit-HaidaTonganTrinidadian and TobagonianTsimshianTurkishUgandanUkrainianUruguayanUteVenezuelanVietnameseWelshWest IndianYakamaYaquiYugoslavianYup'ik
Immigrant Origin (Total)
AfghanistanAfricaArgentinaArmeniaAsiaAustraliaAustriaBahamasBangladeshBarbadosBelarusBelgiumBelizeBosnia and HerzegovinaBrazilBulgariaBurma / MyanmarCambodiaCameroonCanadaCaribbeanCentral AmericaChileChinaColombiaCongoCosta RicaCroatiaCubaCzechoslovakiaDenmarkDominican RepublicEastern AfricaEastern AsiaEastern EuropeEcuadorEgyptEl SalvadorEnglandEritreaEthiopiaEuropeFijiFranceGermanyGhanaGreeceGuatemalaHaitiHondurasHong KongHungaryIndiaIndonesiaIranIraqIrelandIsraelItalyJamaicaJapanJordanKazakhstanKenyaKoreaKuwaitLaosLatin AmericaLatviaLebanonLiberiaLithuaniaMalaysiaMexicoMicronesiaMiddle AfricaMoldovaMoroccoNepalNetherlandsNicaraguaNigeriaNorth MacedoniaNorthern AfricaNorthern EuropeNorwayOceaniaPakistanPanamaPeruPhilippinesPolandPortugalRomaniaRussiaSaudi ArabiaScotlandSerbiaSingaporeSomaliaSouth AfricaSouth AmericaSouth Central AsiaSouth Eastern AsiaSouthern EuropeSpainSri LankaSudanSwedenSwitzerlandSyriaTaiwanThailandTrinidad and TobagoTurkeyUgandaUkraineUruguayUzbekistanVenezuelaVietnamWestern AfricaWestern AsiaWestern EuropeYemen
Immigrant Origin (Percentage)
AfghanistanAfricaArgentinaArmeniaAsiaAustraliaAustriaBahamasBangladeshBarbadosBelarusBelgiumBelizeBosnia and HerzegovinaBrazilBulgariaBurma / MyanmarCambodiaCameroonCanadaCaribbeanCentral AmericaChileChinaColombiaCongoCosta RicaCroatiaCubaCzechoslovakiaDenmarkDominican RepublicEastern AfricaEastern AsiaEastern EuropeEcuadorEgyptEl SalvadorEnglandEritreaEthiopiaEuropeFijiFranceGermanyGhanaGreeceGuatemalaHaitiHondurasHong KongHungaryIndiaIndonesiaIranIraqIrelandIsraelItalyJamaicaJapanJordanKazakhstanKenyaKoreaKuwaitLaosLatin AmericaLatviaLebanonLiberiaLithuaniaMalaysiaMexicoMicronesiaMiddle AfricaMoldovaMoroccoNepalNetherlandsNicaraguaNigeriaNorth MacedoniaNorthern AfricaNorthern EuropeNorwayOceaniaPakistanPanamaPeruPhilippinesPolandPortugalRomaniaRussiaSaudi ArabiaScotlandSerbiaSingaporeSomaliaSouth AfricaSouth AmericaSouth Central AsiaSouth Eastern AsiaSouthern EuropeSpainSri LankaSudanSwedenSwitzerlandSyriaTaiwanThailandTrinidad and TobagoTurkeyUgandaUkraineUruguayUzbekistanVenezuelaVietnamWestern AfricaWestern AsiaWestern EuropeYemen
Income
Income (Families)
Income (Households)
Poverty
Poverty (Families)
Unemployment
Employment Occupations
Employment Industries
Employer Class
Commute Time
Commute Means
School Enrollment
Education by Degree Field
Occupancy
Finances
Physical Characteristics
Portland
Compare Zip Codes
Comparison Subject

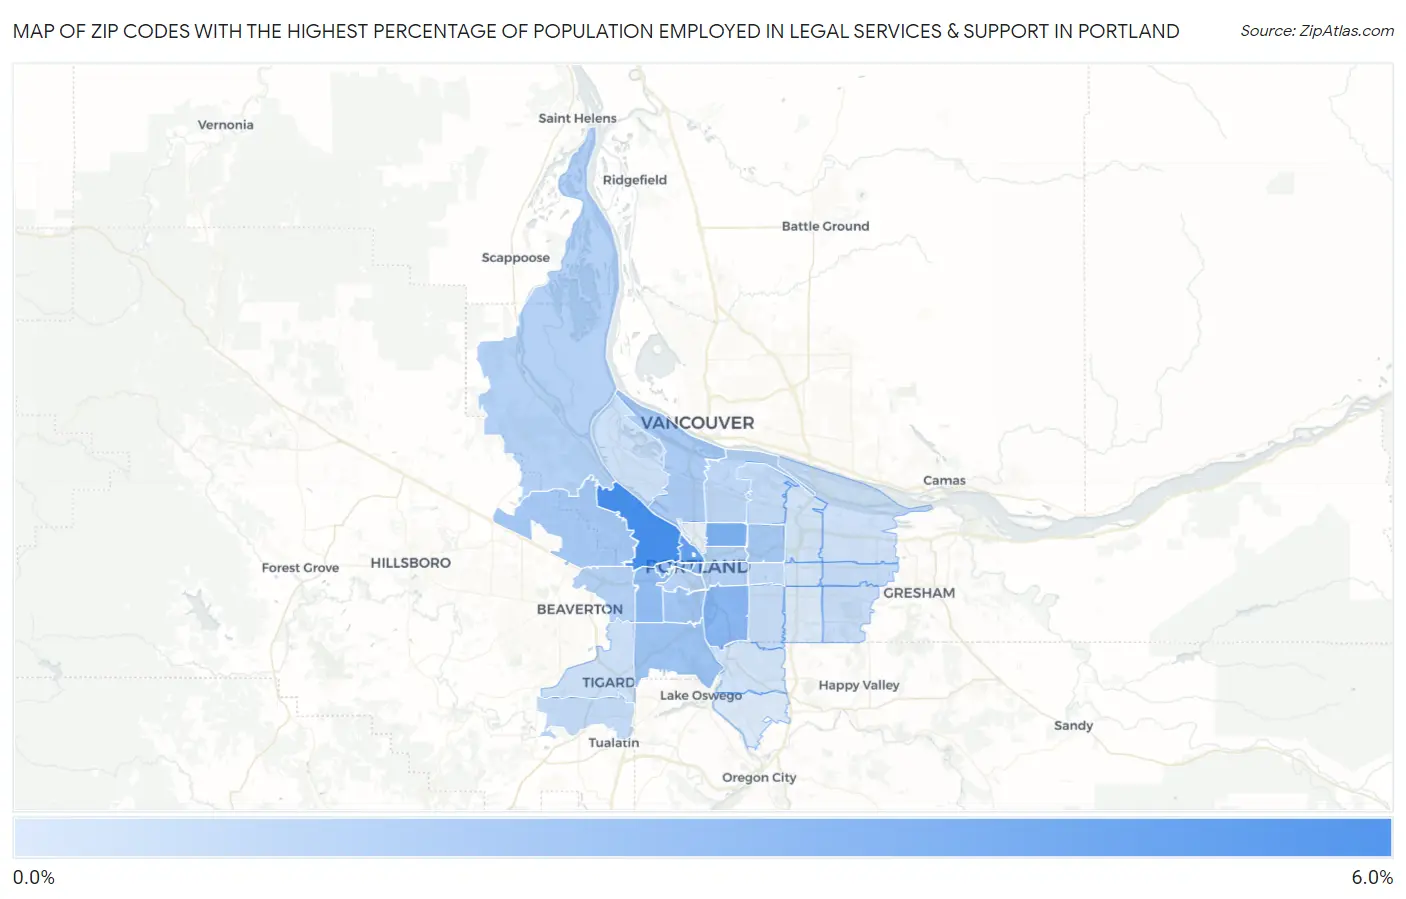
Map of Zip Codes with the Highest Percentage of Population Employed in Legal Services & Support in Portland

0.0%
6.0%
Zip Codes with the Highest Percentage of Population Employed in Legal Services & Support in Portland Map

Zip Codes with the Highest Percentage of Population Employed in Legal Services & Support in Portland, OR

Zip Code % Employed vs State vs National
1.972105.5%1.1%(+4.40)#101.2%(+4.32)#599
2.972094.4%1.1%(+3.35)#111.2%(+3.26)#918
3.972123.7%1.1%(+2.56)#131.2%(+2.48)#1,306
4.972023.3%1.1%(+2.19)#141.2%(+2.11)#1,587
5.972213.1%1.1%(+1.96)#151.2%(+1.88)#1,787
6.972053.0%1.1%(+1.91)#161.2%(+1.83)#1,828
7.972043.0%1.1%(+1.90)#171.2%(+1.81)#1,848
8.972192.6%1.1%(+1.53)#191.2%(+1.45)#2,302
9.972392.5%1.1%(+1.38)#221.2%(+1.29)#2,543
10.972292.4%1.1%(+1.31)#241.2%(+1.23)#2,655
11.972132.4%1.1%(+1.28)#251.2%(+1.19)#2,708
12.972172.2%1.1%(+1.13)#281.2%(+1.05)#2,975
13.972322.0%1.1%(+0.929)#361.2%(+0.845)#3,396
14.972312.0%1.1%(+0.855)#391.2%(+0.772)#3,587
15.972141.9%1.1%(+0.842)#401.2%(+0.759)#3,623
16.972251.9%1.1%(+0.804)#411.2%(+0.721)#3,724
17.972011.9%1.1%(+0.779)#421.2%(+0.695)#3,781
18.972111.7%1.1%(+0.561)#521.2%(+0.478)#4,458
19.972151.5%1.1%(+0.412)#571.2%(+0.329)#4,997
20.972241.5%1.1%(+0.378)#591.2%(+0.295)#5,131
21.972181.4%1.1%(+0.342)#631.2%(+0.259)#5,280
22.972061.4%1.1%(+0.257)#701.2%(+0.174)#5,663
23.972331.3%1.1%(+0.206)#741.2%(+0.123)#5,901
24.972361.3%1.1%(+0.154)#791.2%(+0.071)#6,175
25.972031.1%1.1%(-0.001)#881.2%(-0.084)#7,170
26.972231.1%1.1%(-0.008)#901.2%(-0.091)#7,226
27.972301.1%1.1%(-0.045)#941.2%(-0.128)#7,450
28.972200.98%1.1%(-0.123)#1001.2%(-0.206)#7,977
29.972220.95%1.1%(-0.146)#1041.2%(-0.229)#8,165
30.972160.91%1.1%(-0.186)#1081.2%(-0.269)#8,483
31.972660.72%1.1%(-0.384)#1271.2%(-0.467)#10,237
32.972670.68%1.1%(-0.417)#1301.2%(-0.501)#10,577

Common Questions

What are the Top 10 Zip Codes with the Highest Percentage of Population Employed in Legal Services & Support in Portland, OR?
Top 10 Zip Codes with the Highest Percentage of Population Employed in Legal Services & Support in Portland, OR are:
#1
5.5%
#2
4.4%
#3
3.7%
#4
3.3%
#5
3.1%
#6
3.0%
#7
3.0%
#8
2.6%
#9
2.5%
#10
2.4%
What zip code has the Highest Percentage of Population Employed in Legal Services & Support in Portland, OR?
97210 has the Highest Percentage of Population Employed in Legal Services & Support in Portland, OR with 5.5%.
What is the Percentage of Population Employed in Legal Services & Support in Portland, OR?
Percentage of Population Employed in Legal Services & Support in Portland is 2.1%.
What is the Percentage of Population Employed in Legal Services & Support in Oregon?
Percentage of Population Employed in Legal Services & Support in Oregon is 1.1%.
What is the Percentage of Population Employed in Legal Services & Support in the United States?
Percentage of Population Employed in Legal Services & Support in the United States is 1.2%.