Fairmount, NY Map & Demographics
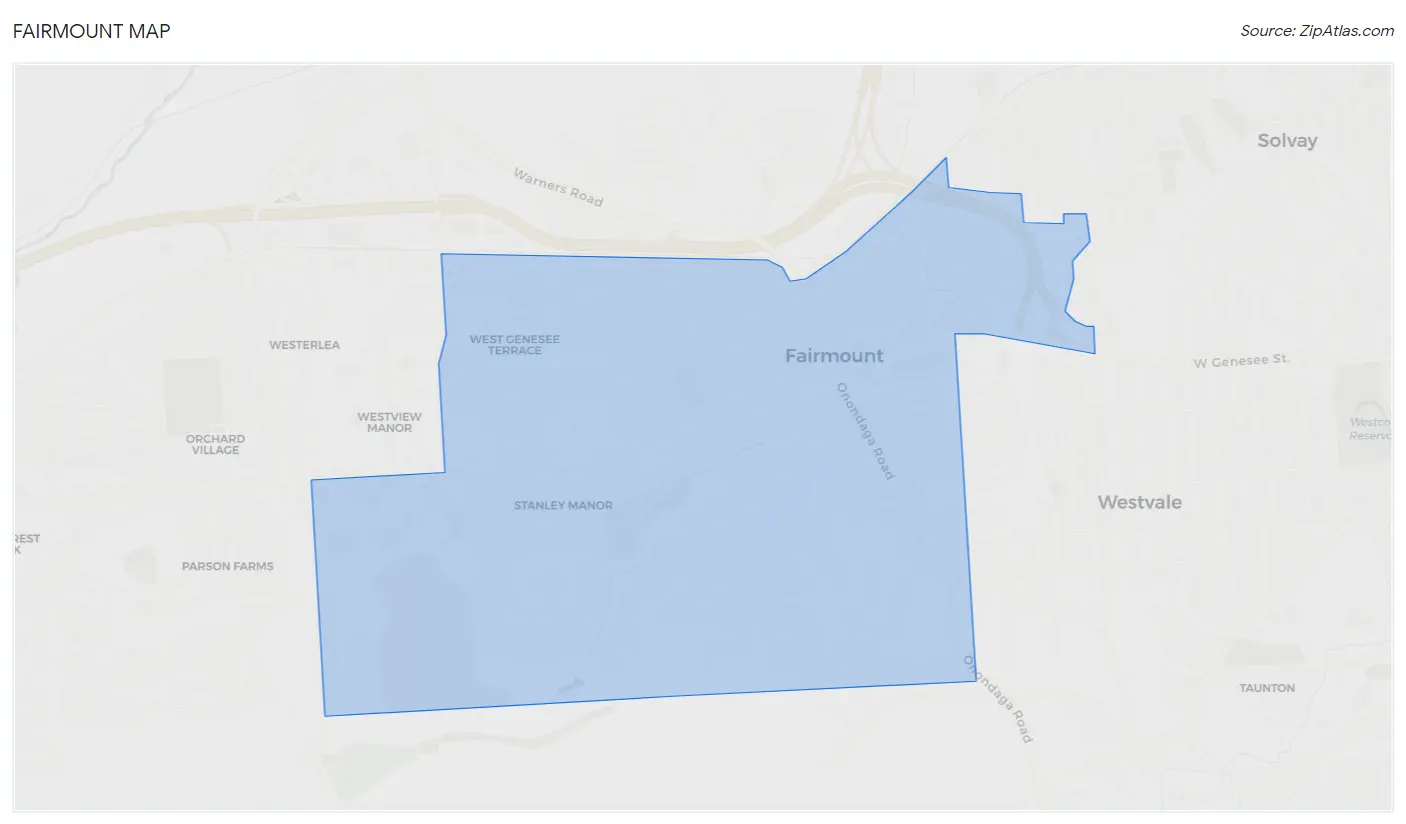
Fairmount Map
Fairmount Overview
$39,852
PER CAPITA INCOME
$93,911
AVG FAMILY INCOME
$82,303
AVG HOUSEHOLD INCOME
8.1%
WAGE / INCOME GAP [ % ]
91.9¢/ $1
WAGE / INCOME GAP [ $ ]
$12,249
FAMILY INCOME DEFICIT
0.37
INEQUALITY / GINI INDEX
9,978
TOTAL POPULATION
4,866
MALE POPULATION
5,112
FEMALE POPULATION
95.19
MALES / 100 FEMALES
105.06
FEMALES / 100 MALES
42.3
MEDIAN AGE
3.0
AVG FAMILY SIZE
2.5
AVG HOUSEHOLD SIZE
5,547
LABOR FORCE [ PEOPLE ]
67.4%
PERCENT IN LABOR FORCE
2.5%
UNEMPLOYMENT RATE
Income in Fairmount
Income Overview in Fairmount
Per Capita Income in Fairmount is $39,852, while median incomes of families and households are $93,911 and $82,303 respectively.
| Characteristic | Number | Measure |
| Per Capita Income | 9,978 | $39,852 |
| Median Family Income | 2,709 | $93,911 |
| Mean Family Income | 2,709 | $108,542 |
| Median Household Income | 4,045 | $82,303 |
| Mean Household Income | 4,045 | $96,064 |
| Income Deficit | 2,709 | $12,249 |
| Wage / Income Gap (%) | 9,978 | 8.10% |
| Wage / Income Gap ($) | 9,978 | 91.90¢ per $1 |
| Gini / Inequality Index | 9,978 | 0.37 |
Earnings by Sex in Fairmount
Average Earnings in Fairmount are $49,570, $52,926 for men and $48,639 for women, a difference of 8.1%.
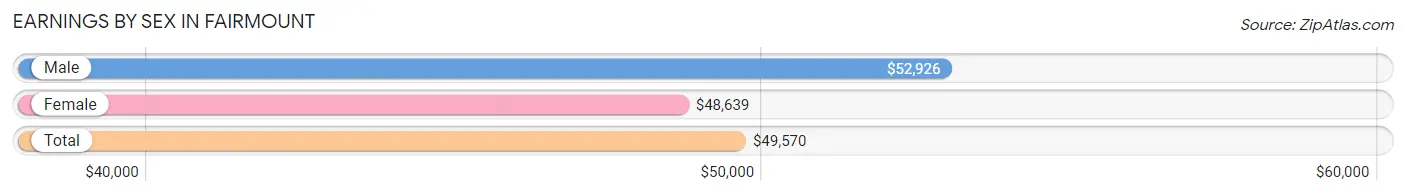
| Sex | Number | Average Earnings |
| Male | 2,821 (48.5%) | $52,926 |
| Female | 2,991 (51.5%) | $48,639 |
| Total | 5,812 (100.0%) | $49,570 |
Earnings by Sex by Income Bracket in Fairmount
The most common earnings brackets in Fairmount are $75,000 to $99,999 for men (446 | 15.8%) and $75,000 to $99,999 for women (434 | 14.5%).
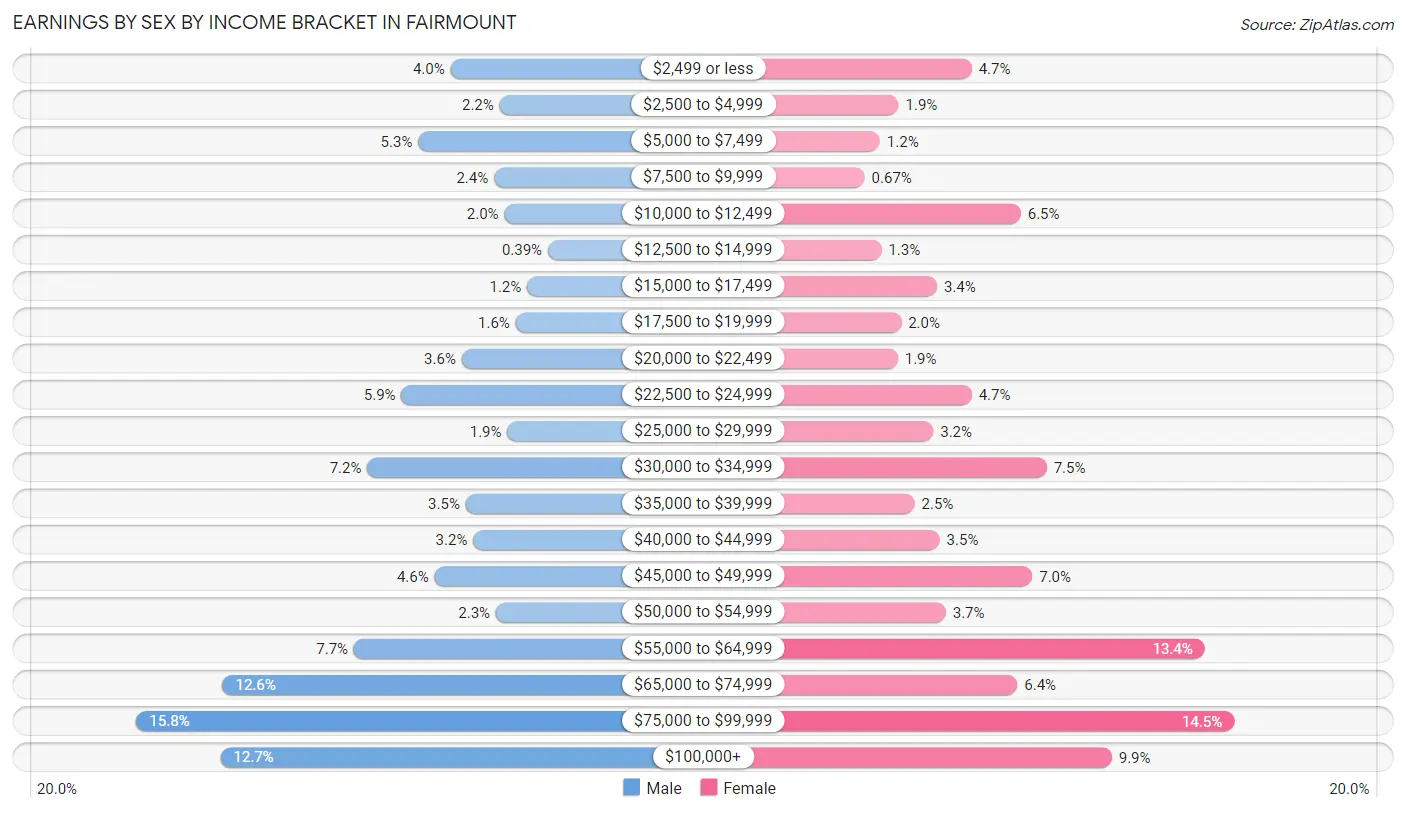
| Income | Male | Female |
| $2,499 or less | 114 (4.0%) | 140 (4.7%) |
| $2,500 to $4,999 | 62 (2.2%) | 58 (1.9%) |
| $5,000 to $7,499 | 148 (5.2%) | 37 (1.2%) |
| $7,500 to $9,999 | 68 (2.4%) | 20 (0.7%) |
| $10,000 to $12,499 | 57 (2.0%) | 195 (6.5%) |
| $12,500 to $14,999 | 11 (0.4%) | 39 (1.3%) |
| $15,000 to $17,499 | 33 (1.2%) | 101 (3.4%) |
| $17,500 to $19,999 | 45 (1.6%) | 61 (2.0%) |
| $20,000 to $22,499 | 102 (3.6%) | 57 (1.9%) |
| $22,500 to $24,999 | 166 (5.9%) | 140 (4.7%) |
| $25,000 to $29,999 | 54 (1.9%) | 97 (3.2%) |
| $30,000 to $34,999 | 202 (7.2%) | 224 (7.5%) |
| $35,000 to $39,999 | 98 (3.5%) | 76 (2.5%) |
| $40,000 to $44,999 | 90 (3.2%) | 104 (3.5%) |
| $45,000 to $49,999 | 131 (4.6%) | 208 (7.0%) |
| $50,000 to $54,999 | 66 (2.3%) | 111 (3.7%) |
| $55,000 to $64,999 | 216 (7.7%) | 401 (13.4%) |
| $65,000 to $74,999 | 355 (12.6%) | 191 (6.4%) |
| $75,000 to $99,999 | 446 (15.8%) | 434 (14.5%) |
| $100,000+ | 357 (12.7%) | 297 (9.9%) |
| Total | 2,821 (100.0%) | 2,991 (100.0%) |
Earnings by Sex by Educational Attainment in Fairmount
Average earnings in Fairmount are $58,077 for men and $56,291 for women, a difference of 3.1%. Men with an educational attainment of bachelor's degree enjoy the highest average annual earnings of $67,760, while those with high school diploma education earn the least with $45,766. Women with an educational attainment of graduate degree earn the most with the average annual earnings of $65,313, while those with high school diploma education have the smallest earnings of $32,159.
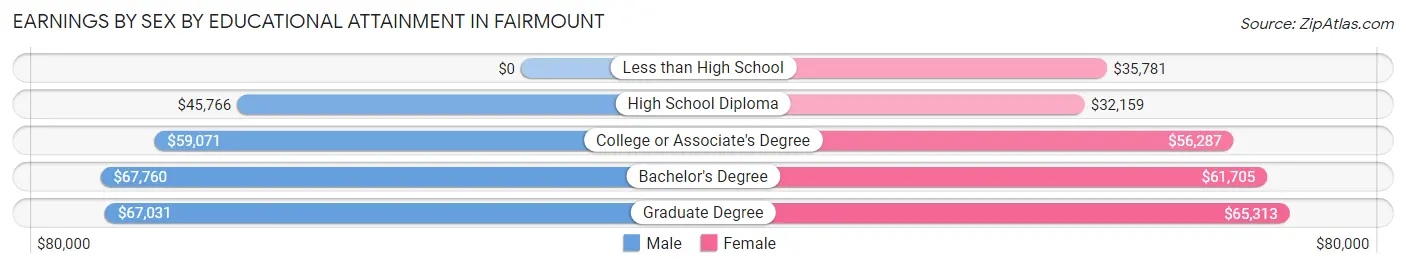
| Educational Attainment | Male Income | Female Income |
| Less than High School | - | - |
| High School Diploma | $45,766 | $32,159 |
| College or Associate's Degree | $59,071 | $56,287 |
| Bachelor's Degree | $67,760 | $61,705 |
| Graduate Degree | $67,031 | $65,313 |
| Total | $58,077 | $56,291 |
Family Income in Fairmount
Family Income Brackets in Fairmount
According to the Fairmount family income data, there are 664 families falling into the $100,000 to $149,999 income range, which is the most common income bracket and makes up 24.5% of all families. Conversely, the $10,000 to $14,999 income bracket is the least frequent group with only 11 families (0.4%) belonging to this category.
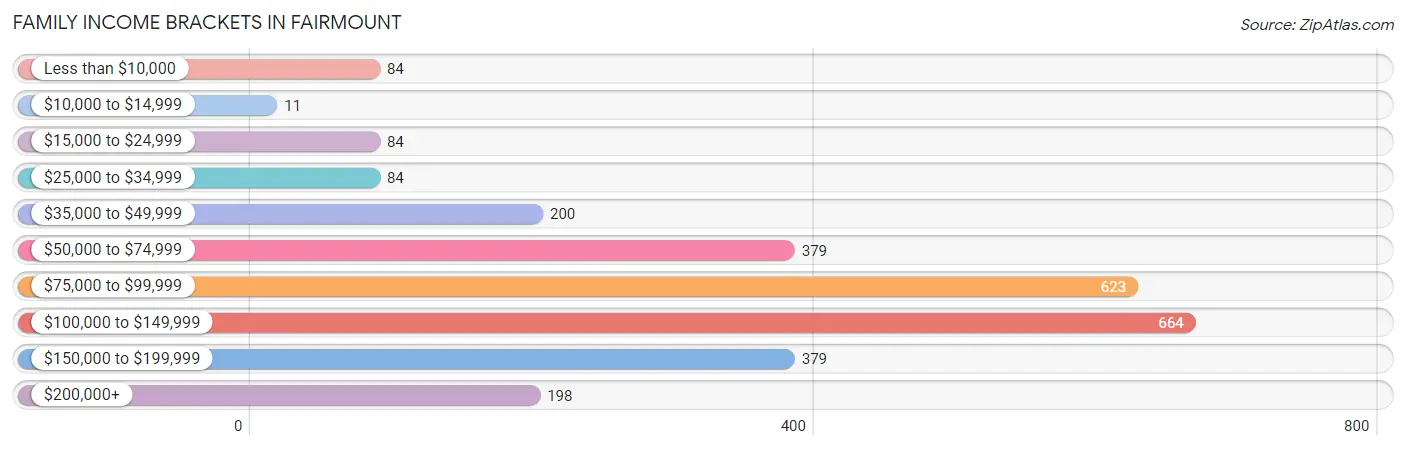
| Income Bracket | # Families | % Families |
| Less than $10,000 | 84 | 3.1% |
| $10,000 to $14,999 | 11 | 0.4% |
| $15,000 to $24,999 | 84 | 3.1% |
| $25,000 to $34,999 | 84 | 3.1% |
| $35,000 to $49,999 | 200 | 7.4% |
| $50,000 to $74,999 | 379 | 14.0% |
| $75,000 to $99,999 | 623 | 23.0% |
| $100,000 to $149,999 | 664 | 24.5% |
| $150,000 to $199,999 | 379 | 14.0% |
| $200,000+ | 198 | 7.3% |
Family Income by Famaliy Size in Fairmount
4-person families (480 | 17.7%) account for the highest median family income in Fairmount with $154,500 per family, while 3-person families (559 | 20.6%) have the highest median income of $42,338 per family member.
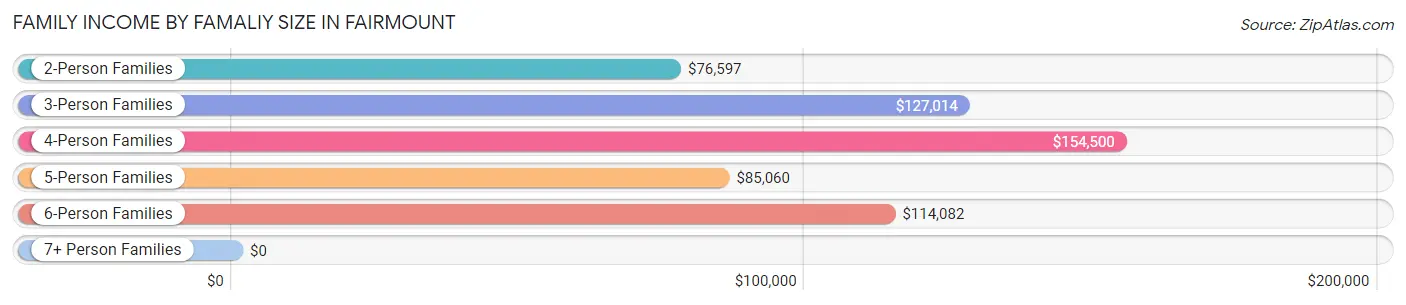
| Income Bracket | # Families | Median Income |
| 2-Person Families | 1,390 (51.3%) | $76,597 |
| 3-Person Families | 559 (20.6%) | $127,014 |
| 4-Person Families | 480 (17.7%) | $154,500 |
| 5-Person Families | 173 (6.4%) | $85,060 |
| 6-Person Families | 107 (4.0%) | $114,082 |
| 7+ Person Families | 0 (0.0%) | $0 |
| Total | 2,709 (100.0%) | $93,911 |
Family Income by Number of Earners in Fairmount
The median family income in Fairmount is $93,911, with families comprising 3+ earners (391) having the highest median family income of $136,477, while families with no earners (372) have the lowest median family income of $40,972, accounting for 14.4% and 13.7% of families, respectively.
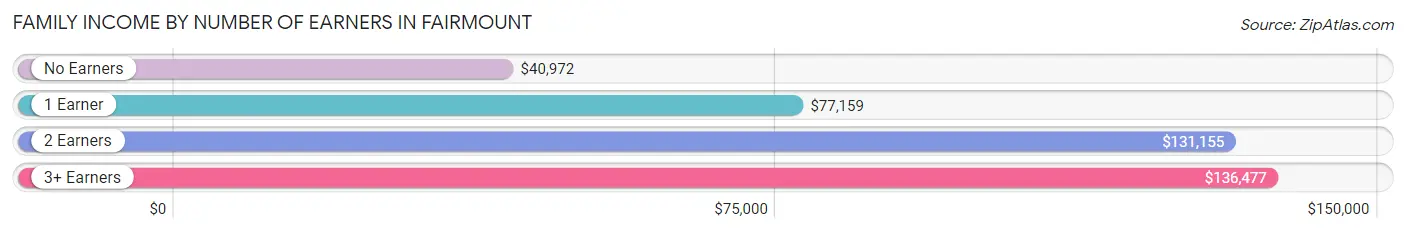
| Number of Earners | # Families | Median Income |
| No Earners | 372 (13.7%) | $40,972 |
| 1 Earner | 749 (27.7%) | $77,159 |
| 2 Earners | 1,197 (44.2%) | $131,155 |
| 3+ Earners | 391 (14.4%) | $136,477 |
| Total | 2,709 (100.0%) | $93,911 |
Household Income in Fairmount
Household Income Brackets in Fairmount
With 773 households falling in the category, the $100,000 to $149,999 income range is the most frequent in Fairmount, accounting for 19.1% of all households. In contrast, only 77 households (1.9%) fall into the $10,000 to $14,999 income bracket, making it the least populous group.
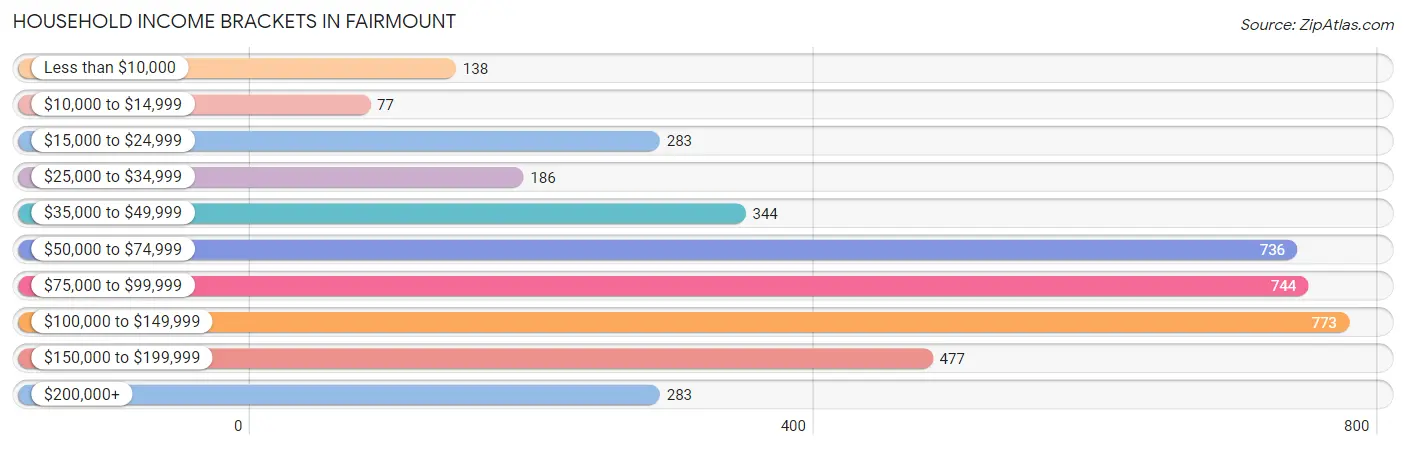
| Income Bracket | # Households | % Households |
| Less than $10,000 | 138 | 3.4% |
| $10,000 to $14,999 | 77 | 1.9% |
| $15,000 to $24,999 | 283 | 7.0% |
| $25,000 to $34,999 | 186 | 4.6% |
| $35,000 to $49,999 | 344 | 8.5% |
| $50,000 to $74,999 | 736 | 18.2% |
| $75,000 to $99,999 | 744 | 18.4% |
| $100,000 to $149,999 | 773 | 19.1% |
| $150,000 to $199,999 | 477 | 11.8% |
| $200,000+ | 283 | 7.0% |
Household Income by Householder Age in Fairmount
The median household income in Fairmount is $82,303, with the highest median household income of $117,250 found in the 45 to 64 years age bracket for the primary householder. A total of 1,573 households (38.9%) fall into this category. Meanwhile, the 15 to 24 years age bracket for the primary householder has the lowest median household income of $0, with 37 households (0.9%) in this group.
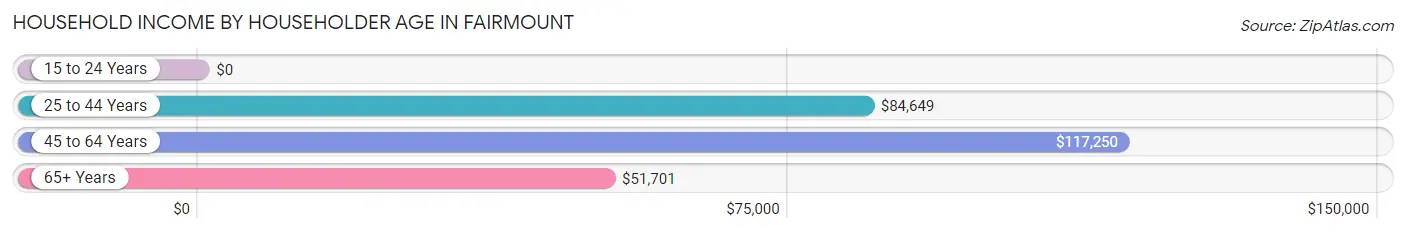
| Income Bracket | # Households | Median Income |
| 15 to 24 Years | 37 (0.9%) | $0 |
| 25 to 44 Years | 1,202 (29.7%) | $84,649 |
| 45 to 64 Years | 1,573 (38.9%) | $117,250 |
| 65+ Years | 1,233 (30.5%) | $51,701 |
| Total | 4,045 (100.0%) | $82,303 |
Poverty in Fairmount
Income Below Poverty by Sex and Age in Fairmount
With 5.3% poverty level for males and 6.5% for females among the residents of Fairmount, 15 year old males and 16 and 17 year old females are the most vulnerable to poverty, with 24 males (100.0%) and 25 females (27.8%) in their respective age groups living below the poverty level.
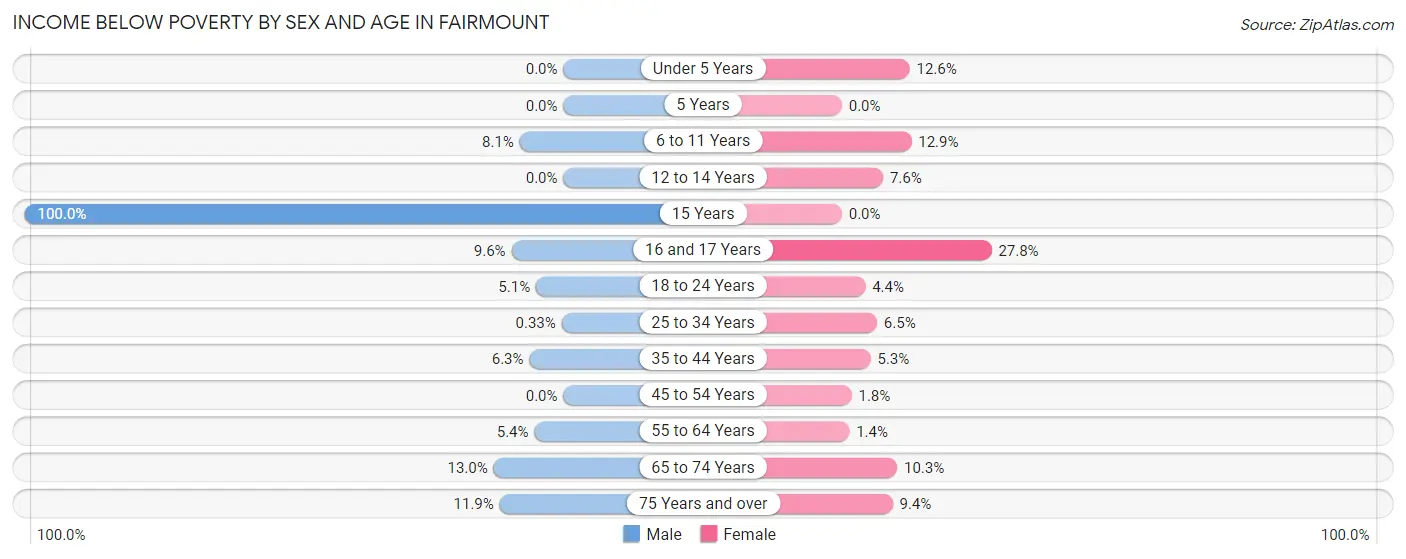
| Age Bracket | Male | Female |
| Under 5 Years | 0 (0.0%) | 42 (12.6%) |
| 5 Years | 0 (0.0%) | 0 (0.0%) |
| 6 to 11 Years | 24 (8.1%) | 36 (12.9%) |
| 12 to 14 Years | 0 (0.0%) | 12 (7.6%) |
| 15 Years | 24 (100.0%) | 0 (0.0%) |
| 16 and 17 Years | 13 (9.6%) | 25 (27.8%) |
| 18 to 24 Years | 22 (5.1%) | 19 (4.3%) |
| 25 to 34 Years | 2 (0.3%) | 46 (6.5%) |
| 35 to 44 Years | 27 (6.3%) | 35 (5.3%) |
| 45 to 54 Years | 0 (0.0%) | 12 (1.8%) |
| 55 to 64 Years | 45 (5.4%) | 11 (1.4%) |
| 65 to 74 Years | 43 (13.0%) | 44 (10.3%) |
| 75 Years and over | 59 (11.8%) | 52 (9.4%) |
| Total | 259 (5.3%) | 334 (6.5%) |
Income Above Poverty by Sex and Age in Fairmount
According to the poverty statistics in Fairmount, males aged under 5 years and females aged 5 years are the age groups that are most secure financially, with 100.0% of males and 100.0% of females in these age groups living above the poverty line.
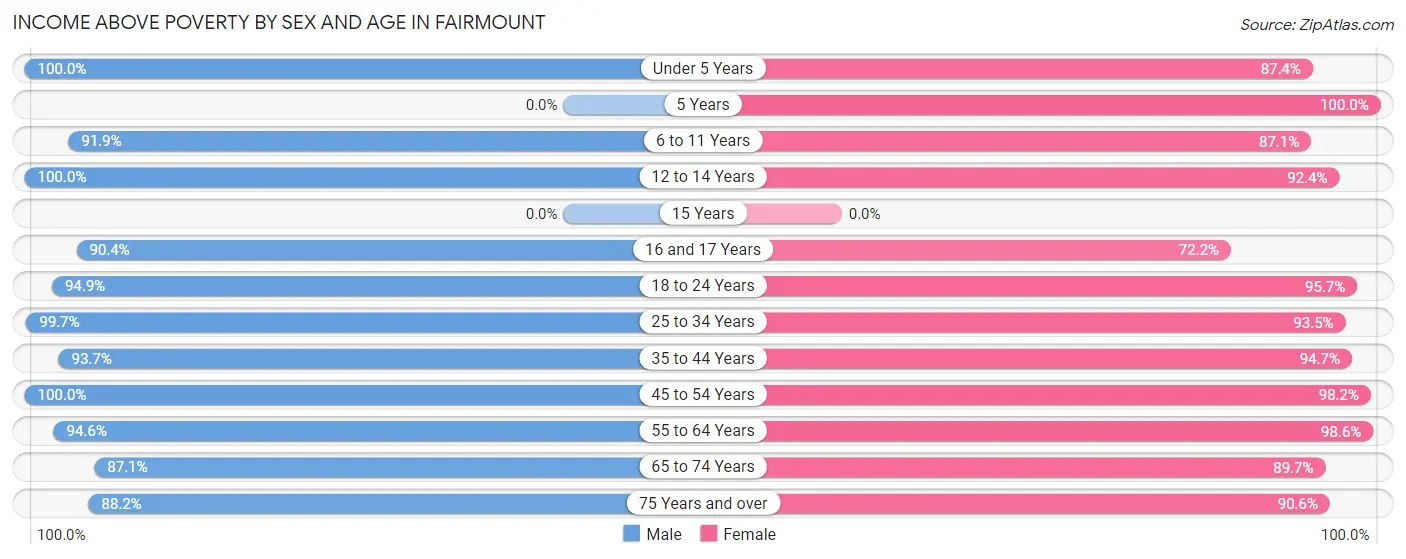
| Age Bracket | Male | Female |
| Under 5 Years | 386 (100.0%) | 292 (87.4%) |
| 5 Years | 0 (0.0%) | 13 (100.0%) |
| 6 to 11 Years | 272 (91.9%) | 243 (87.1%) |
| 12 to 14 Years | 259 (100.0%) | 145 (92.4%) |
| 15 Years | 0 (0.0%) | 0 (0.0%) |
| 16 and 17 Years | 122 (90.4%) | 65 (72.2%) |
| 18 to 24 Years | 411 (94.9%) | 418 (95.7%) |
| 25 to 34 Years | 606 (99.7%) | 660 (93.5%) |
| 35 to 44 Years | 401 (93.7%) | 621 (94.7%) |
| 45 to 54 Years | 630 (100.0%) | 652 (98.2%) |
| 55 to 64 Years | 792 (94.6%) | 784 (98.6%) |
| 65 to 74 Years | 289 (87.1%) | 385 (89.7%) |
| 75 Years and over | 439 (88.1%) | 500 (90.6%) |
| Total | 4,607 (94.7%) | 4,778 (93.5%) |
Income Below Poverty Among Married-Couple Families in Fairmount
The poverty statistics for married-couple families in Fairmount show that 3.9% or 75 of the total 1,941 families live below the poverty line. Families with 3 or 4 children have the highest poverty rate of 7.6%, comprising of 13 families. On the other hand, families with 1 or 2 children have the lowest poverty rate of 2.0%, which includes 11 families.
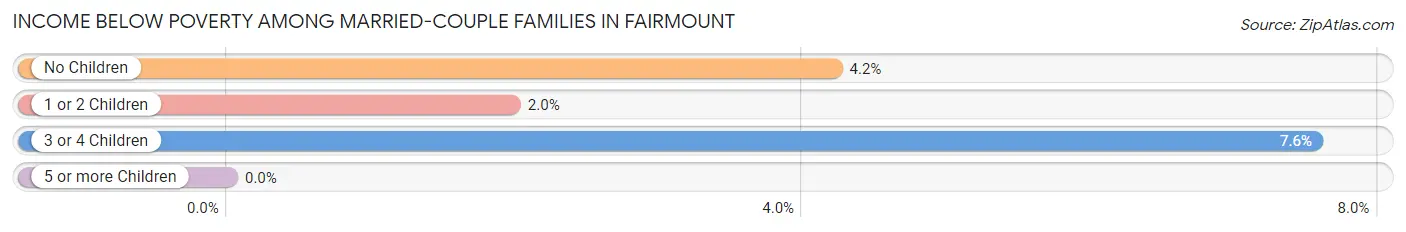
| Children | Above Poverty | Below Poverty |
| No Children | 1,159 (95.8%) | 51 (4.2%) |
| 1 or 2 Children | 548 (98.0%) | 11 (2.0%) |
| 3 or 4 Children | 159 (92.4%) | 13 (7.6%) |
| 5 or more Children | 0 (0.0%) | 0 (0.0%) |
| Total | 1,866 (96.1%) | 75 (3.9%) |
Income Below Poverty Among Single-Parent Households in Fairmount
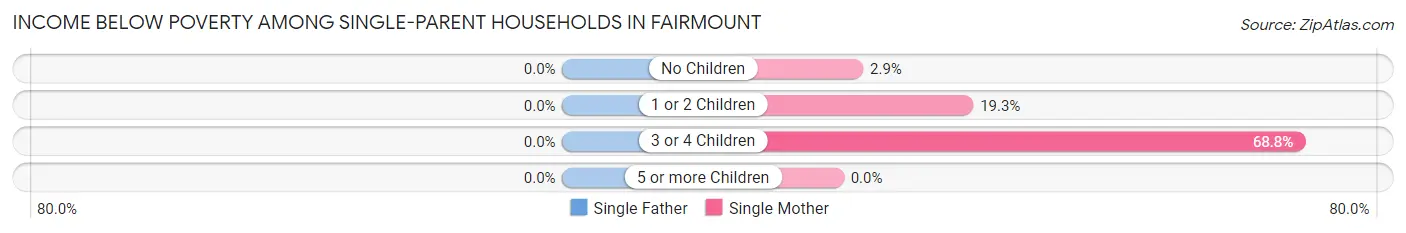
| Children | Single Father | Single Mother |
| No Children | 0 (0.0%) | 11 (2.9%) |
| 1 or 2 Children | 0 (0.0%) | 55 (19.3%) |
| 3 or 4 Children | 0 (0.0%) | 11 (68.8%) |
| 5 or more Children | 0 (0.0%) | 0 (0.0%) |
| Total | 0 (0.0%) | 77 (11.3%) |
Income Below Poverty Among Married-Couple vs Single-Parent Households in Fairmount
The poverty data for Fairmount shows that 75 of the married-couple family households (3.9%) and 77 of the single-parent households (10.0%) are living below the poverty level. Within the married-couple family households, those with 3 or 4 children have the highest poverty rate, with 13 households (7.6%) falling below the poverty line. Among the single-parent households, those with 3 or 4 children have the highest poverty rate, with 11 household (39.3%) living below poverty.
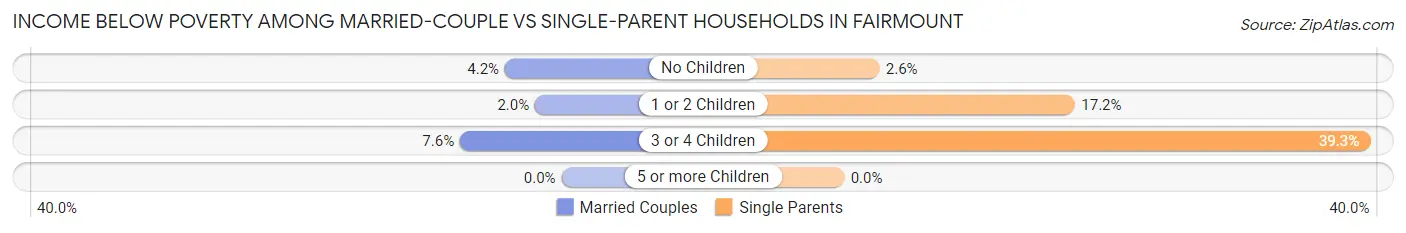
| Children | Married-Couple Families | Single-Parent Households |
| No Children | 51 (4.2%) | 11 (2.6%) |
| 1 or 2 Children | 11 (2.0%) | 55 (17.2%) |
| 3 or 4 Children | 13 (7.6%) | 11 (39.3%) |
| 5 or more Children | 0 (0.0%) | 0 (0.0%) |
| Total | 75 (3.9%) | 77 (10.0%) |
Race in Fairmount
The most populous races in Fairmount are White / Caucasian (9,087 | 91.1%), Two or more Races (426 | 4.3%), and Hispanic or Latino (336 | 3.4%).
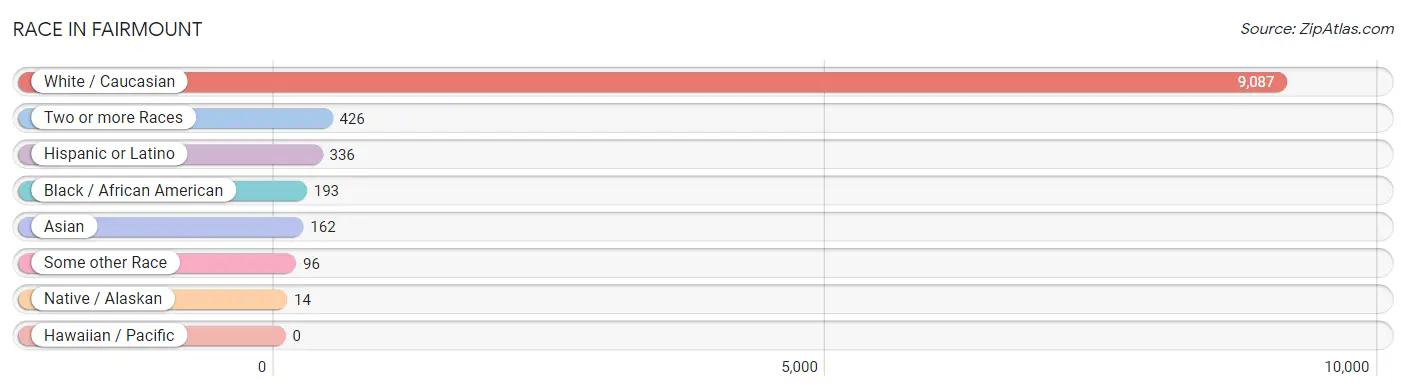
| Race | # Population | % Population |
| Asian | 162 | 1.6% |
| Black / African American | 193 | 1.9% |
| Hawaiian / Pacific | 0 | 0.0% |
| Hispanic or Latino | 336 | 3.4% |
| Native / Alaskan | 14 | 0.1% |
| White / Caucasian | 9,087 | 91.1% |
| Two or more Races | 426 | 4.3% |
| Some other Race | 96 | 1.0% |
| Total | 9,978 | 100.0% |
Ancestry in Fairmount
The most populous ancestries reported in Fairmount are Irish (2,705 | 27.1%), Italian (2,002 | 20.1%), German (1,600 | 16.0%), English (1,258 | 12.6%), and Polish (1,204 | 12.1%), together accounting for 87.9% of all Fairmount residents.
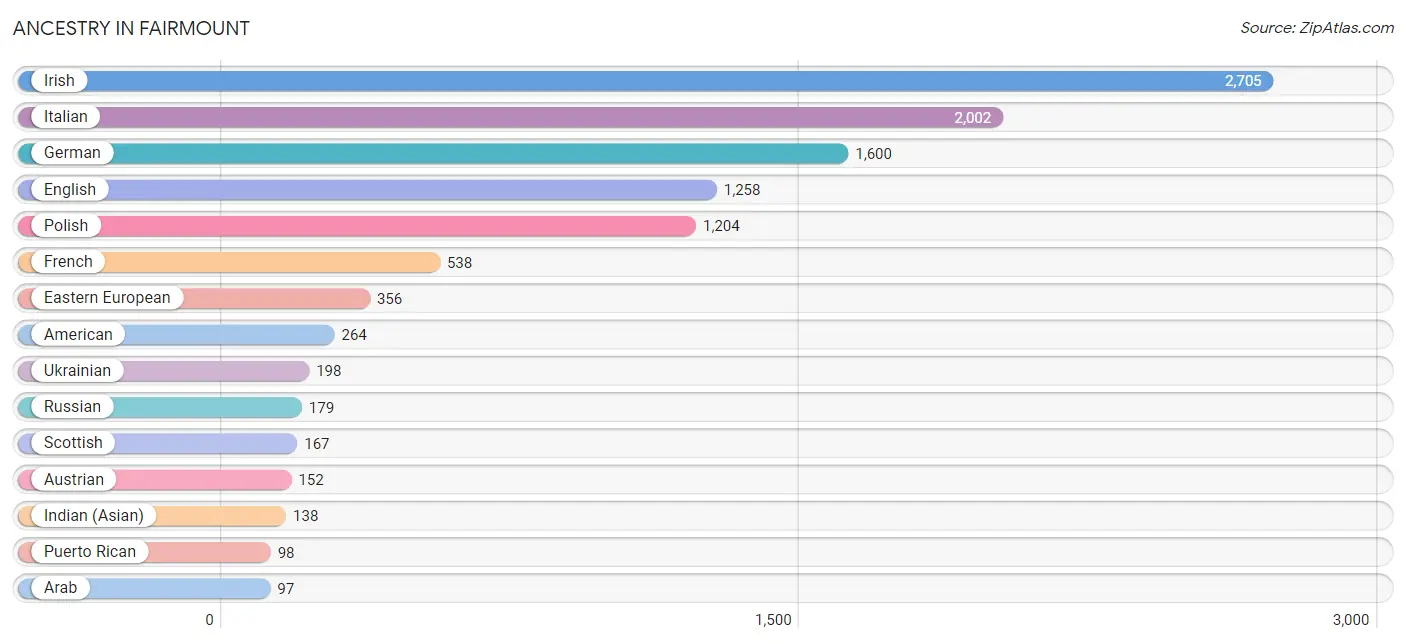
| Ancestry | # Population | % Population |
| American | 264 | 2.6% |
| Apache | 13 | 0.1% |
| Arab | 97 | 1.0% |
| Argentinean | 27 | 0.3% |
| Austrian | 152 | 1.5% |
| Belgian | 21 | 0.2% |
| British | 78 | 0.8% |
| Burmese | 53 | 0.5% |
| Canadian | 35 | 0.4% |
| Central American | 18 | 0.2% |
| Cherokee | 9 | 0.1% |
| Colombian | 16 | 0.2% |
| Costa Rican | 18 | 0.2% |
| Czech | 13 | 0.1% |
| Czechoslovakian | 52 | 0.5% |
| Danish | 58 | 0.6% |
| Dominican | 26 | 0.3% |
| Dutch | 58 | 0.6% |
| Eastern European | 356 | 3.6% |
| Ecuadorian | 30 | 0.3% |
| English | 1,258 | 12.6% |
| European | 81 | 0.8% |
| French | 538 | 5.4% |
| French American Indian | 1 | 0.0% |
| French Canadian | 59 | 0.6% |
| German | 1,600 | 16.0% |
| Greek | 89 | 0.9% |
| Hungarian | 50 | 0.5% |
| Indian (Asian) | 138 | 1.4% |
| Irish | 2,705 | 27.1% |
| Iroquois | 28 | 0.3% |
| Italian | 2,002 | 20.1% |
| Jamaican | 2 | 0.0% |
| Lebanese | 9 | 0.1% |
| Lithuanian | 6 | 0.1% |
| Mexican | 52 | 0.5% |
| Norwegian | 14 | 0.1% |
| Pennsylvania German | 10 | 0.1% |
| Polish | 1,204 | 12.1% |
| Portuguese | 13 | 0.1% |
| Puerto Rican | 98 | 1.0% |
| Russian | 179 | 1.8% |
| Scandinavian | 42 | 0.4% |
| Scotch-Irish | 18 | 0.2% |
| Scottish | 167 | 1.7% |
| Serbian | 53 | 0.5% |
| Sierra Leonean | 42 | 0.4% |
| Slovak | 41 | 0.4% |
| South American | 73 | 0.7% |
| Spanish | 16 | 0.2% |
| Subsaharan African | 56 | 0.6% |
| Swedish | 16 | 0.2% |
| Swiss | 15 | 0.2% |
| Syrian | 51 | 0.5% |
| Thai | 11 | 0.1% |
| Ukrainian | 198 | 2.0% |
| Welsh | 83 | 0.8% | View All 57 Rows |
Immigrants in Fairmount
The most numerous immigrant groups reported in Fairmount came from Europe (248 | 2.5%), Eastern Europe (213 | 2.1%), Asia (208 | 2.1%), Poland (139 | 1.4%), and Latin America (97 | 1.0%), together accounting for 9.1% of all Fairmount residents.
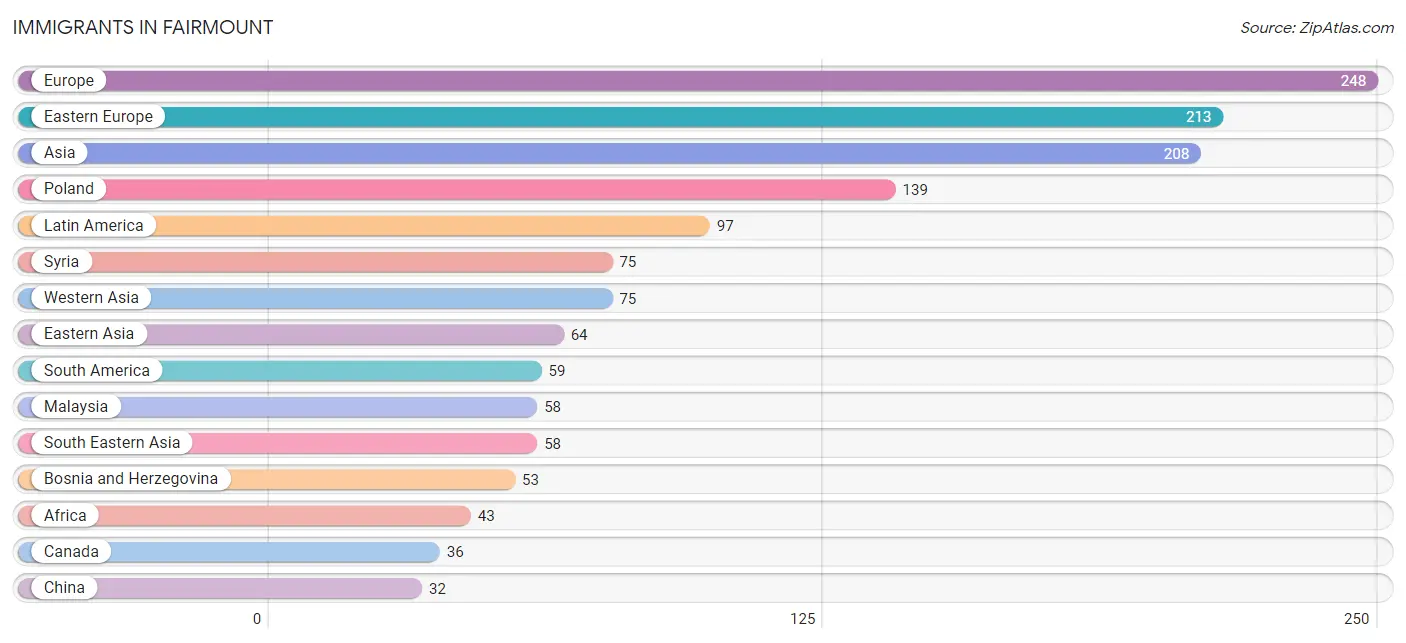
| Immigration Origin | # Population | % Population |
| Africa | 43 | 0.4% |
| Argentina | 27 | 0.3% |
| Asia | 208 | 2.1% |
| Bosnia and Herzegovina | 53 | 0.5% |
| Brazil | 15 | 0.2% |
| Canada | 36 | 0.4% |
| Caribbean | 15 | 0.2% |
| Central America | 23 | 0.2% |
| China | 32 | 0.3% |
| Costa Rica | 18 | 0.2% |
| Dominican Republic | 13 | 0.1% |
| Eastern Africa | 14 | 0.1% |
| Eastern Asia | 64 | 0.6% |
| Eastern Europe | 213 | 2.1% |
| Ecuador | 17 | 0.2% |
| Europe | 248 | 2.5% |
| Germany | 22 | 0.2% |
| India | 11 | 0.1% |
| Italy | 13 | 0.1% |
| Jamaica | 2 | 0.0% |
| Korea | 32 | 0.3% |
| Latin America | 97 | 1.0% |
| Malaysia | 58 | 0.6% |
| Mexico | 5 | 0.1% |
| Poland | 139 | 1.4% |
| Sierra Leone | 29 | 0.3% |
| South America | 59 | 0.6% |
| South Central Asia | 11 | 0.1% |
| South Eastern Asia | 58 | 0.6% |
| Southern Europe | 13 | 0.1% |
| Syria | 75 | 0.7% |
| Ukraine | 21 | 0.2% |
| Western Africa | 29 | 0.3% |
| Western Asia | 75 | 0.7% |
| Western Europe | 22 | 0.2% | View All 35 Rows |
Sex and Age in Fairmount
Sex and Age in Fairmount
The most populous age groups in Fairmount are 60 to 64 Years (522 | 10.7%) for men and 35 to 39 Years (445 | 8.7%) for women.
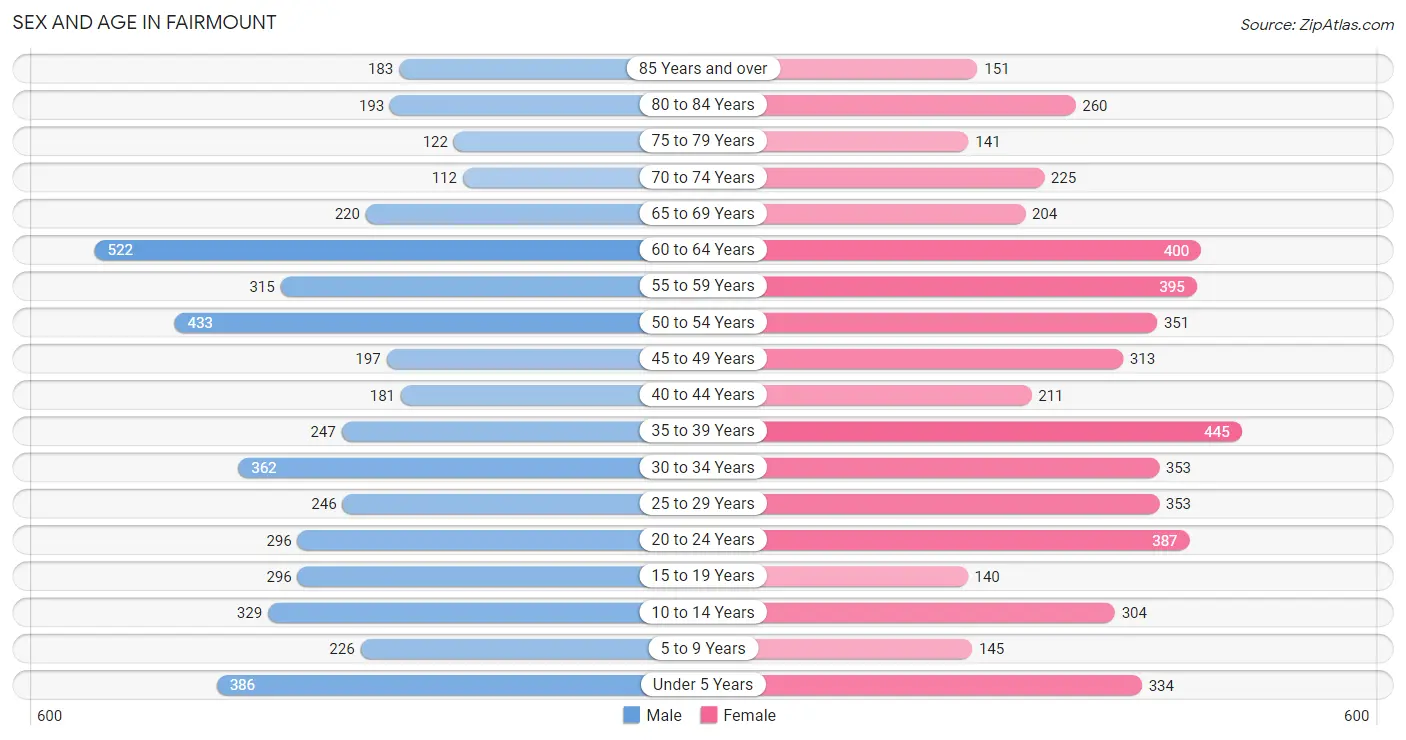
| Age Bracket | Male | Female |
| Under 5 Years | 386 (7.9%) | 334 (6.5%) |
| 5 to 9 Years | 226 (4.6%) | 145 (2.8%) |
| 10 to 14 Years | 329 (6.8%) | 304 (5.9%) |
| 15 to 19 Years | 296 (6.1%) | 140 (2.7%) |
| 20 to 24 Years | 296 (6.1%) | 387 (7.6%) |
| 25 to 29 Years | 246 (5.1%) | 353 (6.9%) |
| 30 to 34 Years | 362 (7.4%) | 353 (6.9%) |
| 35 to 39 Years | 247 (5.1%) | 445 (8.7%) |
| 40 to 44 Years | 181 (3.7%) | 211 (4.1%) |
| 45 to 49 Years | 197 (4.1%) | 313 (6.1%) |
| 50 to 54 Years | 433 (8.9%) | 351 (6.9%) |
| 55 to 59 Years | 315 (6.5%) | 395 (7.7%) |
| 60 to 64 Years | 522 (10.7%) | 400 (7.8%) |
| 65 to 69 Years | 220 (4.5%) | 204 (4.0%) |
| 70 to 74 Years | 112 (2.3%) | 225 (4.4%) |
| 75 to 79 Years | 122 (2.5%) | 141 (2.8%) |
| 80 to 84 Years | 193 (4.0%) | 260 (5.1%) |
| 85 Years and over | 183 (3.8%) | 151 (2.9%) |
| Total | 4,866 (100.0%) | 5,112 (100.0%) |
Families and Households in Fairmount
Median Family Size in Fairmount
The median family size in Fairmount is 3.04 persons per family, with married-couple families (1,941 | 71.7%) accounting for the largest median family size of 3.19 persons per family. On the other hand, single female/mother families (680 | 25.1%) represent the smallest median family size with 2.65 persons per family.
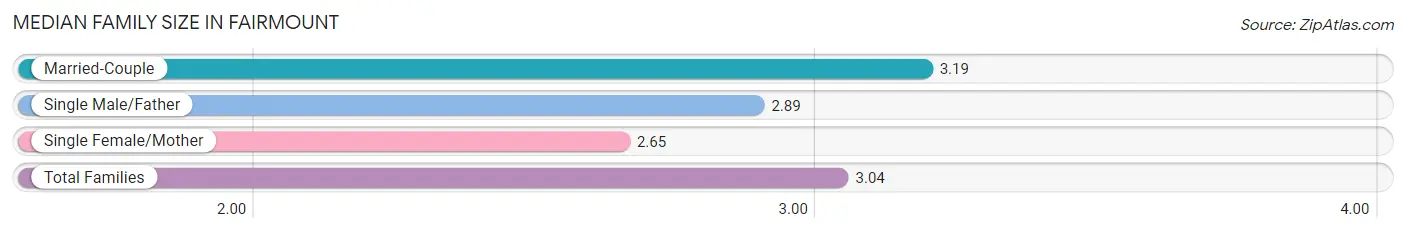
| Family Type | # Families | Family Size |
| Married-Couple | 1,941 (71.7%) | 3.19 |
| Single Male/Father | 88 (3.3%) | 2.89 |
| Single Female/Mother | 680 (25.1%) | 2.65 |
| Total Families | 2,709 (100.0%) | 3.04 |
Median Household Size in Fairmount
The median household size in Fairmount is 2.46 persons per household, with single male/father households (88 | 2.2%) accounting for the largest median household size of 3.31 persons per household. non-family households (1,336 | 33.0%) represent the smallest median household size with 1.15 persons per household.
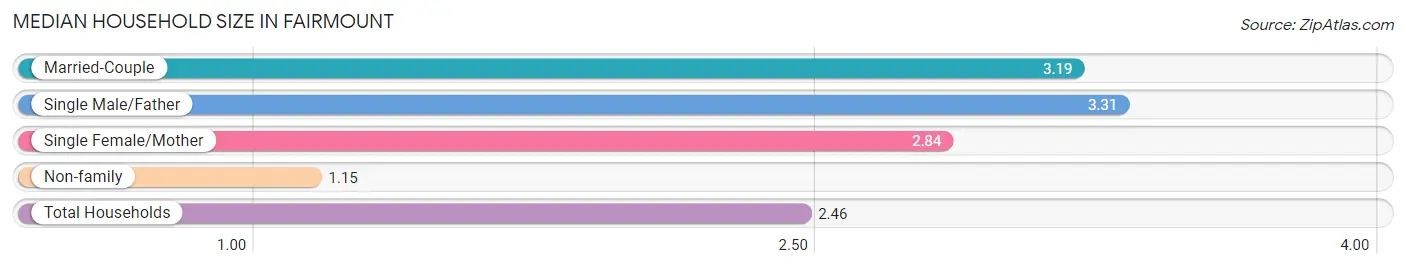
| Household Type | # Households | Household Size |
| Married-Couple | 1,941 (48.0%) | 3.19 |
| Single Male/Father | 88 (2.2%) | 3.31 |
| Single Female/Mother | 680 (16.8%) | 2.84 |
| Non-family | 1,336 (33.0%) | 1.15 |
| Total Households | 4,045 (100.0%) | 2.46 |
Household Size by Marriage Status in Fairmount
Out of a total of 4,045 households in Fairmount, 2,709 (67.0%) are family households, while 1,336 (33.0%) are nonfamily households. The most numerous type of family households are 2-person households, comprising 1,329, and the most common type of nonfamily households are 1-person households, comprising 1,137.
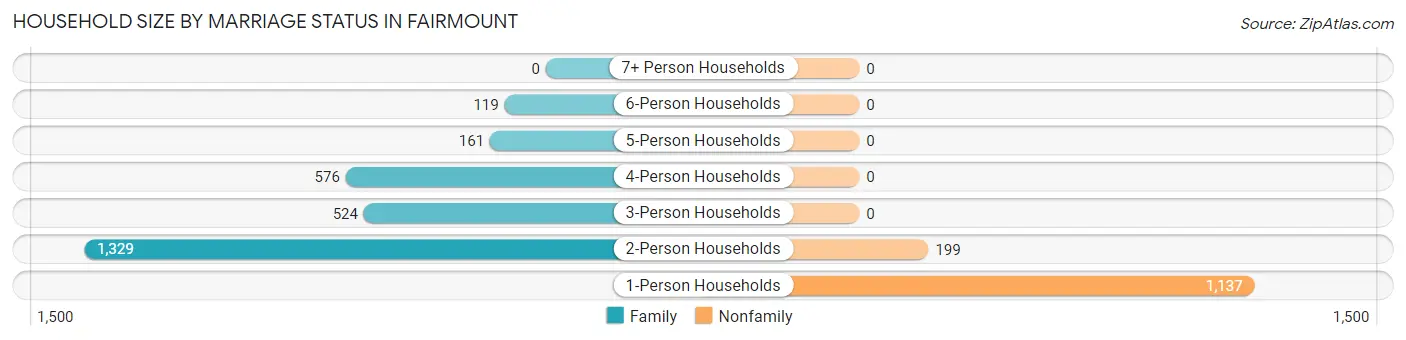
| Household Size | Family Households | Nonfamily Households |
| 1-Person Households | - | 1,137 (28.1%) |
| 2-Person Households | 1,329 (32.9%) | 199 (4.9%) |
| 3-Person Households | 524 (13.0%) | 0 (0.0%) |
| 4-Person Households | 576 (14.2%) | 0 (0.0%) |
| 5-Person Households | 161 (4.0%) | 0 (0.0%) |
| 6-Person Households | 119 (2.9%) | 0 (0.0%) |
| 7+ Person Households | 0 (0.0%) | 0 (0.0%) |
| Total | 2,709 (67.0%) | 1,336 (33.0%) |
Female Fertility in Fairmount
Fertility by Age in Fairmount
Average fertility rate in Fairmount is 78.0 births per 1,000 women. Women in the age bracket of 20 to 34 years have the highest fertility rate with 131.0 births per 1,000 women. Women in the age bracket of 20 to 34 years acount for 82.2% of all women with births.
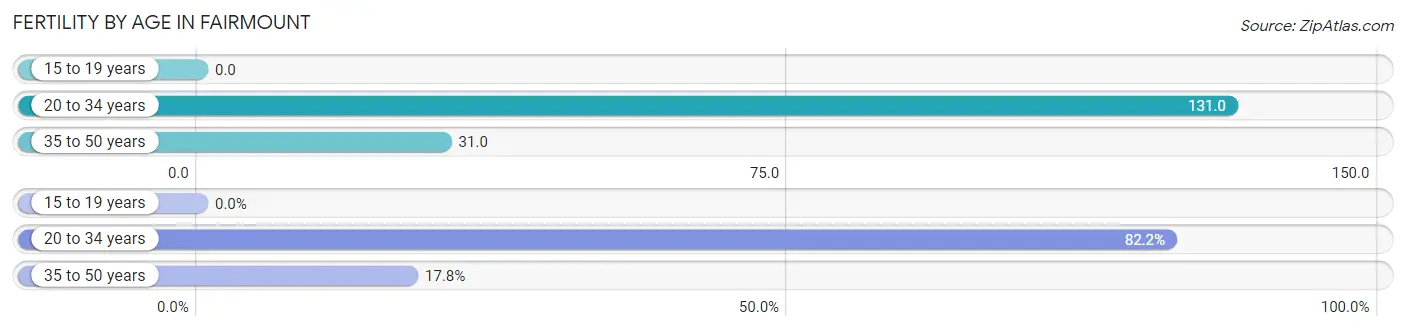
| Age Bracket | Women with Births | Births / 1,000 Women |
| 15 to 19 years | 0 (0.0%) | 0.0 |
| 20 to 34 years | 143 (82.2%) | 131.0 |
| 35 to 50 years | 31 (17.8%) | 31.0 |
| Total | 174 (100.0%) | 78.0 |
Fertility by Age by Marriage Status in Fairmount
79.9% of women with births (174) in Fairmount are married. The highest percentage of unmarried women with births falls into 35 to 50 years age bracket with 51.6% of them unmarried at the time of birth, while the lowest percentage of unmarried women with births belong to 20 to 34 years age bracket with 13.3% of them unmarried.
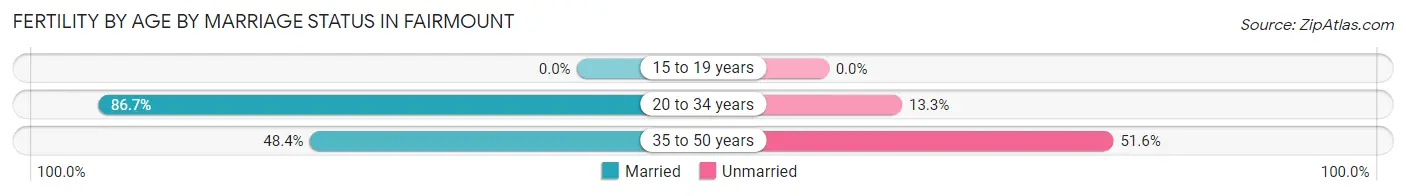
| Age Bracket | Married | Unmarried |
| 15 to 19 years | 0 (0.0%) | 0 (0.0%) |
| 20 to 34 years | 124 (86.7%) | 19 (13.3%) |
| 35 to 50 years | 15 (48.4%) | 16 (51.6%) |
| Total | 139 (79.9%) | 35 (20.1%) |
Fertility by Education in Fairmount
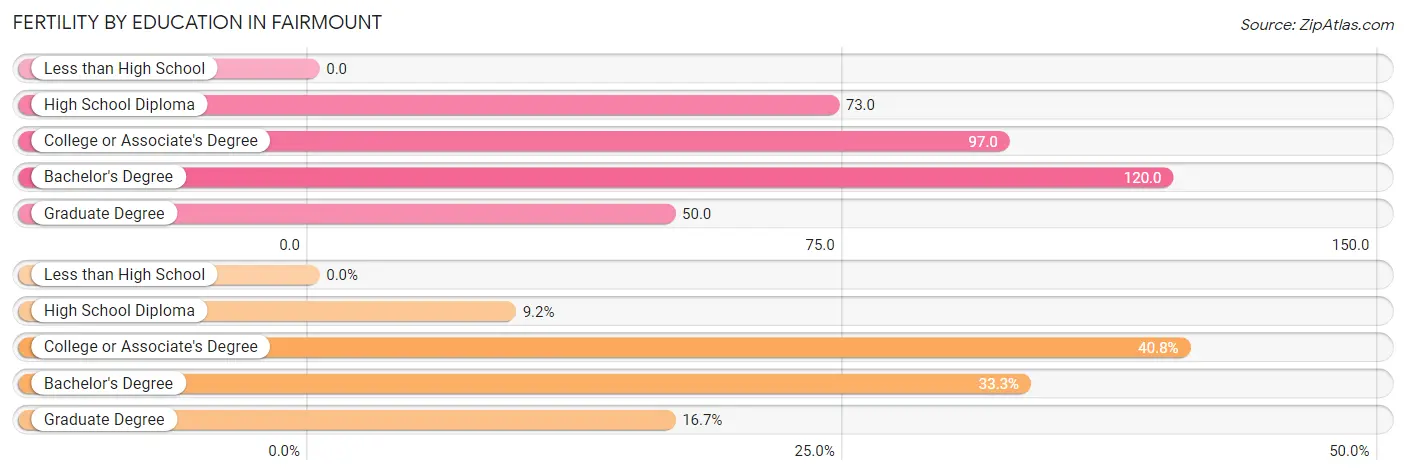
| Educational Attainment | Women with Births | Births / 1,000 Women |
| Less than High School | 0 (0.0%) | 0.0 |
| High School Diploma | 16 (9.2%) | 73.0 |
| College or Associate's Degree | 71 (40.8%) | 97.0 |
| Bachelor's Degree | 58 (33.3%) | 120.0 |
| Graduate Degree | 29 (16.7%) | 50.0 |
| Total | 174 (100.0%) | 78.0 |
Fertility by Education by Marriage Status in Fairmount
20.1% of women with births in Fairmount are unmarried. Women with the educational attainment of bachelor's degree are most likely to be married with 100.0% of them married at childbirth, while women with the educational attainment of high school diploma are least likely to be married with 100.0% of them unmarried at childbirth.
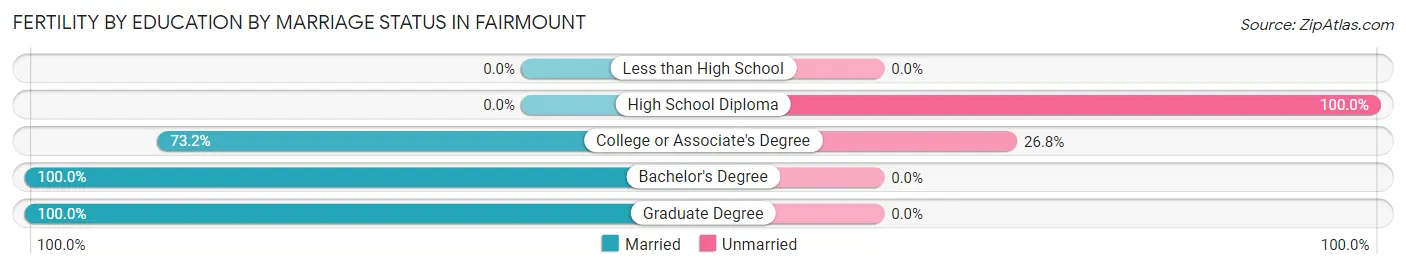
| Educational Attainment | Married | Unmarried |
| Less than High School | 0 (0.0%) | 0 (0.0%) |
| High School Diploma | 0 (0.0%) | 16 (100.0%) |
| College or Associate's Degree | 52 (73.2%) | 19 (26.8%) |
| Bachelor's Degree | 58 (100.0%) | 0 (0.0%) |
| Graduate Degree | 29 (100.0%) | 0 (0.0%) |
| Total | 139 (79.9%) | 35 (20.1%) |
Employment Characteristics in Fairmount
Employment by Class of Employer in Fairmount
Among the 5,265 employed individuals in Fairmount, private company employees (2,729 | 51.8%), local government employees (655 | 12.4%), and state government employees (651 | 12.4%) make up the most common classes of employment.
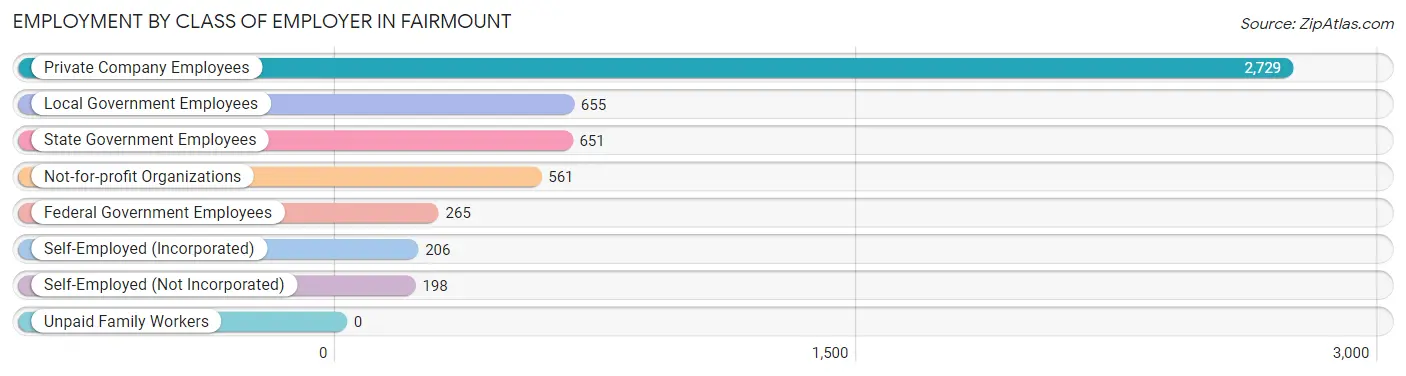
| Employer Class | # Employees | % Employees |
| Private Company Employees | 2,729 | 51.8% |
| Self-Employed (Incorporated) | 206 | 3.9% |
| Self-Employed (Not Incorporated) | 198 | 3.8% |
| Not-for-profit Organizations | 561 | 10.7% |
| Local Government Employees | 655 | 12.4% |
| State Government Employees | 651 | 12.4% |
| Federal Government Employees | 265 | 5.0% |
| Unpaid Family Workers | 0 | 0.0% |
| Total | 5,265 | 100.0% |
Employment Status by Age in Fairmount
According to the labor force statistics for Fairmount, out of the total population over 16 years of age (8,230), 67.4% or 5,547 individuals are in the labor force, with 2.5% or 139 of them unemployed. The age group with the highest labor force participation rate is 45 to 54 years, with 90.9% or 1,176 individuals in the labor force. Within the labor force, the 60 to 64 years age range has the highest percentage of unemployed individuals, with 5.8% or 39 of them being unemployed.
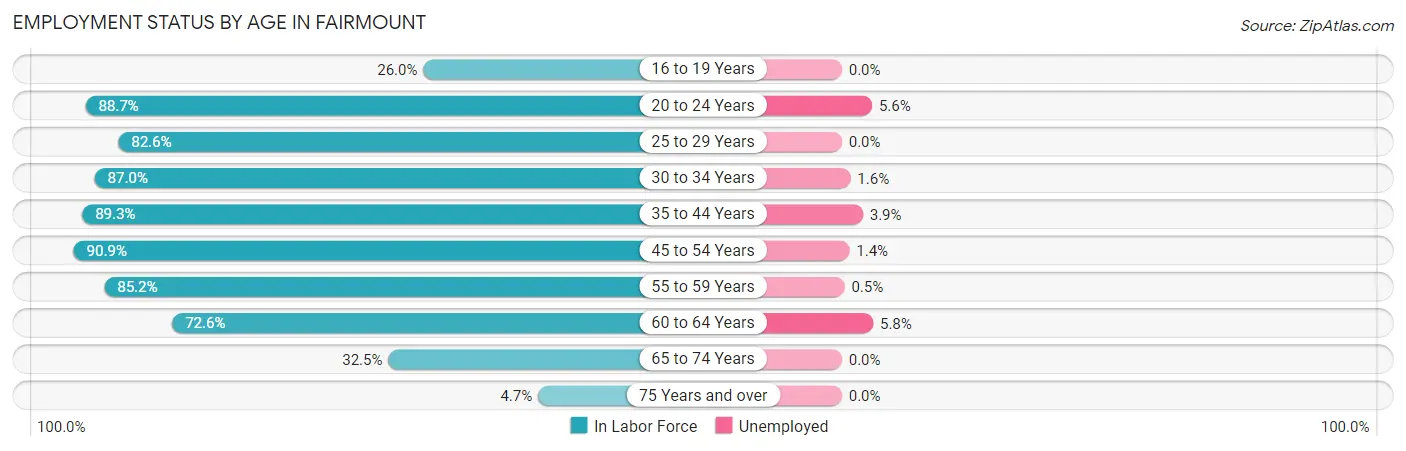
| Age Bracket | In Labor Force | Unemployed |
| 16 to 19 Years | 107 (26.0%) | 0 (0.0%) |
| 20 to 24 Years | 606 (88.7%) | 34 (5.6%) |
| 25 to 29 Years | 495 (82.6%) | 0 (0.0%) |
| 30 to 34 Years | 622 (87.0%) | 10 (1.6%) |
| 35 to 44 Years | 968 (89.3%) | 38 (3.9%) |
| 45 to 54 Years | 1,176 (90.9%) | 16 (1.4%) |
| 55 to 59 Years | 605 (85.2%) | 3 (0.5%) |
| 60 to 64 Years | 669 (72.6%) | 39 (5.8%) |
| 65 to 74 Years | 247 (32.5%) | 0 (0.0%) |
| 75 Years and over | 49 (4.7%) | 0 (0.0%) |
| Total | 5,547 (67.4%) | 139 (2.5%) |
Employment Status by Educational Attainment in Fairmount
According to labor force statistics for Fairmount, 85.2% of individuals (4,536) out of the total population between 25 and 64 years of age (5,324) are in the labor force, with 2.3% or 104 of them being unemployed. The group with the highest labor force participation rate are those with the educational attainment of bachelor's degree or higher, with 92.7% or 2,059 individuals in the labor force. Within the labor force, individuals with college / associate degree education have the highest percentage of unemployment, with 3.5% or 47 of them being unemployed.
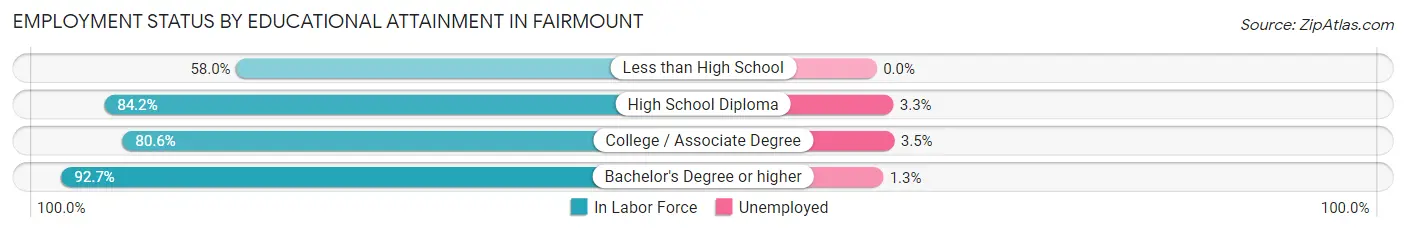
| Educational Attainment | In Labor Force | Unemployed |
| Less than High School | 170 (58.0%) | 0 (0.0%) |
| High School Diploma | 951 (84.2%) | 37 (3.3%) |
| College / Associate Degree | 1,355 (80.6%) | 59 (3.5%) |
| Bachelor's Degree or higher | 2,059 (92.7%) | 29 (1.3%) |
| Total | 4,536 (85.2%) | 122 (2.3%) |
Employment Occupations by Sex in Fairmount
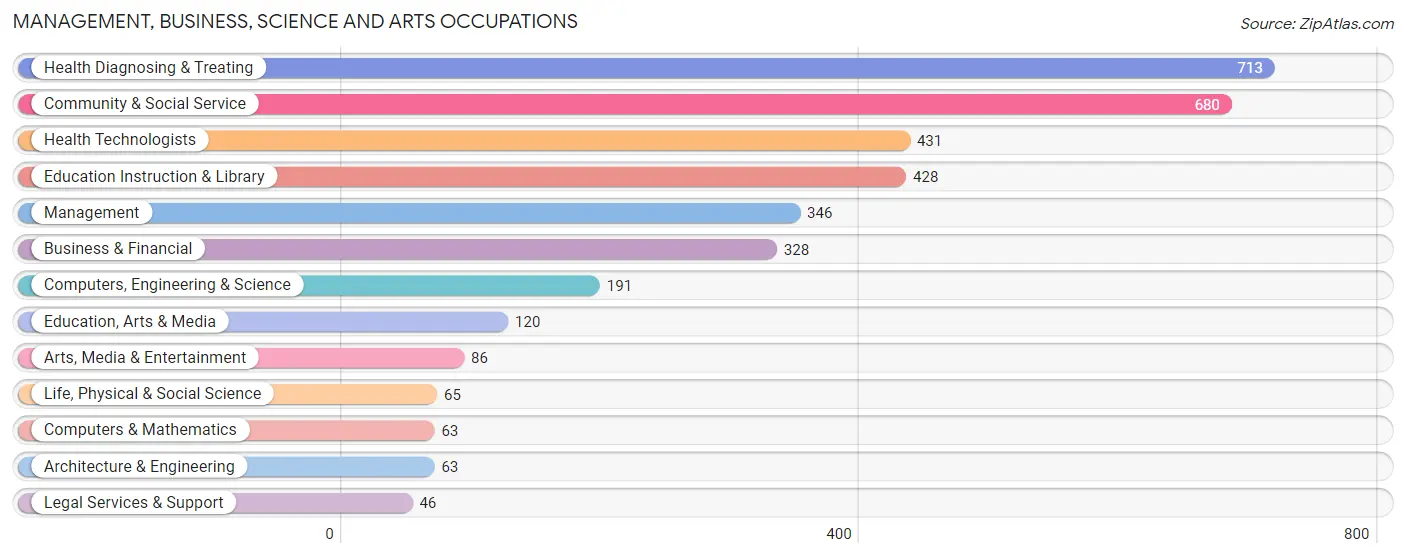
Management, Business, Science and Arts Occupations
The most common Management, Business, Science and Arts occupations in Fairmount are Health Diagnosing & Treating (713 | 13.2%), Community & Social Service (680 | 12.6%), Health Technologists (431 | 8.0%), Education Instruction & Library (428 | 7.9%), and Management (346 | 6.4%).
Management, Business, Science and Arts Occupations by Sex
Within the Management, Business, Science and Arts occupations in Fairmount, the most male-oriented occupations are Architecture & Engineering (100.0%), Life, Physical & Social Science (86.2%), and Computers, Engineering & Science (79.1%), while the most female-oriented occupations are Education, Arts & Media (100.0%), Health Technologists (92.3%), and Education Instruction & Library (89.9%).
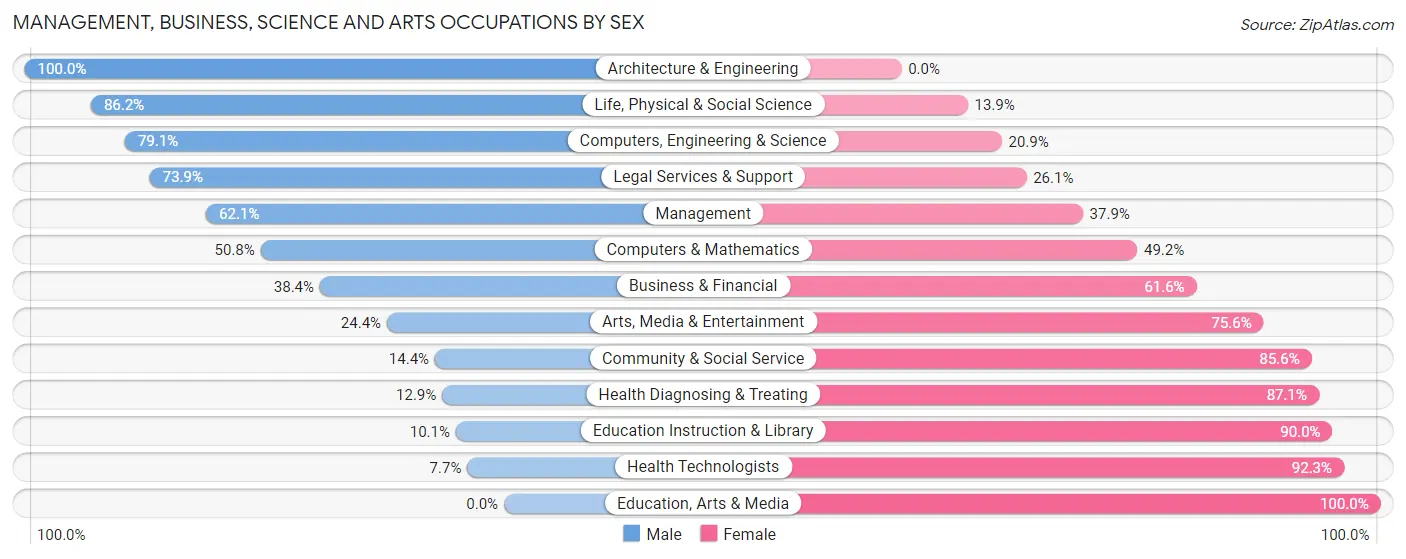
| Occupation | Male | Female |
| Management | 215 (62.1%) | 131 (37.9%) |
| Business & Financial | 126 (38.4%) | 202 (61.6%) |
| Computers, Engineering & Science | 151 (79.1%) | 40 (20.9%) |
| Computers & Mathematics | 32 (50.8%) | 31 (49.2%) |
| Architecture & Engineering | 63 (100.0%) | 0 (0.0%) |
| Life, Physical & Social Science | 56 (86.2%) | 9 (13.9%) |
| Community & Social Service | 98 (14.4%) | 582 (85.6%) |
| Education, Arts & Media | 0 (0.0%) | 120 (100.0%) |
| Legal Services & Support | 34 (73.9%) | 12 (26.1%) |
| Education Instruction & Library | 43 (10.1%) | 385 (89.9%) |
| Arts, Media & Entertainment | 21 (24.4%) | 65 (75.6%) |
| Health Diagnosing & Treating | 92 (12.9%) | 621 (87.1%) |
| Health Technologists | 33 (7.7%) | 398 (92.3%) |
| Total (Category) | 682 (30.2%) | 1,576 (69.8%) |
| Total (Overall) | 2,479 (46.0%) | 2,914 (54.0%) |
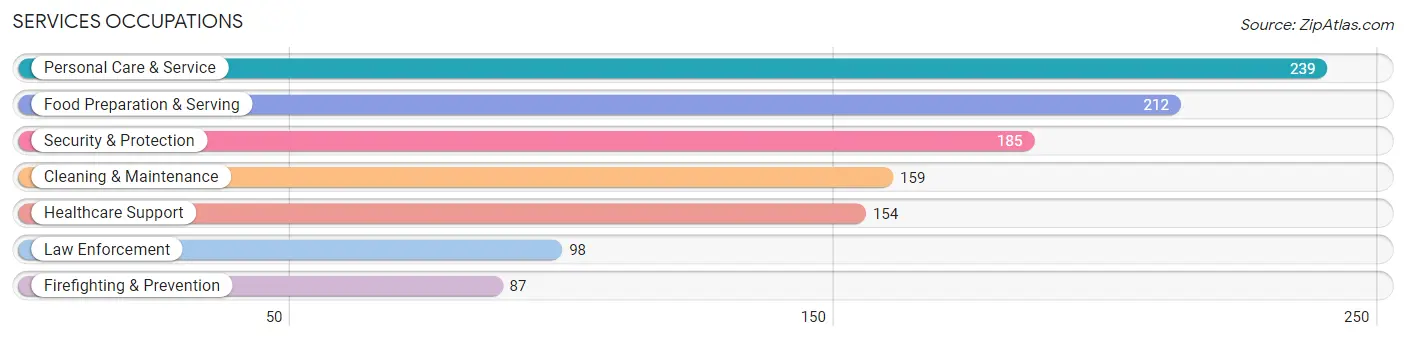
Services Occupations
The most common Services occupations in Fairmount are Personal Care & Service (239 | 4.4%), Food Preparation & Serving (212 | 3.9%), Security & Protection (185 | 3.4%), Cleaning & Maintenance (159 | 2.9%), and Healthcare Support (154 | 2.9%).
Services Occupations by Sex
Within the Services occupations in Fairmount, the most male-oriented occupations are Law Enforcement (79.6%), Security & Protection (76.8%), and Firefighting & Prevention (73.6%), while the most female-oriented occupations are Personal Care & Service (62.8%), Food Preparation & Serving (59.0%), and Healthcare Support (57.1%).
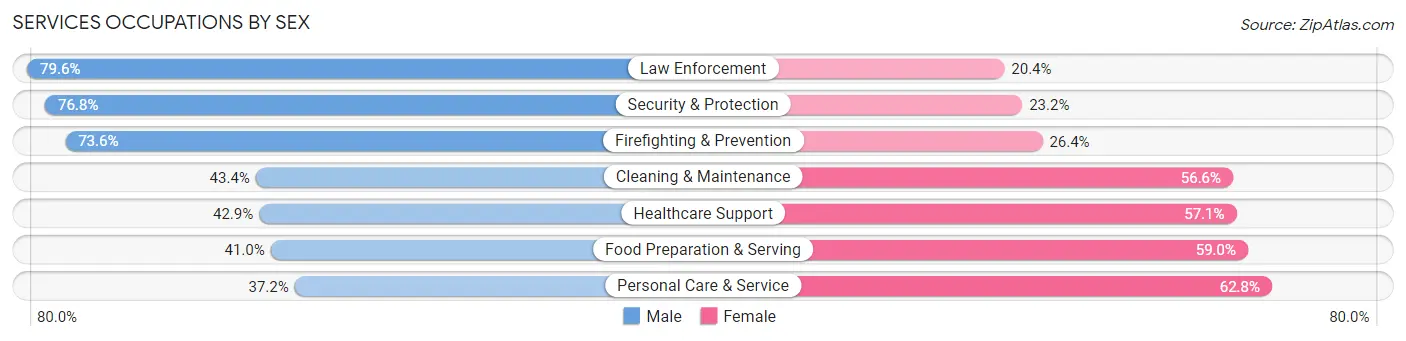
| Occupation | Male | Female |
| Healthcare Support | 66 (42.9%) | 88 (57.1%) |
| Security & Protection | 142 (76.8%) | 43 (23.2%) |
| Firefighting & Prevention | 64 (73.6%) | 23 (26.4%) |
| Law Enforcement | 78 (79.6%) | 20 (20.4%) |
| Food Preparation & Serving | 87 (41.0%) | 125 (59.0%) |
| Cleaning & Maintenance | 69 (43.4%) | 90 (56.6%) |
| Personal Care & Service | 89 (37.2%) | 150 (62.8%) |
| Total (Category) | 453 (47.7%) | 496 (52.3%) |
| Total (Overall) | 2,479 (46.0%) | 2,914 (54.0%) |
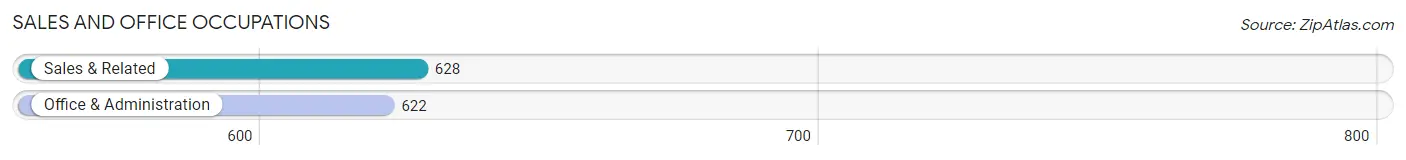
Sales and Office Occupations
The most common Sales and Office occupations in Fairmount are Sales & Related (628 | 11.6%), and Office & Administration (622 | 11.5%).
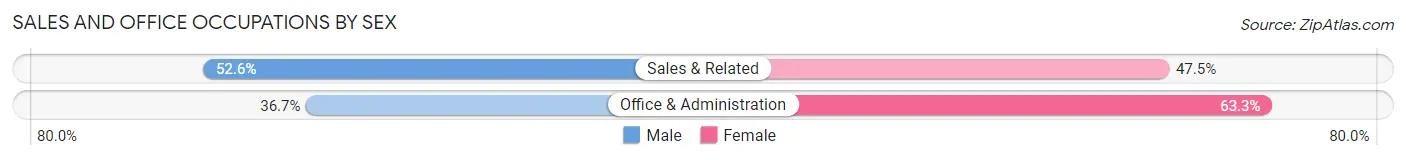
Sales and Office Occupations by Sex
| Occupation | Male | Female |
| Sales & Related | 330 (52.5%) | 298 (47.4%) |
| Office & Administration | 228 (36.7%) | 394 (63.3%) |
| Total (Category) | 558 (44.6%) | 692 (55.4%) |
| Total (Overall) | 2,479 (46.0%) | 2,914 (54.0%) |
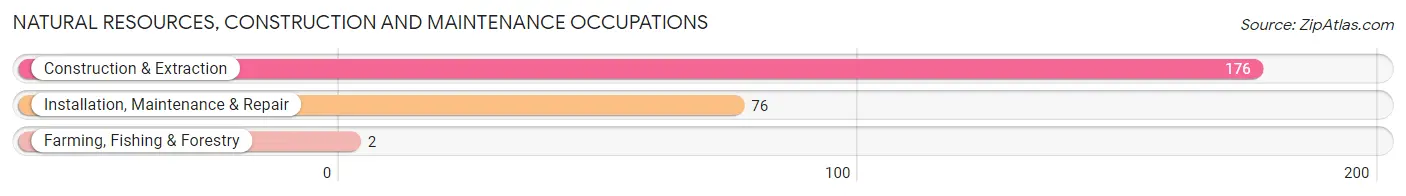
Natural Resources, Construction and Maintenance Occupations
The most common Natural Resources, Construction and Maintenance occupations in Fairmount are Construction & Extraction (176 | 3.3%), Installation, Maintenance & Repair (76 | 1.4%), and Farming, Fishing & Forestry (2 | 0.0%).
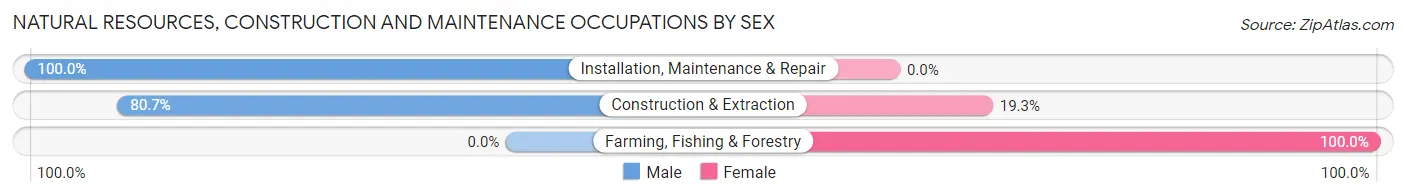
Natural Resources, Construction and Maintenance Occupations by Sex
| Occupation | Male | Female |
| Farming, Fishing & Forestry | 0 (0.0%) | 2 (100.0%) |
| Construction & Extraction | 142 (80.7%) | 34 (19.3%) |
| Installation, Maintenance & Repair | 76 (100.0%) | 0 (0.0%) |
| Total (Category) | 218 (85.8%) | 36 (14.2%) |
| Total (Overall) | 2,479 (46.0%) | 2,914 (54.0%) |
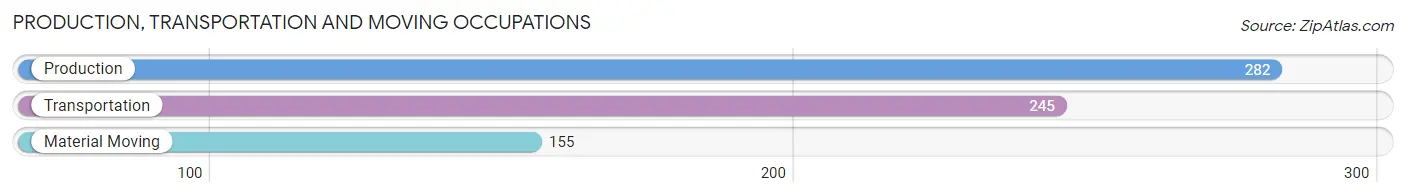
Production, Transportation and Moving Occupations
The most common Production, Transportation and Moving occupations in Fairmount are Production (282 | 5.2%), Transportation (245 | 4.5%), and Material Moving (155 | 2.9%).
Production, Transportation and Moving Occupations by Sex
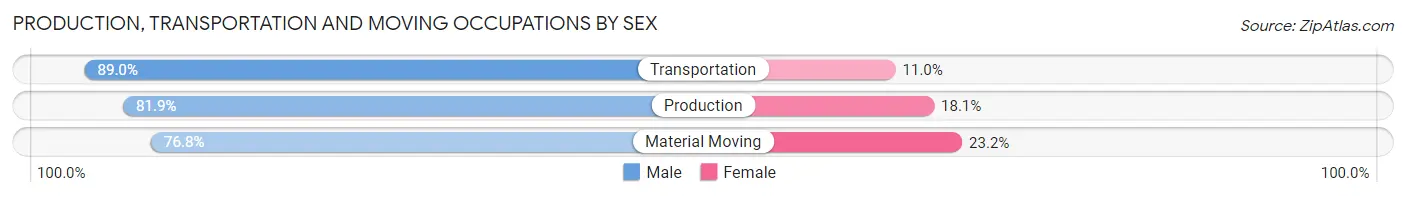
| Occupation | Male | Female |
| Production | 231 (81.9%) | 51 (18.1%) |
| Transportation | 218 (89.0%) | 27 (11.0%) |
| Material Moving | 119 (76.8%) | 36 (23.2%) |
| Total (Category) | 568 (83.3%) | 114 (16.7%) |
| Total (Overall) | 2,479 (46.0%) | 2,914 (54.0%) |
Employment Industries by Sex in Fairmount
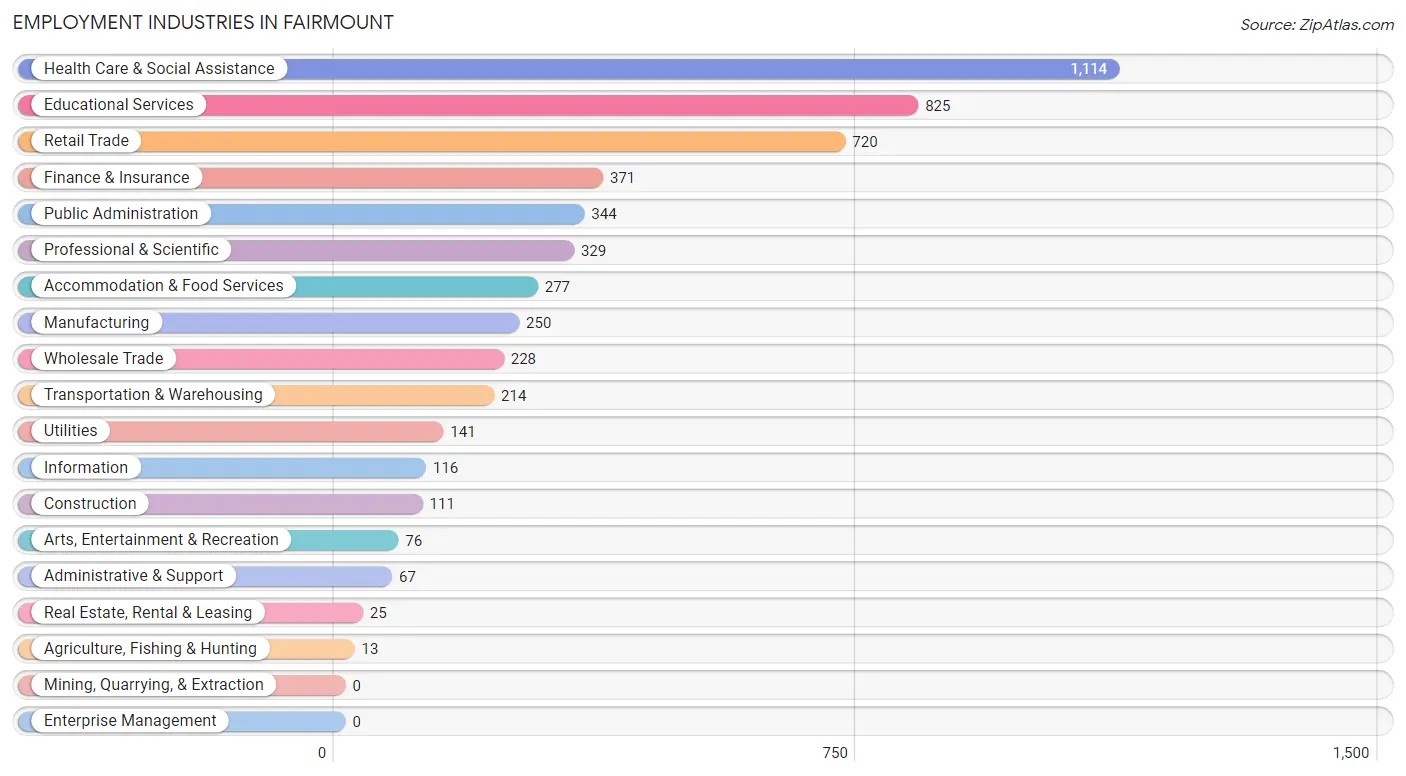
Employment Industries in Fairmount
The major employment industries in Fairmount include Health Care & Social Assistance (1,114 | 20.7%), Educational Services (825 | 15.3%), Retail Trade (720 | 13.4%), Finance & Insurance (371 | 6.9%), and Public Administration (344 | 6.4%).
Employment Industries by Sex in Fairmount
The Fairmount industries that see more men than women are Wholesale Trade (100.0%), Transportation & Warehousing (92.1%), and Agriculture, Fishing & Hunting (84.6%), whereas the industries that tend to have a higher number of women are Health Care & Social Assistance (84.9%), Finance & Insurance (76.5%), and Accommodation & Food Services (71.1%).
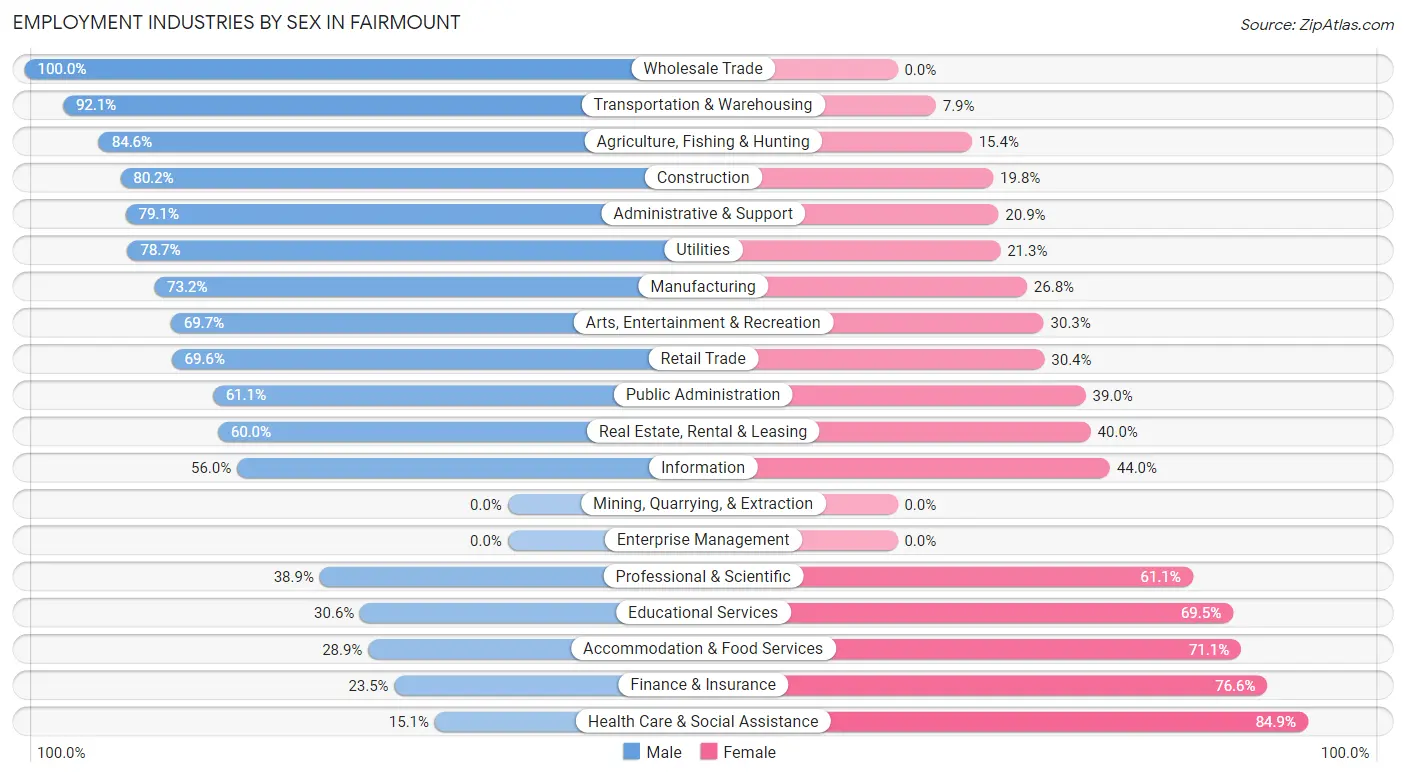
| Industry | Male | Female |
| Agriculture, Fishing & Hunting | 11 (84.6%) | 2 (15.4%) |
| Mining, Quarrying, & Extraction | 0 (0.0%) | 0 (0.0%) |
| Construction | 89 (80.2%) | 22 (19.8%) |
| Manufacturing | 183 (73.2%) | 67 (26.8%) |
| Wholesale Trade | 228 (100.0%) | 0 (0.0%) |
| Retail Trade | 501 (69.6%) | 219 (30.4%) |
| Transportation & Warehousing | 197 (92.1%) | 17 (7.9%) |
| Utilities | 111 (78.7%) | 30 (21.3%) |
| Information | 65 (56.0%) | 51 (44.0%) |
| Finance & Insurance | 87 (23.4%) | 284 (76.5%) |
| Real Estate, Rental & Leasing | 15 (60.0%) | 10 (40.0%) |
| Professional & Scientific | 128 (38.9%) | 201 (61.1%) |
| Enterprise Management | 0 (0.0%) | 0 (0.0%) |
| Administrative & Support | 53 (79.1%) | 14 (20.9%) |
| Educational Services | 252 (30.5%) | 573 (69.5%) |
| Health Care & Social Assistance | 168 (15.1%) | 946 (84.9%) |
| Arts, Entertainment & Recreation | 53 (69.7%) | 23 (30.3%) |
| Accommodation & Food Services | 80 (28.9%) | 197 (71.1%) |
| Public Administration | 210 (61.1%) | 134 (39.0%) |
| Total | 2,479 (46.0%) | 2,914 (54.0%) |
Education in Fairmount
School Enrollment in Fairmount
The most common levels of schooling among the 1,811 students in Fairmount are middle school (522 | 28.8%), high school (378 | 20.9%), and elementary school (287 | 15.9%).
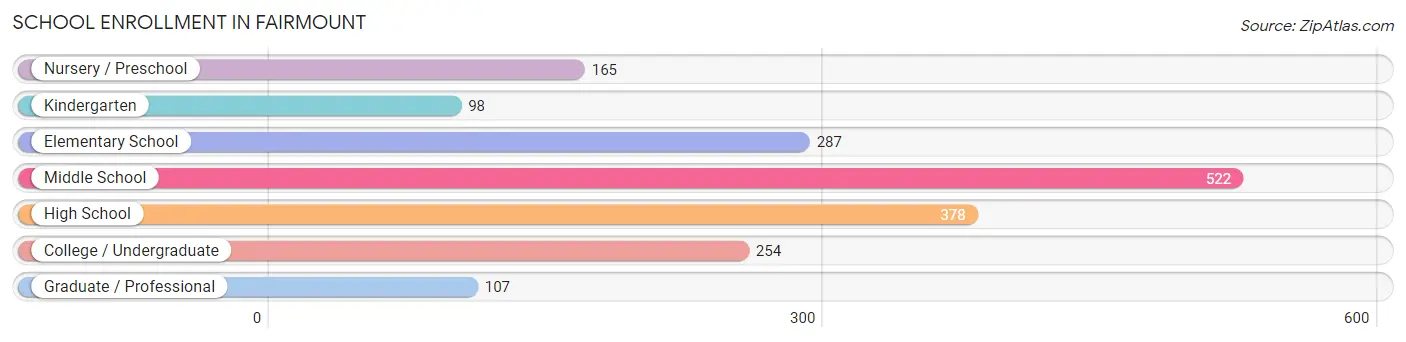
| School Level | # Students | % Students |
| Nursery / Preschool | 165 | 9.1% |
| Kindergarten | 98 | 5.4% |
| Elementary School | 287 | 15.9% |
| Middle School | 522 | 28.8% |
| High School | 378 | 20.9% |
| College / Undergraduate | 254 | 14.0% |
| Graduate / Professional | 107 | 5.9% |
| Total | 1,811 | 100.0% |
School Enrollment by Age by Funding Source in Fairmount
Out of a total of 1,811 students who are enrolled in schools in Fairmount, 406 (22.4%) attend a private institution, while the remaining 1,405 (77.6%) are enrolled in public schools. The age group of 20 to 24 year olds has the highest likelihood of being enrolled in private schools, with 124 (86.7% in the age bracket) enrolled. Conversely, the age group of 5 to 9 year old has the lowest likelihood of being enrolled in a private school, with 335 (100.0% in the age bracket) attending a public institution.
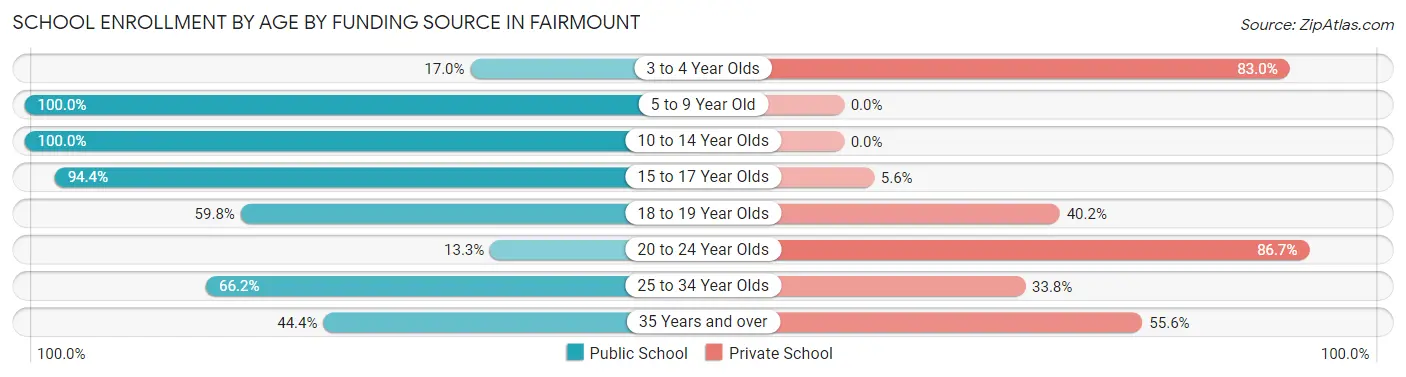
| Age Bracket | Public School | Private School |
| 3 to 4 Year Olds | 28 (17.0%) | 137 (83.0%) |
| 5 to 9 Year Old | 335 (100.0%) | 0 (0.0%) |
| 10 to 14 Year Olds | 633 (100.0%) | 0 (0.0%) |
| 15 to 17 Year Olds | 235 (94.4%) | 14 (5.6%) |
| 18 to 19 Year Olds | 49 (59.8%) | 33 (40.2%) |
| 20 to 24 Year Olds | 19 (13.3%) | 124 (86.7%) |
| 25 to 34 Year Olds | 47 (66.2%) | 24 (33.8%) |
| 35 Years and over | 59 (44.4%) | 74 (55.6%) |
| Total | 1,405 (77.6%) | 406 (22.4%) |
Educational Attainment by Field of Study in Fairmount
Science & technology (450 | 15.8%), education (445 | 15.6%), business (394 | 13.8%), psychology (267 | 9.3%), and arts & humanities (203 | 7.1%) are the most common fields of study among 2,855 individuals in Fairmount who have obtained a bachelor's degree or higher.
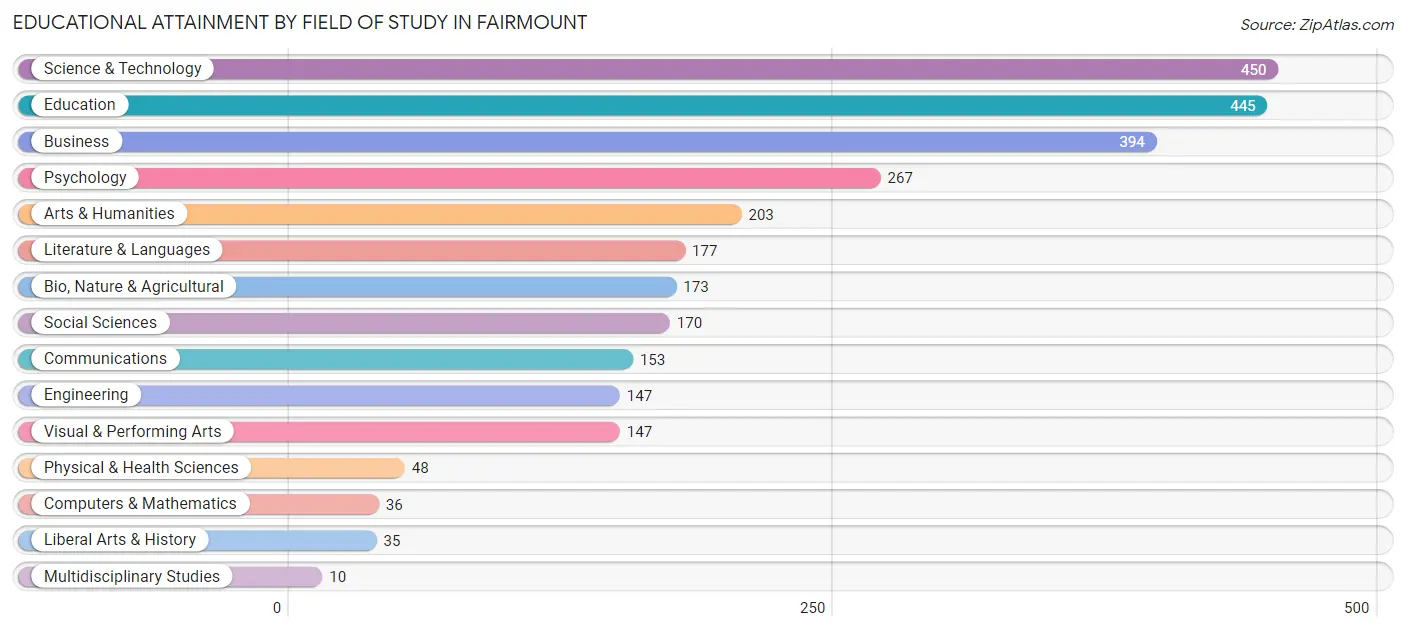
| Field of Study | # Graduates | % Graduates |
| Computers & Mathematics | 36 | 1.3% |
| Bio, Nature & Agricultural | 173 | 6.1% |
| Physical & Health Sciences | 48 | 1.7% |
| Psychology | 267 | 9.3% |
| Social Sciences | 170 | 5.9% |
| Engineering | 147 | 5.1% |
| Multidisciplinary Studies | 10 | 0.4% |
| Science & Technology | 450 | 15.8% |
| Business | 394 | 13.8% |
| Education | 445 | 15.6% |
| Literature & Languages | 177 | 6.2% |
| Liberal Arts & History | 35 | 1.2% |
| Visual & Performing Arts | 147 | 5.1% |
| Communications | 153 | 5.4% |
| Arts & Humanities | 203 | 7.1% |
| Total | 2,855 | 100.0% |
Transportation & Commute in Fairmount
Vehicle Availability by Sex in Fairmount
The most prevalent vehicle ownership categories in Fairmount are males with 2 vehicles (1,359, accounting for 55.9%) and females with 2 vehicles (1,315, making up 48.0%).
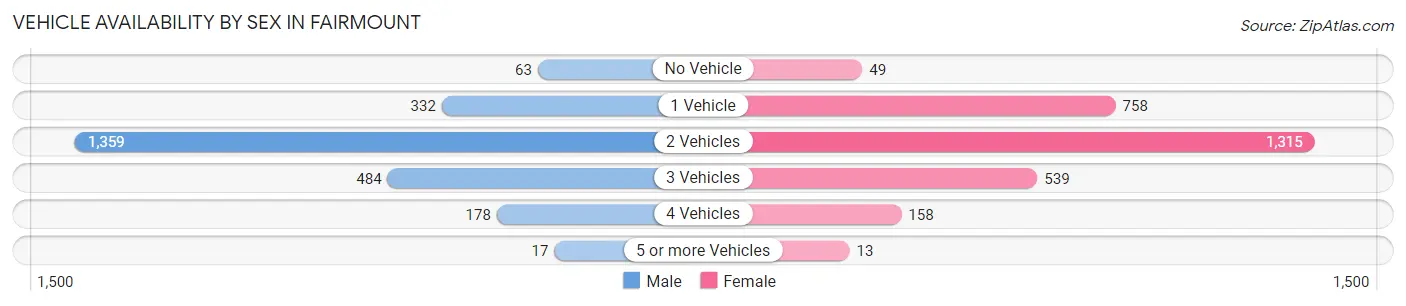
| Vehicles Available | Male | Female |
| No Vehicle | 63 (2.6%) | 49 (1.7%) |
| 1 Vehicle | 332 (13.7%) | 758 (26.8%) |
| 2 Vehicles | 1,359 (55.9%) | 1,315 (46.4%) |
| 3 Vehicles | 484 (19.9%) | 539 (19.0%) |
| 4 Vehicles | 178 (7.3%) | 158 (5.6%) |
| 5 or more Vehicles | 17 (0.7%) | 13 (0.5%) |
| Total | 2,433 (100.0%) | 2,832 (100.0%) |
Commute Time in Fairmount
The most frequently occuring commute durations in Fairmount are 20 to 24 minutes (1,575 commuters, 32.6%), 15 to 19 minutes (758 commuters, 15.7%), and 5 to 9 minutes (696 commuters, 14.4%).
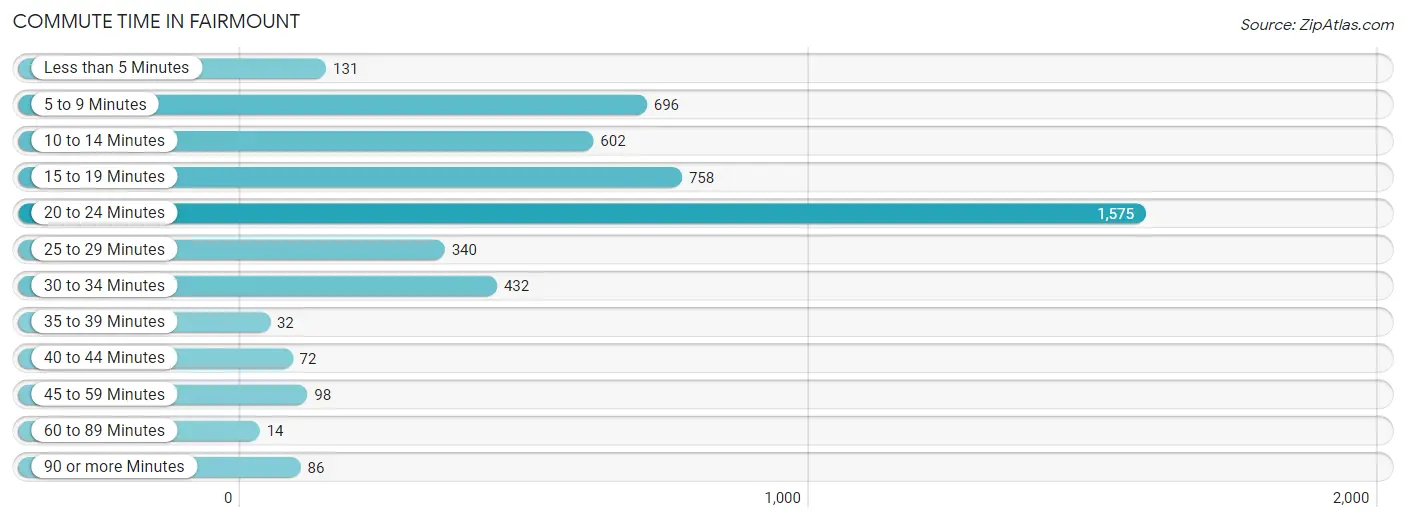
| Commute Time | # Commuters | % Commuters |
| Less than 5 Minutes | 131 | 2.7% |
| 5 to 9 Minutes | 696 | 14.4% |
| 10 to 14 Minutes | 602 | 12.4% |
| 15 to 19 Minutes | 758 | 15.7% |
| 20 to 24 Minutes | 1,575 | 32.6% |
| 25 to 29 Minutes | 340 | 7.0% |
| 30 to 34 Minutes | 432 | 8.9% |
| 35 to 39 Minutes | 32 | 0.7% |
| 40 to 44 Minutes | 72 | 1.5% |
| 45 to 59 Minutes | 98 | 2.0% |
| 60 to 89 Minutes | 14 | 0.3% |
| 90 or more Minutes | 86 | 1.8% |
Commute Time by Sex in Fairmount
The most common commute times in Fairmount are 20 to 24 minutes (591 commuters, 26.7%) for males and 20 to 24 minutes (984 commuters, 37.5%) for females.
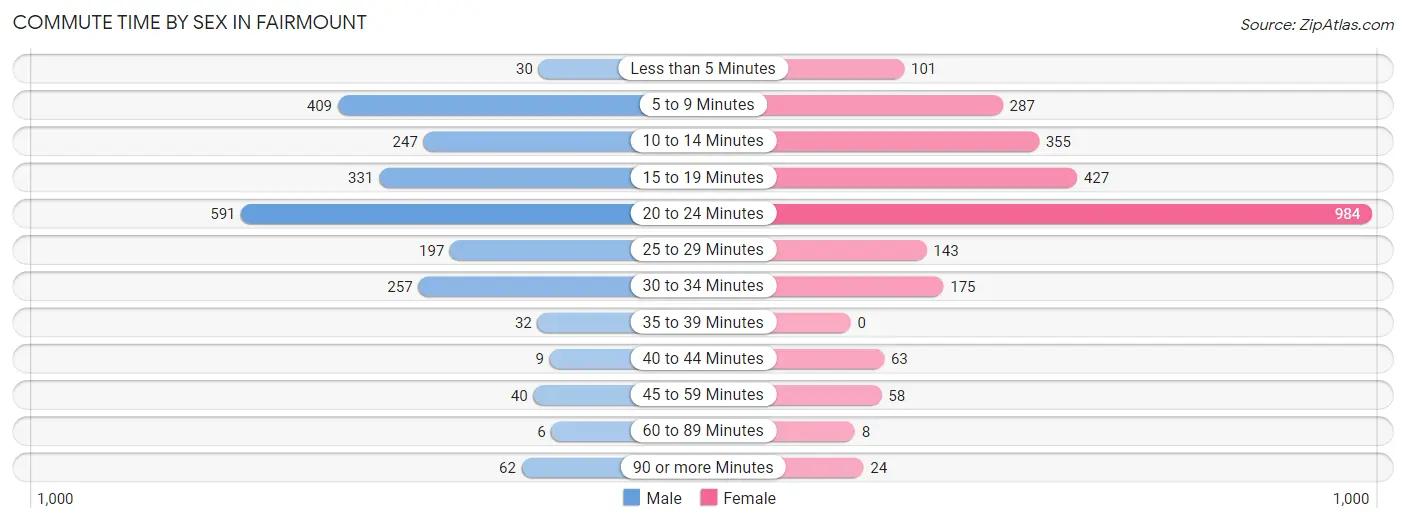
| Commute Time | Male | Female |
| Less than 5 Minutes | 30 (1.4%) | 101 (3.8%) |
| 5 to 9 Minutes | 409 (18.5%) | 287 (10.9%) |
| 10 to 14 Minutes | 247 (11.2%) | 355 (13.5%) |
| 15 to 19 Minutes | 331 (15.0%) | 427 (16.3%) |
| 20 to 24 Minutes | 591 (26.7%) | 984 (37.5%) |
| 25 to 29 Minutes | 197 (8.9%) | 143 (5.4%) |
| 30 to 34 Minutes | 257 (11.6%) | 175 (6.7%) |
| 35 to 39 Minutes | 32 (1.5%) | 0 (0.0%) |
| 40 to 44 Minutes | 9 (0.4%) | 63 (2.4%) |
| 45 to 59 Minutes | 40 (1.8%) | 58 (2.2%) |
| 60 to 89 Minutes | 6 (0.3%) | 8 (0.3%) |
| 90 or more Minutes | 62 (2.8%) | 24 (0.9%) |
Time of Departure to Work by Sex in Fairmount
The most frequent times of departure to work in Fairmount are 6:00 AM to 6:29 AM (401, 18.1%) for males and 6:30 AM to 6:59 AM (454, 17.3%) for females.
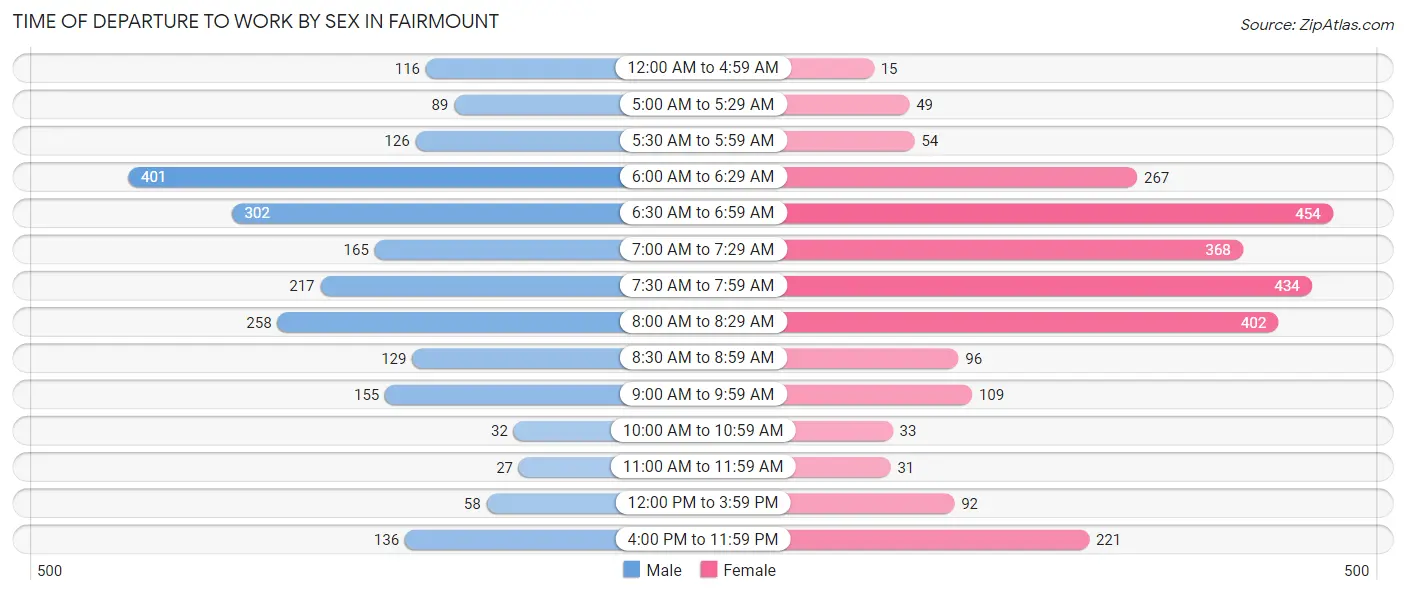
| Time of Departure | Male | Female |
| 12:00 AM to 4:59 AM | 116 (5.2%) | 15 (0.6%) |
| 5:00 AM to 5:29 AM | 89 (4.0%) | 49 (1.9%) |
| 5:30 AM to 5:59 AM | 126 (5.7%) | 54 (2.1%) |
| 6:00 AM to 6:29 AM | 401 (18.1%) | 267 (10.2%) |
| 6:30 AM to 6:59 AM | 302 (13.7%) | 454 (17.3%) |
| 7:00 AM to 7:29 AM | 165 (7.5%) | 368 (14.0%) |
| 7:30 AM to 7:59 AM | 217 (9.8%) | 434 (16.5%) |
| 8:00 AM to 8:29 AM | 258 (11.7%) | 402 (15.3%) |
| 8:30 AM to 8:59 AM | 129 (5.8%) | 96 (3.7%) |
| 9:00 AM to 9:59 AM | 155 (7.0%) | 109 (4.2%) |
| 10:00 AM to 10:59 AM | 32 (1.5%) | 33 (1.3%) |
| 11:00 AM to 11:59 AM | 27 (1.2%) | 31 (1.2%) |
| 12:00 PM to 3:59 PM | 58 (2.6%) | 92 (3.5%) |
| 4:00 PM to 11:59 PM | 136 (6.1%) | 221 (8.4%) |
| Total | 2,211 (100.0%) | 2,625 (100.0%) |
Housing Occupancy in Fairmount
Occupancy by Ownership in Fairmount
Of the total 4,045 dwellings in Fairmount, owner-occupied units account for 3,191 (78.9%), while renter-occupied units make up 854 (21.1%).
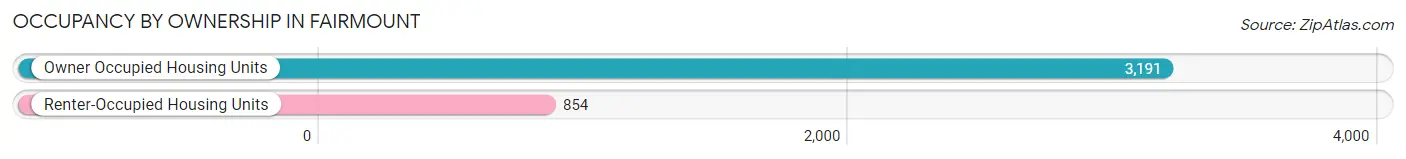
| Occupancy | # Housing Units | % Housing Units |
| Owner Occupied Housing Units | 3,191 | 78.9% |
| Renter-Occupied Housing Units | 854 | 21.1% |
| Total Occupied Housing Units | 4,045 | 100.0% |
Occupancy by Household Size in Fairmount
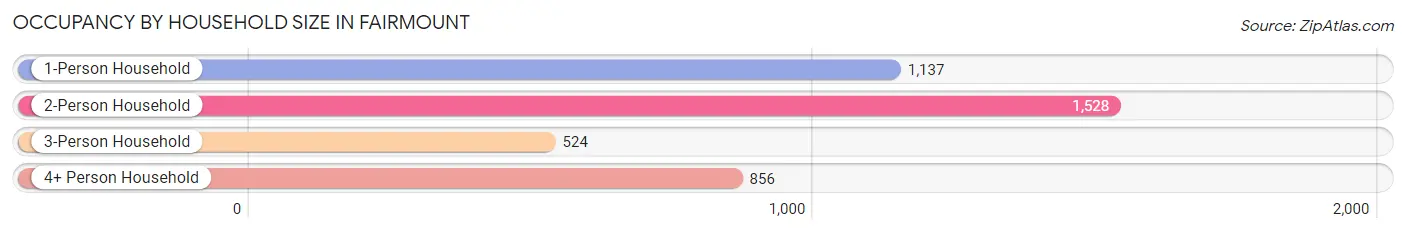
| Household Size | # Housing Units | % Housing Units |
| 1-Person Household | 1,137 | 28.1% |
| 2-Person Household | 1,528 | 37.8% |
| 3-Person Household | 524 | 13.0% |
| 4+ Person Household | 856 | 21.2% |
| Total Housing Units | 4,045 | 100.0% |
Occupancy by Ownership by Household Size in Fairmount
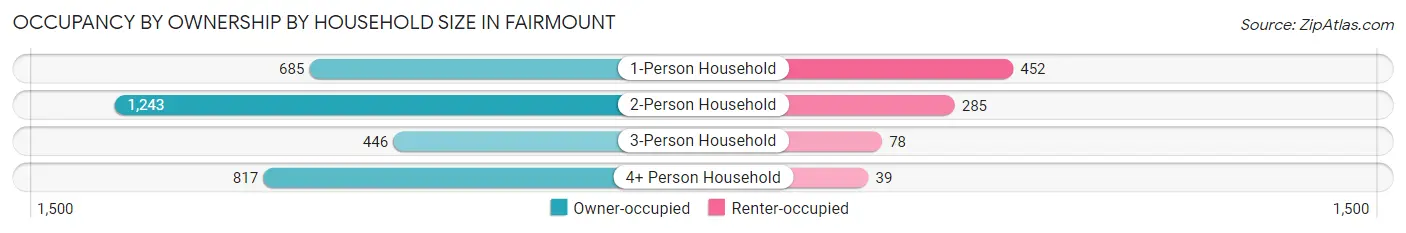
| Household Size | Owner-occupied | Renter-occupied |
| 1-Person Household | 685 (60.3%) | 452 (39.8%) |
| 2-Person Household | 1,243 (81.4%) | 285 (18.6%) |
| 3-Person Household | 446 (85.1%) | 78 (14.9%) |
| 4+ Person Household | 817 (95.4%) | 39 (4.6%) |
| Total Housing Units | 3,191 (78.9%) | 854 (21.1%) |
Occupancy by Educational Attainment in Fairmount
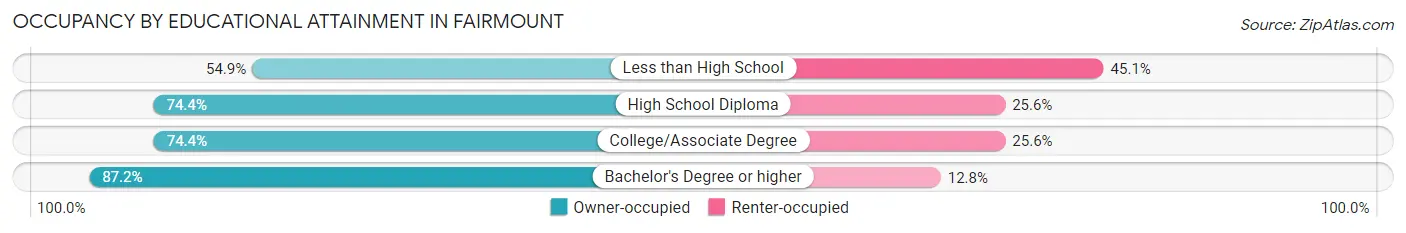
| Household Size | Owner-occupied | Renter-occupied |
| Less than High School | 112 (54.9%) | 92 (45.1%) |
| High School Diploma | 643 (74.4%) | 221 (25.6%) |
| College/Associate Degree | 926 (74.4%) | 319 (25.6%) |
| Bachelor's Degree or higher | 1,510 (87.2%) | 222 (12.8%) |
Occupancy by Age of Householder in Fairmount
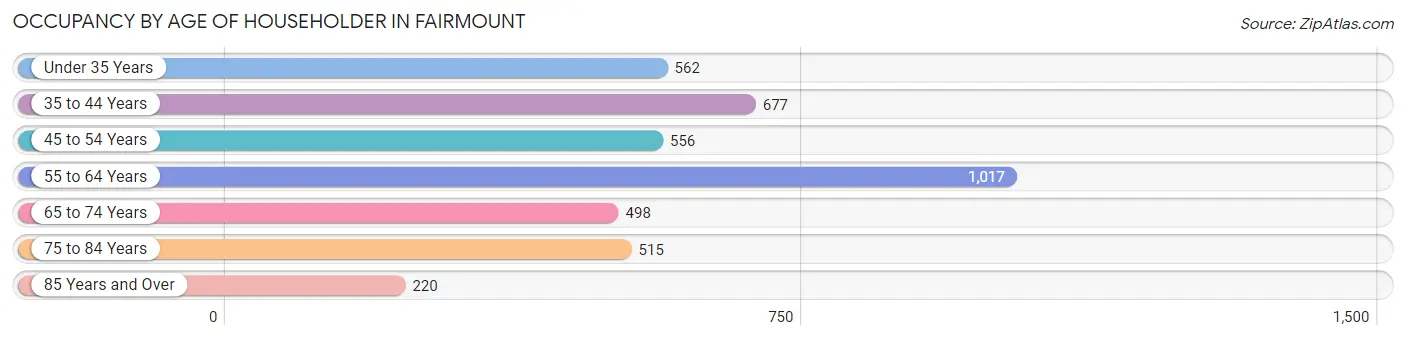
| Age Bracket | # Households | % Households |
| Under 35 Years | 562 | 13.9% |
| 35 to 44 Years | 677 | 16.7% |
| 45 to 54 Years | 556 | 13.8% |
| 55 to 64 Years | 1,017 | 25.1% |
| 65 to 74 Years | 498 | 12.3% |
| 75 to 84 Years | 515 | 12.7% |
| 85 Years and Over | 220 | 5.4% |
| Total | 4,045 | 100.0% |
Housing Finances in Fairmount
Median Income by Occupancy in Fairmount
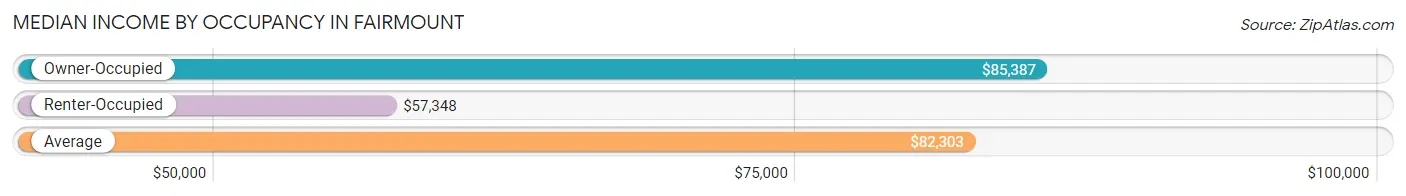
| Occupancy Type | # Households | Median Income |
| Owner-Occupied | 3,191 (78.9%) | $85,387 |
| Renter-Occupied | 854 (21.1%) | $57,348 |
| Average | 4,045 (100.0%) | $82,303 |
Occupancy by Householder Income Bracket in Fairmount
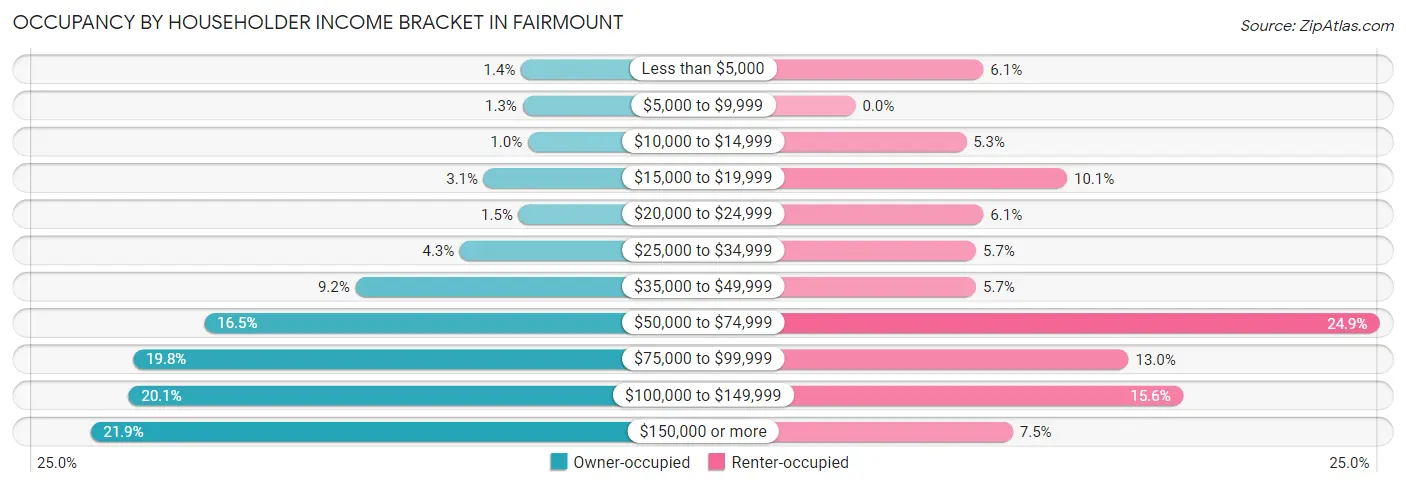
| Income Bracket | Owner-occupied | Renter-occupied |
| Less than $5,000 | 43 (1.3%) | 52 (6.1%) |
| $5,000 to $9,999 | 41 (1.3%) | 0 (0.0%) |
| $10,000 to $14,999 | 33 (1.0%) | 45 (5.3%) |
| $15,000 to $19,999 | 100 (3.1%) | 86 (10.1%) |
| $20,000 to $24,999 | 47 (1.5%) | 52 (6.1%) |
| $25,000 to $34,999 | 136 (4.3%) | 49 (5.7%) |
| $35,000 to $49,999 | 295 (9.2%) | 49 (5.7%) |
| $50,000 to $74,999 | 525 (16.5%) | 213 (24.9%) |
| $75,000 to $99,999 | 633 (19.8%) | 111 (13.0%) |
| $100,000 to $149,999 | 640 (20.1%) | 133 (15.6%) |
| $150,000 or more | 698 (21.9%) | 64 (7.5%) |
| Total | 3,191 (100.0%) | 854 (100.0%) |
Monthly Housing Cost Tiers in Fairmount
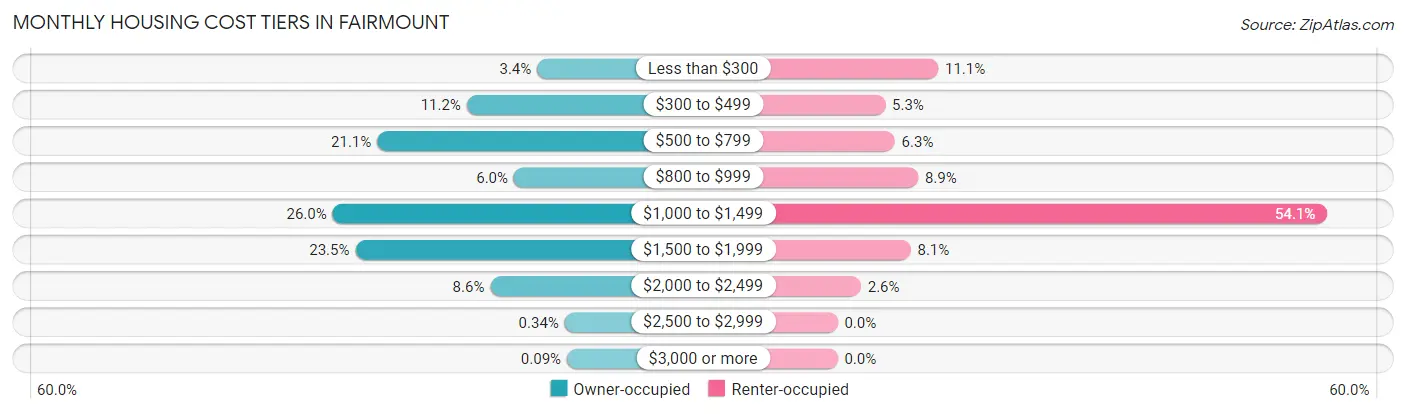
| Monthly Cost | Owner-occupied | Renter-occupied |
| Less than $300 | 108 (3.4%) | 95 (11.1%) |
| $300 to $499 | 356 (11.2%) | 45 (5.3%) |
| $500 to $799 | 672 (21.1%) | 54 (6.3%) |
| $800 to $999 | 190 (5.9%) | 76 (8.9%) |
| $1,000 to $1,499 | 829 (26.0%) | 462 (54.1%) |
| $1,500 to $1,999 | 749 (23.5%) | 69 (8.1%) |
| $2,000 to $2,499 | 273 (8.6%) | 22 (2.6%) |
| $2,500 to $2,999 | 11 (0.3%) | 0 (0.0%) |
| $3,000 or more | 3 (0.1%) | 0 (0.0%) |
| Total | 3,191 (100.0%) | 854 (100.0%) |
Physical Housing Characteristics in Fairmount
Housing Structures in Fairmount
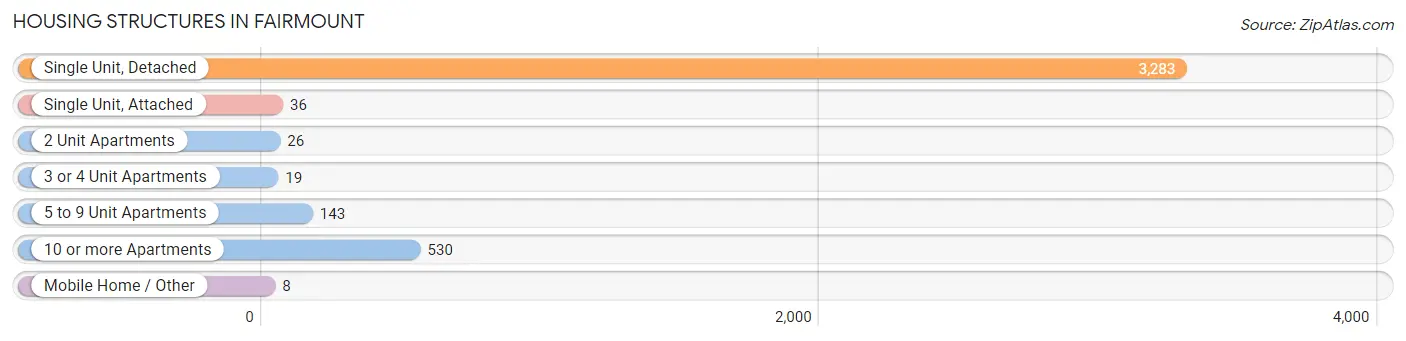
| Structure Type | # Housing Units | % Housing Units |
| Single Unit, Detached | 3,283 | 81.2% |
| Single Unit, Attached | 36 | 0.9% |
| 2 Unit Apartments | 26 | 0.6% |
| 3 or 4 Unit Apartments | 19 | 0.5% |
| 5 to 9 Unit Apartments | 143 | 3.5% |
| 10 or more Apartments | 530 | 13.1% |
| Mobile Home / Other | 8 | 0.2% |
| Total | 4,045 | 100.0% |
Housing Structures by Occupancy in Fairmount
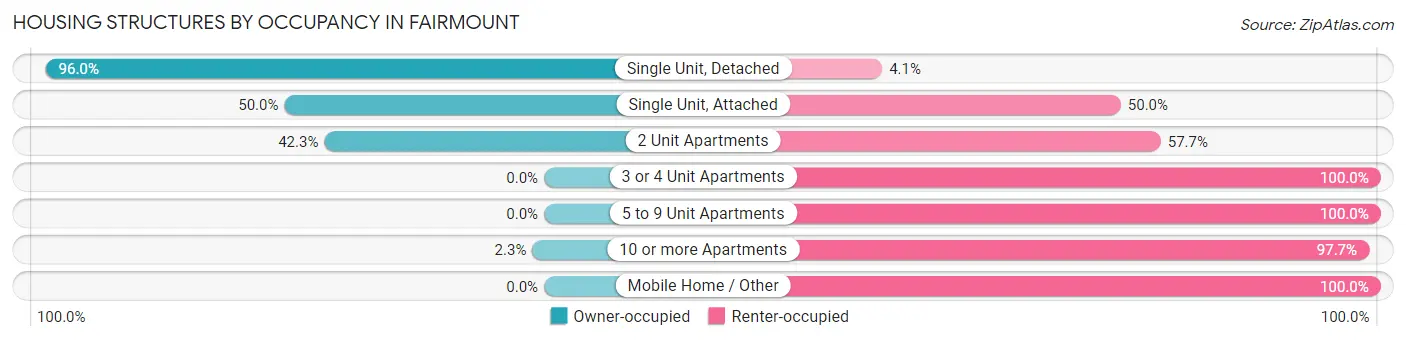
| Structure Type | Owner-occupied | Renter-occupied |
| Single Unit, Detached | 3,150 (96.0%) | 133 (4.1%) |
| Single Unit, Attached | 18 (50.0%) | 18 (50.0%) |
| 2 Unit Apartments | 11 (42.3%) | 15 (57.7%) |
| 3 or 4 Unit Apartments | 0 (0.0%) | 19 (100.0%) |
| 5 to 9 Unit Apartments | 0 (0.0%) | 143 (100.0%) |
| 10 or more Apartments | 12 (2.3%) | 518 (97.7%) |
| Mobile Home / Other | 0 (0.0%) | 8 (100.0%) |
| Total | 3,191 (78.9%) | 854 (21.1%) |
Housing Structures by Number of Rooms in Fairmount
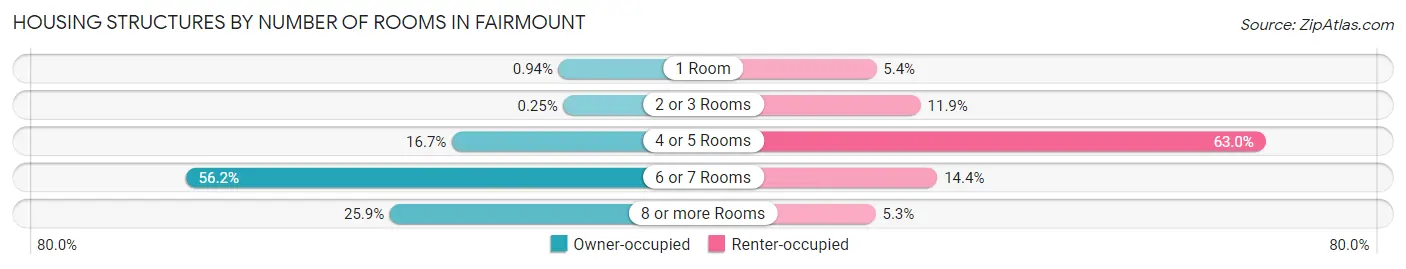
| Number of Rooms | Owner-occupied | Renter-occupied |
| 1 Room | 30 (0.9%) | 46 (5.4%) |
| 2 or 3 Rooms | 8 (0.3%) | 102 (11.9%) |
| 4 or 5 Rooms | 534 (16.7%) | 538 (63.0%) |
| 6 or 7 Rooms | 1,792 (56.2%) | 123 (14.4%) |
| 8 or more Rooms | 827 (25.9%) | 45 (5.3%) |
| Total | 3,191 (100.0%) | 854 (100.0%) |
Housing Structure by Heating Type in Fairmount
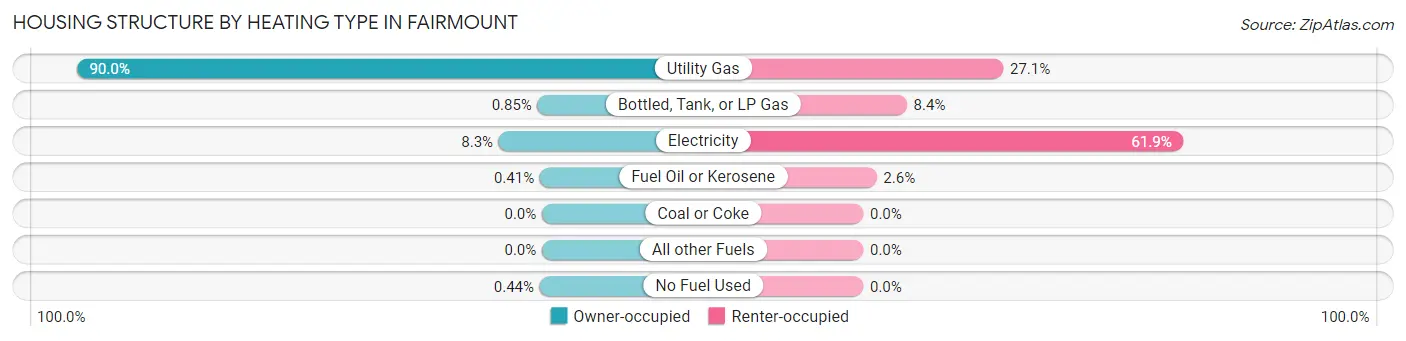
| Heating Type | Owner-occupied | Renter-occupied |
| Utility Gas | 2,871 (90.0%) | 231 (27.1%) |
| Bottled, Tank, or LP Gas | 27 (0.9%) | 72 (8.4%) |
| Electricity | 266 (8.3%) | 529 (61.9%) |
| Fuel Oil or Kerosene | 13 (0.4%) | 22 (2.6%) |
| Coal or Coke | 0 (0.0%) | 0 (0.0%) |
| All other Fuels | 0 (0.0%) | 0 (0.0%) |
| No Fuel Used | 14 (0.4%) | 0 (0.0%) |
| Total | 3,191 (100.0%) | 854 (100.0%) |
Household Vehicle Usage in Fairmount
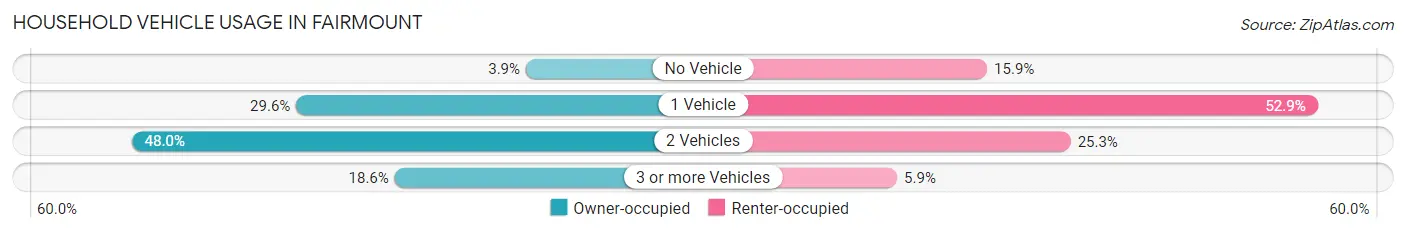
| Vehicles per Household | Owner-occupied | Renter-occupied |
| No Vehicle | 123 (3.8%) | 136 (15.9%) |
| 1 Vehicle | 944 (29.6%) | 452 (52.9%) |
| 2 Vehicles | 1,532 (48.0%) | 216 (25.3%) |
| 3 or more Vehicles | 592 (18.5%) | 50 (5.9%) |
| Total | 3,191 (100.0%) | 854 (100.0%) |
Real Estate & Mortgages in Fairmount
Real Estate and Mortgage Overview in Fairmount
| Characteristic | Without Mortgage | With Mortgage |
| Housing Units | 1,286 | 1,905 |
| Median Property Value | $149,700 | $168,300 |
| Median Household Income | $71,695 | $574 |
| Monthly Housing Costs | $581 | $3 |
| Real Estate Taxes | $4,093 | $34 |
Property Value by Mortgage Status in Fairmount
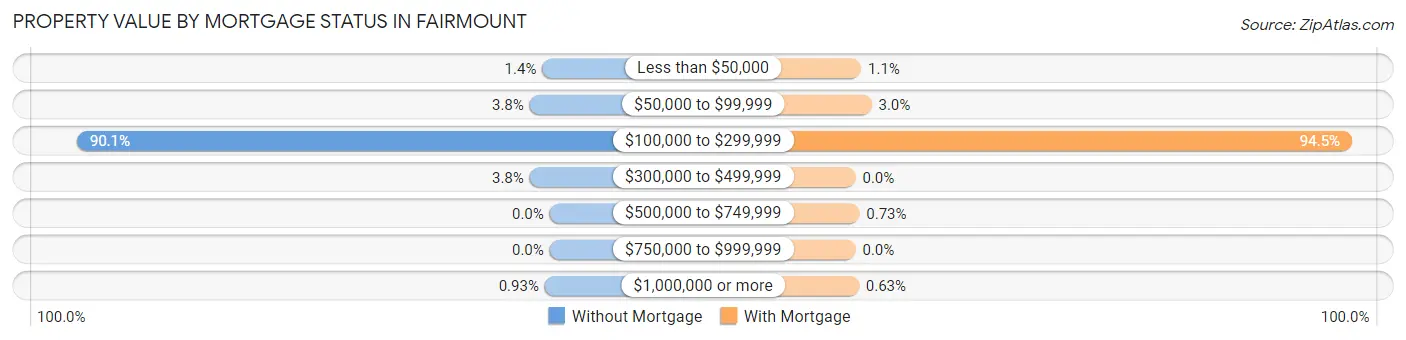
| Property Value | Without Mortgage | With Mortgage |
| Less than $50,000 | 18 (1.4%) | 20 (1.1%) |
| $50,000 to $99,999 | 49 (3.8%) | 58 (3.0%) |
| $100,000 to $299,999 | 1,158 (90.0%) | 1,801 (94.5%) |
| $300,000 to $499,999 | 49 (3.8%) | 0 (0.0%) |
| $500,000 to $749,999 | 0 (0.0%) | 14 (0.7%) |
| $750,000 to $999,999 | 0 (0.0%) | 0 (0.0%) |
| $1,000,000 or more | 12 (0.9%) | 12 (0.6%) |
| Total | 1,286 (100.0%) | 1,905 (100.0%) |
Household Income by Mortgage Status in Fairmount
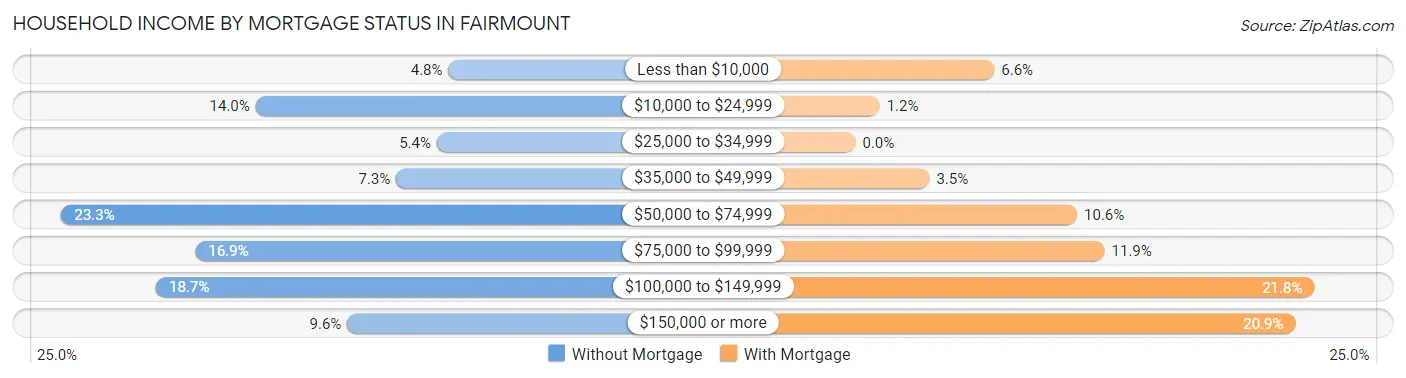
| Household Income | Without Mortgage | With Mortgage |
| Less than $10,000 | 62 (4.8%) | 126 (6.6%) |
| $10,000 to $24,999 | 180 (14.0%) | 22 (1.1%) |
| $25,000 to $34,999 | 69 (5.4%) | 0 (0.0%) |
| $35,000 to $49,999 | 94 (7.3%) | 67 (3.5%) |
| $50,000 to $74,999 | 299 (23.3%) | 201 (10.5%) |
| $75,000 to $99,999 | 217 (16.9%) | 226 (11.9%) |
| $100,000 to $149,999 | 241 (18.7%) | 416 (21.8%) |
| $150,000 or more | 124 (9.6%) | 399 (20.9%) |
| Total | 1,286 (100.0%) | 1,905 (100.0%) |
Property Value to Household Income Ratio in Fairmount
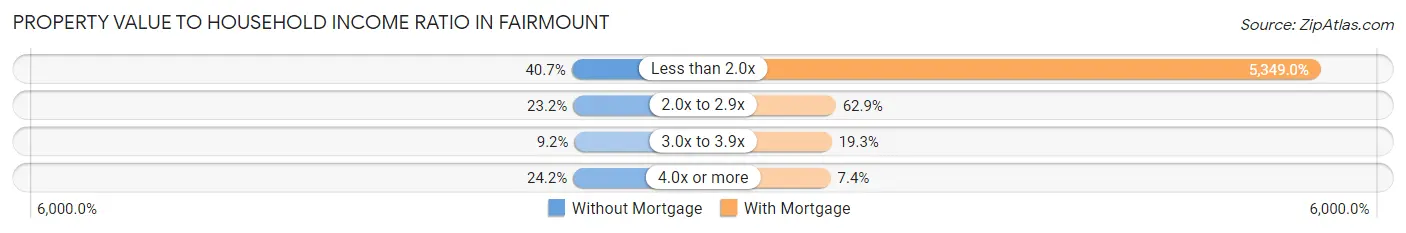
| Value-to-Income Ratio | Without Mortgage | With Mortgage |
| Less than 2.0x | 523 (40.7%) | 101,898 (5,349.0%) |
| 2.0x to 2.9x | 298 (23.2%) | 1,198 (62.9%) |
| 3.0x to 3.9x | 118 (9.2%) | 368 (19.3%) |
| 4.0x or more | 311 (24.2%) | 140 (7.3%) |
| Total | 1,286 (100.0%) | 1,905 (100.0%) |
Real Estate Taxes by Mortgage Status in Fairmount
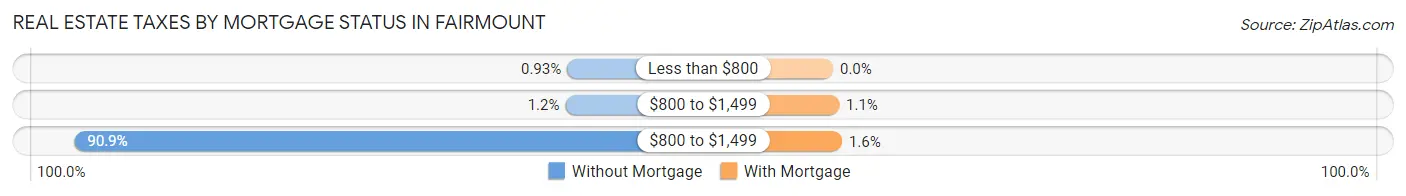
| Property Taxes | Without Mortgage | With Mortgage |
| Less than $800 | 12 (0.9%) | 0 (0.0%) |
| $800 to $1,499 | 16 (1.2%) | 21 (1.1%) |
| $800 to $1,499 | 1,169 (90.9%) | 31 (1.6%) |
| Total | 1,286 (100.0%) | 1,905 (100.0%) |
Health & Disability in Fairmount
Health Insurance Coverage by Age in Fairmount
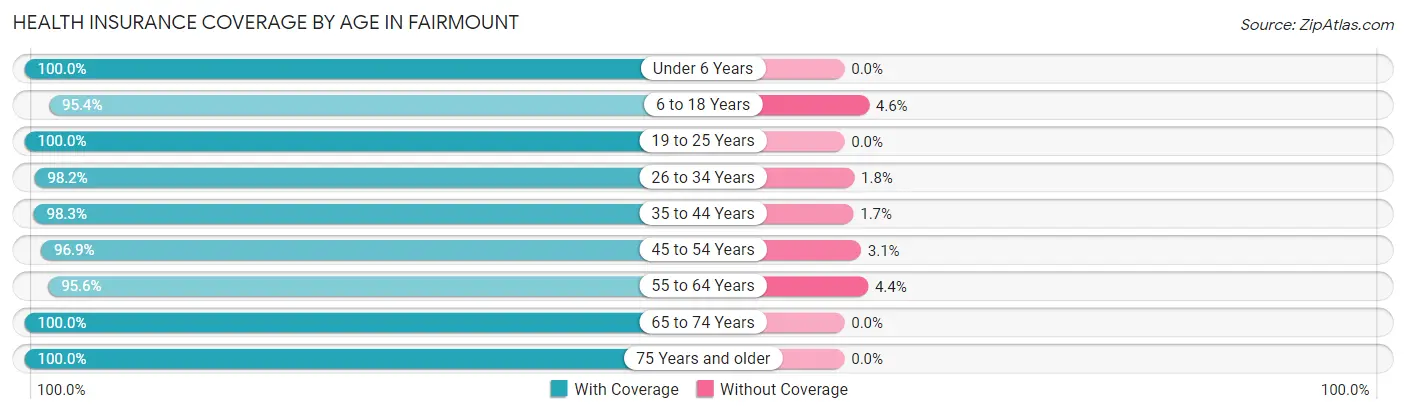
| Age Bracket | With Coverage | Without Coverage |
| Under 6 Years | 733 (100.0%) | 0 (0.0%) |
| 6 to 18 Years | 1,333 (95.4%) | 64 (4.6%) |
| 19 to 25 Years | 828 (100.0%) | 0 (0.0%) |
| 26 to 34 Years | 1,177 (98.2%) | 22 (1.8%) |
| 35 to 44 Years | 1,055 (98.3%) | 18 (1.7%) |
| 45 to 54 Years | 1,254 (96.9%) | 40 (3.1%) |
| 55 to 64 Years | 1,560 (95.6%) | 72 (4.4%) |
| 65 to 74 Years | 761 (100.0%) | 0 (0.0%) |
| 75 Years and older | 1,050 (100.0%) | 0 (0.0%) |
| Total | 9,751 (97.8%) | 216 (2.2%) |
Health Insurance Coverage by Citizenship Status in Fairmount
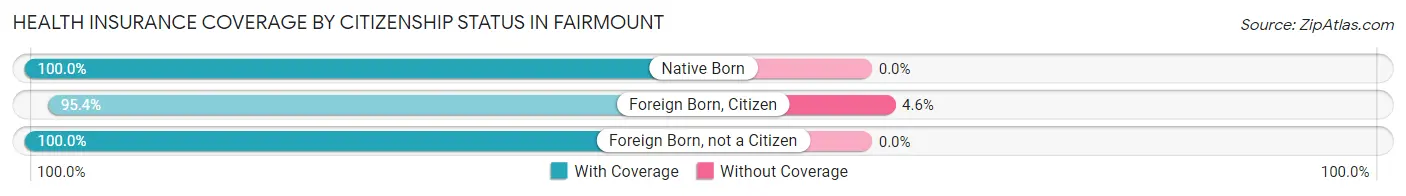
| Citizenship Status | With Coverage | Without Coverage |
| Native Born | 733 (100.0%) | 0 (0.0%) |
| Foreign Born, Citizen | 1,333 (95.4%) | 64 (4.6%) |
| Foreign Born, not a Citizen | 828 (100.0%) | 0 (0.0%) |
Health Insurance Coverage by Household Income in Fairmount
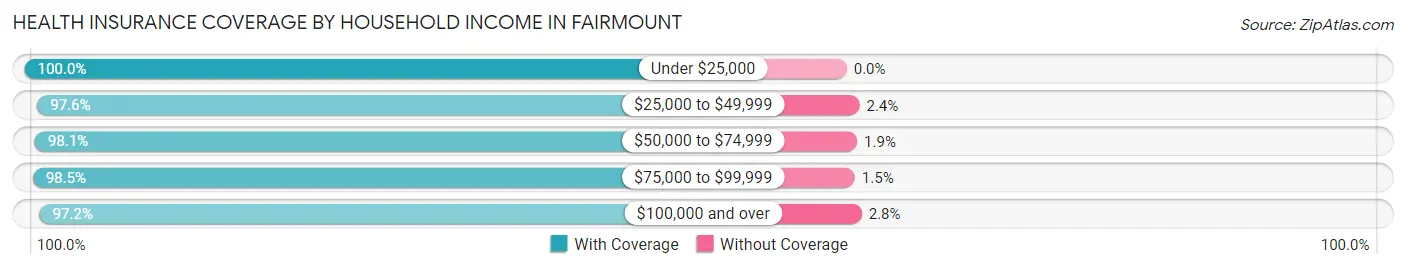
| Household Income | With Coverage | Without Coverage |
| Under $25,000 | 744 (100.0%) | 0 (0.0%) |
| $25,000 to $49,999 | 981 (97.6%) | 24 (2.4%) |
| $50,000 to $74,999 | 1,316 (98.1%) | 26 (1.9%) |
| $75,000 to $99,999 | 2,013 (98.5%) | 31 (1.5%) |
| $100,000 and over | 4,676 (97.2%) | 135 (2.8%) |
Public vs Private Health Insurance Coverage by Age in Fairmount
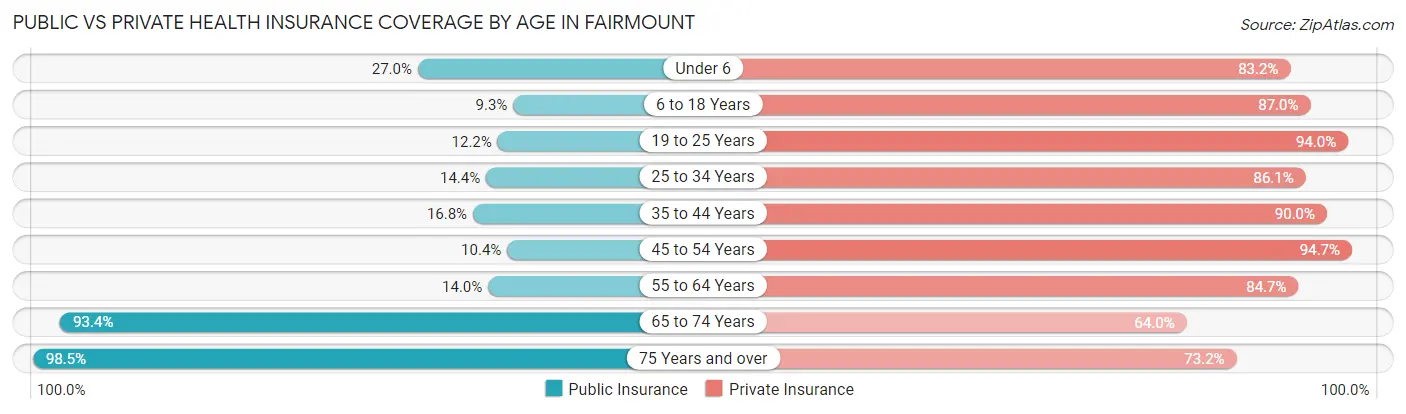
| Age Bracket | Public Insurance | Private Insurance |
| Under 6 | 198 (27.0%) | 610 (83.2%) |
| 6 to 18 Years | 130 (9.3%) | 1,215 (87.0%) |
| 19 to 25 Years | 101 (12.2%) | 778 (94.0%) |
| 25 to 34 Years | 172 (14.3%) | 1,032 (86.1%) |
| 35 to 44 Years | 180 (16.8%) | 966 (90.0%) |
| 45 to 54 Years | 135 (10.4%) | 1,225 (94.7%) |
| 55 to 64 Years | 228 (14.0%) | 1,383 (84.7%) |
| 65 to 74 Years | 711 (93.4%) | 487 (64.0%) |
| 75 Years and over | 1,034 (98.5%) | 769 (73.2%) |
| Total | 2,889 (29.0%) | 8,465 (84.9%) |
Disability Status by Sex by Age in Fairmount
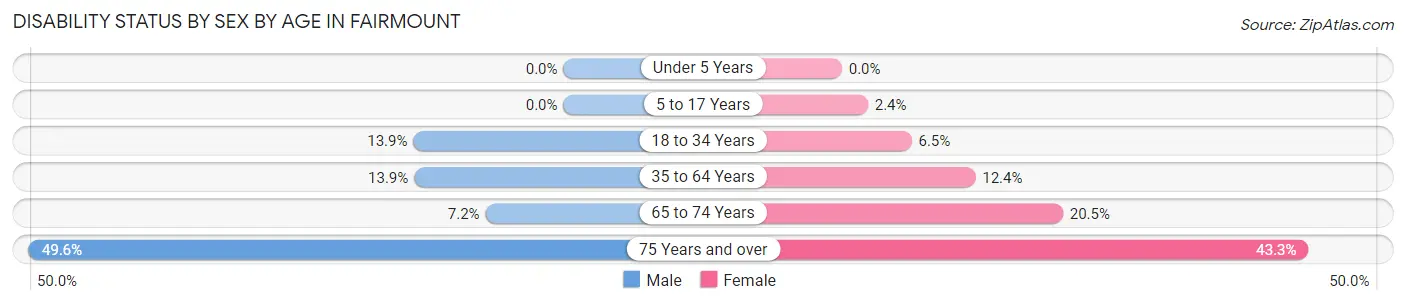
| Age Bracket | Male | Female |
| Under 5 Years | 0 (0.0%) | 0 (0.0%) |
| 5 to 17 Years | 0 (0.0%) | 13 (2.4%) |
| 18 to 34 Years | 145 (13.9%) | 74 (6.5%) |
| 35 to 64 Years | 261 (13.9%) | 262 (12.4%) |
| 65 to 74 Years | 24 (7.2%) | 88 (20.5%) |
| 75 Years and over | 247 (49.6%) | 239 (43.3%) |
Disability Class by Sex by Age in Fairmount
Disability Class: Hearing Difficulty
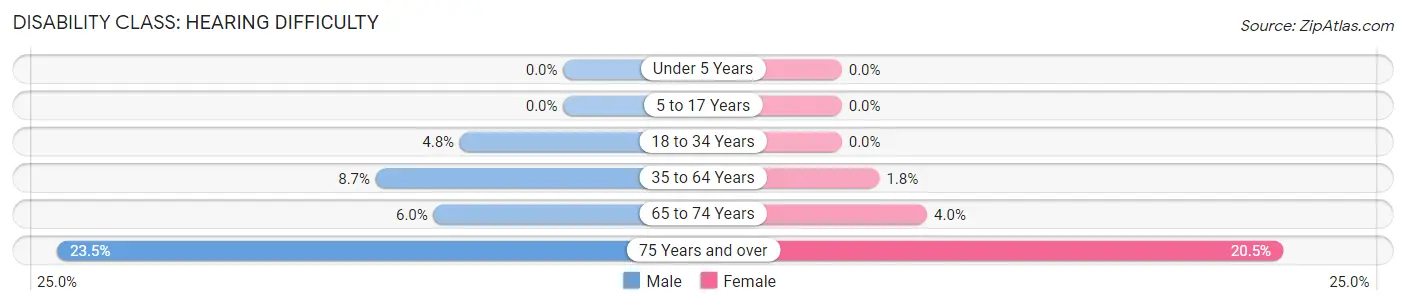
| Age Bracket | Male | Female |
| Under 5 Years | 0 (0.0%) | 0 (0.0%) |
| 5 to 17 Years | 0 (0.0%) | 0 (0.0%) |
| 18 to 34 Years | 50 (4.8%) | 0 (0.0%) |
| 35 to 64 Years | 164 (8.7%) | 37 (1.8%) |
| 65 to 74 Years | 20 (6.0%) | 17 (4.0%) |
| 75 Years and over | 117 (23.5%) | 113 (20.5%) |
Disability Class: Vision Difficulty
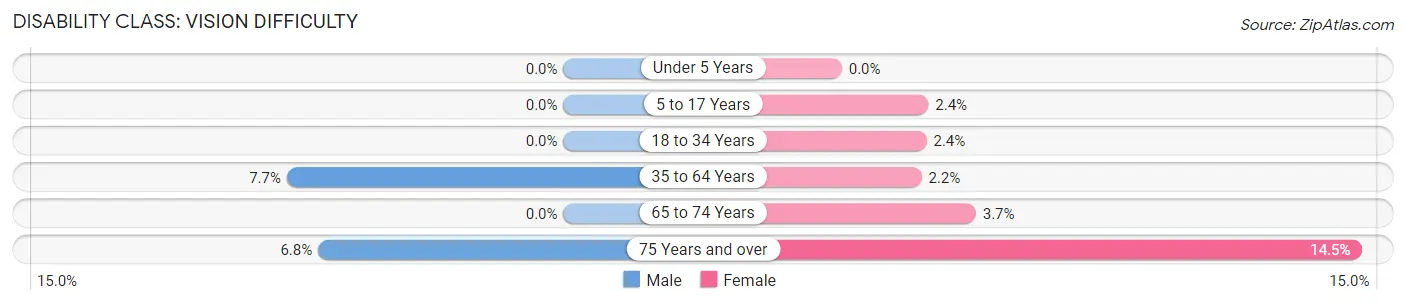
| Age Bracket | Male | Female |
| Under 5 Years | 0 (0.0%) | 0 (0.0%) |
| 5 to 17 Years | 0 (0.0%) | 13 (2.4%) |
| 18 to 34 Years | 0 (0.0%) | 27 (2.4%) |
| 35 to 64 Years | 145 (7.7%) | 47 (2.2%) |
| 65 to 74 Years | 0 (0.0%) | 16 (3.7%) |
| 75 Years and over | 34 (6.8%) | 80 (14.5%) |
Disability Class: Cognitive Difficulty
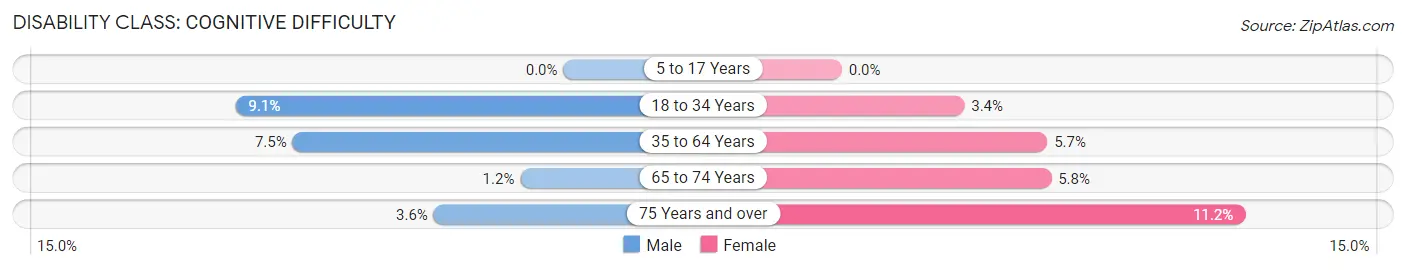
| Age Bracket | Male | Female |
| 5 to 17 Years | 0 (0.0%) | 0 (0.0%) |
| 18 to 34 Years | 95 (9.1%) | 39 (3.4%) |
| 35 to 64 Years | 142 (7.5%) | 121 (5.7%) |
| 65 to 74 Years | 4 (1.2%) | 25 (5.8%) |
| 75 Years and over | 18 (3.6%) | 62 (11.2%) |
Disability Class: Ambulatory Difficulty
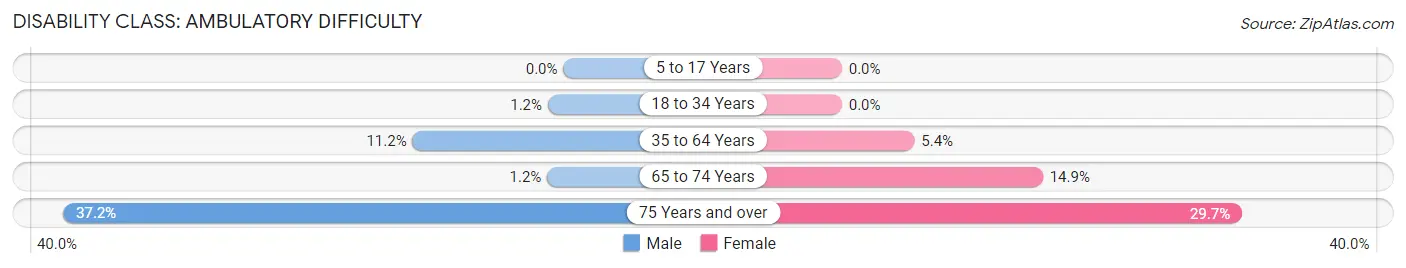
| Age Bracket | Male | Female |
| 5 to 17 Years | 0 (0.0%) | 0 (0.0%) |
| 18 to 34 Years | 12 (1.1%) | 0 (0.0%) |
| 35 to 64 Years | 211 (11.2%) | 114 (5.4%) |
| 65 to 74 Years | 4 (1.2%) | 64 (14.9%) |
| 75 Years and over | 185 (37.1%) | 164 (29.7%) |
Disability Class: Self-Care Difficulty
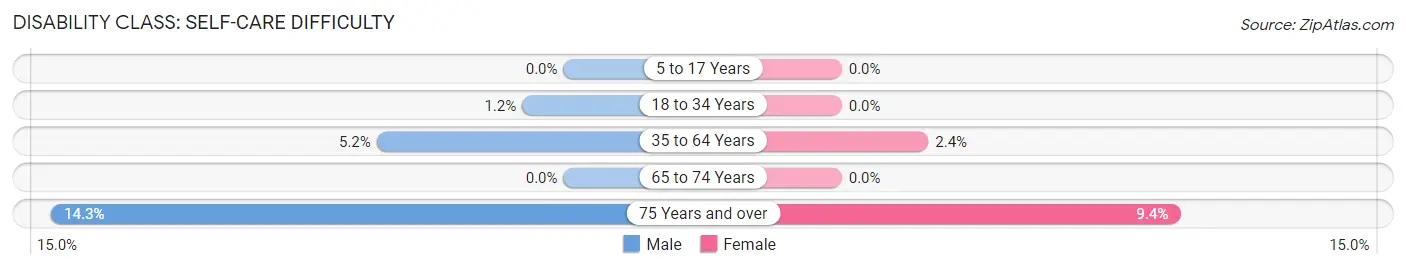
| Age Bracket | Male | Female |
| 5 to 17 Years | 0 (0.0%) | 0 (0.0%) |
| 18 to 34 Years | 12 (1.1%) | 0 (0.0%) |
| 35 to 64 Years | 98 (5.2%) | 51 (2.4%) |
| 65 to 74 Years | 0 (0.0%) | 0 (0.0%) |
| 75 Years and over | 71 (14.3%) | 52 (9.4%) |
Technology Access in Fairmount
Computing Device Access in Fairmount
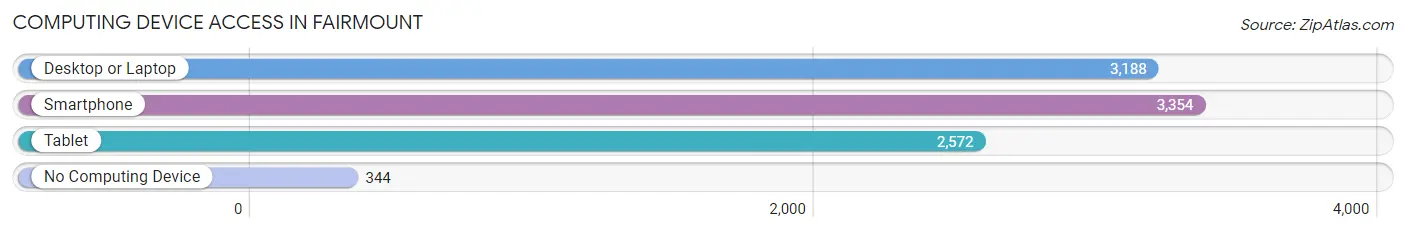
| Device Type | # Households | % Households |
| Desktop or Laptop | 3,188 | 78.8% |
| Smartphone | 3,354 | 82.9% |
| Tablet | 2,572 | 63.6% |
| No Computing Device | 344 | 8.5% |
| Total | 4,045 | 100.0% |
Internet Access in Fairmount
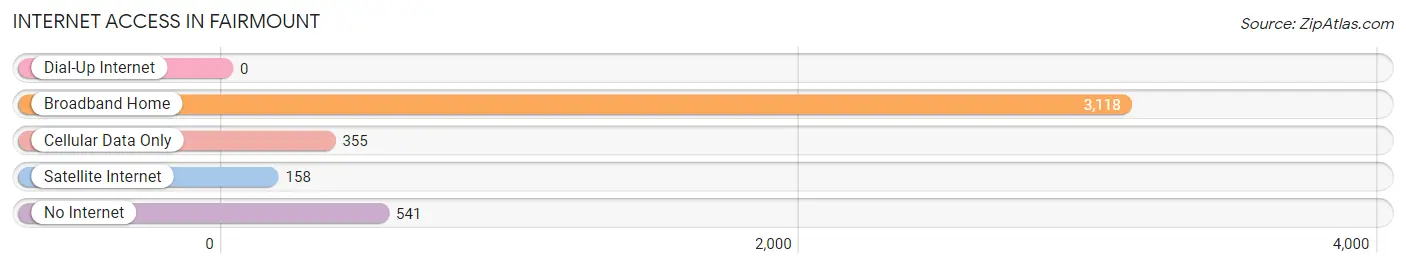
| Internet Type | # Households | % Households |
| Dial-Up Internet | 0 | 0.0% |
| Broadband Home | 3,118 | 77.1% |
| Cellular Data Only | 355 | 8.8% |
| Satellite Internet | 158 | 3.9% |
| No Internet | 541 | 13.4% |
| Total | 4,045 | 100.0% |
Fairmount Summary
History
The town of Fairmount, New York is located in the northern part of Onondaga County, in the Finger Lakes region of New York State. The town was first settled in 1794 by a group of settlers from Massachusetts, led by Captain John Fairmount. The town was originally known as Fairmount Township, and was later changed to the Town of Fairmount in 1817.
The town of Fairmount was an agricultural community for much of its history, with the main crops being wheat, corn, and hay. The town also had a number of small businesses, including a sawmill, a gristmill, and a tannery. The town was also home to a number of churches, including the First Congregational Church, which was founded in 1820.
In the late 19th century, the town of Fairmount began to experience a period of growth and development. The town was connected to the rest of the state by the Syracuse and Chenango Valley Railroad, which was completed in 1872. This allowed for the transportation of goods and people to and from the town. The town also saw the construction of a number of new businesses, including a brickyard, a cheese factory, and a canning factory.
In the early 20th century, the town of Fairmount continued to experience growth and development. The town was connected to the rest of the state by the New York State Thruway, which was completed in 1954. This allowed for the transportation of goods and people to and from the town. The town also saw the construction of a number of new businesses, including a lumber mill, a furniture factory, and a dairy.
Geography
The town of Fairmount is located in the northern part of Onondaga County, in the Finger Lakes region of New York State. The town is bordered by the towns of Lysander to the north, Clay to the east, Marcellus to the south, and Elbridge to the west. The town is located approximately 25 miles south of Syracuse, and is situated on the western edge of the Finger Lakes region.
The town of Fairmount is primarily rural in nature, with the majority of the land being used for agricultural purposes. The town is home to a number of small lakes, including Fairmount Lake, which is located in the center of the town. The town is also home to a number of small streams, including the Seneca River, which flows through the town.
Economy
The town of Fairmount is primarily an agricultural community, with the majority of the land being used for farming. The main crops grown in the town are wheat, corn, and hay. The town also has a number of small businesses, including a sawmill, a gristmill, and a tannery. The town is also home to a number of small manufacturing businesses, including a lumber mill, a furniture factory, and a dairy.
The town of Fairmount is also home to a number of tourist attractions, including the Fairmount Historical Museum, which is located in the center of the town. The museum features a number of exhibits on the history of the town, as well as a number of artifacts from the town’s past. The town is also home to a number of wineries, including the Fairmount Winery, which produces a variety of wines.
Demographics
The town of Fairmount has a population of approximately 2,500 people, according to the 2010 United States Census. The town has a median household income of $50,000, and the median age of the population is 43. The town is predominantly white, with approximately 95% of the population being white. The town also has a small Hispanic population, with approximately 3% of the population being Hispanic. The town also has a small African American population, with approximately 1% of the population being African American.
Common Questions
What is Per Capita Income in Fairmount?
Per Capita income in Fairmount is $39,852.
What is the Median Family Income in Fairmount?
Median Family Income in Fairmount is $93,911.
What is the Median Household income in Fairmount?
Median Household Income in Fairmount is $82,303.
What is Income or Wage Gap in Fairmount?
Income or Wage Gap in Fairmount is 8.1%.
Women in Fairmount earn 91.9 cents for every dollar earned by a man.
What is Family Income Deficit in Fairmount?
Family Income Deficit in Fairmount is $12,249.
Families that are below poverty line in Fairmount earn $12,249 less on average than the poverty threshold level.
What is Inequality or Gini Index in Fairmount?
Inequality or Gini Index in Fairmount is 0.37.
What is the Total Population of Fairmount?
Total Population of Fairmount is 9,978.
What is the Total Male Population of Fairmount?
Total Male Population of Fairmount is 4,866.
What is the Total Female Population of Fairmount?
Total Female Population of Fairmount is 5,112.
What is the Ratio of Males per 100 Females in Fairmount?
There are 95.19 Males per 100 Females in Fairmount.
What is the Ratio of Females per 100 Males in Fairmount?
There are 105.06 Females per 100 Males in Fairmount.
What is the Median Population Age in Fairmount?
Median Population Age in Fairmount is 42.3 Years.
What is the Average Family Size in Fairmount
Average Family Size in Fairmount is 3.0 People.
What is the Average Household Size in Fairmount
Average Household Size in Fairmount is 2.5 People.
How Large is the Labor Force in Fairmount?
There are 5,547 People in the Labor Forcein in Fairmount.
What is the Percentage of People in the Labor Force in Fairmount?
67.4% of People are in the Labor Force in Fairmount.
What is the Unemployment Rate in Fairmount?
Unemployment Rate in Fairmount is 2.5%.