Rye, NY Map & Demographics
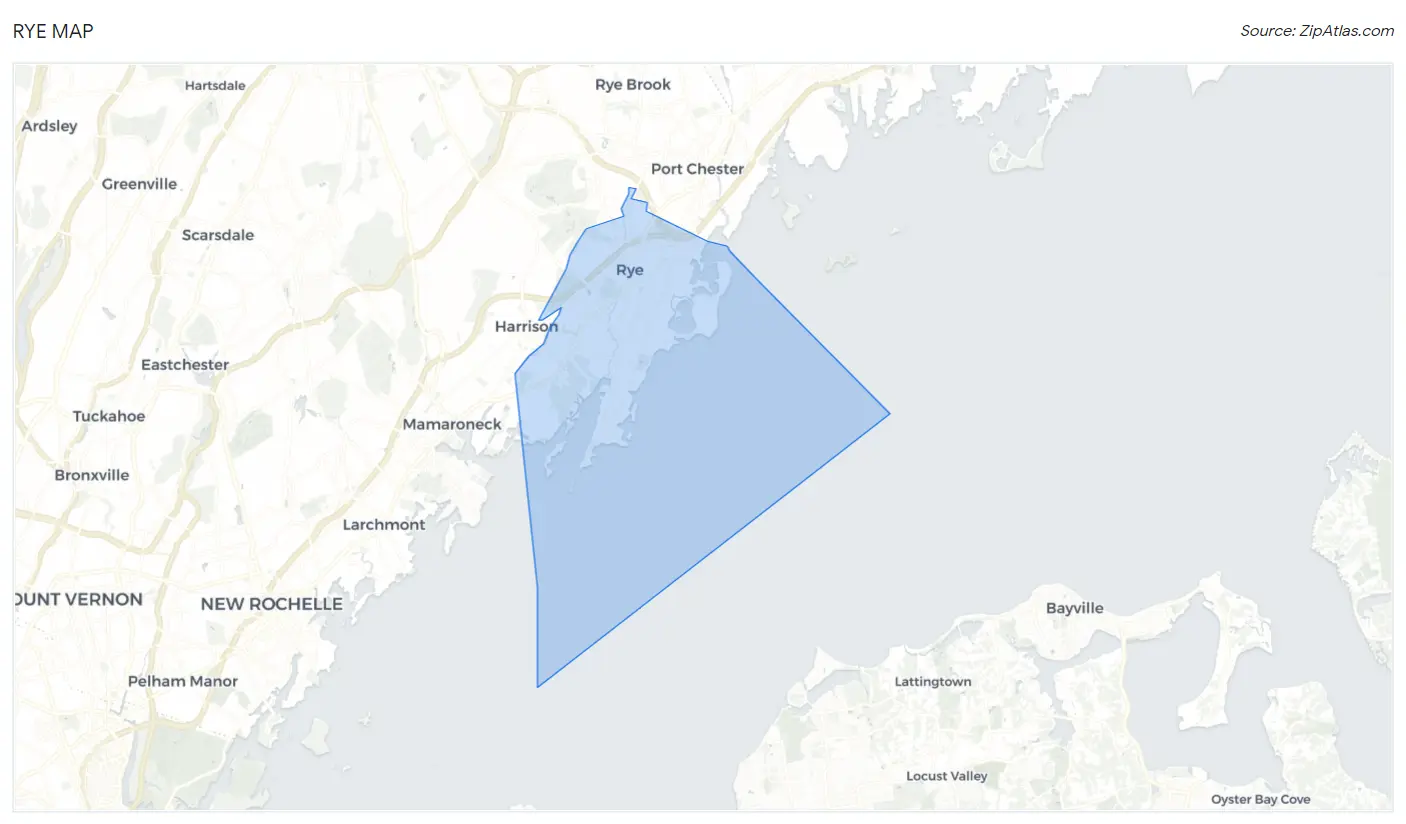
Rye Map
Rye Overview
$145,604
PER CAPITA INCOME
$250,001
AVG FAMILY INCOME
$227,565
AVG HOUSEHOLD INCOME
54.3%
WAGE / INCOME GAP [ % ]
45.7¢/ $1
WAGE / INCOME GAP [ $ ]
0.53
INEQUALITY / GINI INDEX
16,447
TOTAL POPULATION
8,188
MALE POPULATION
8,259
FEMALE POPULATION
99.14
MALES / 100 FEMALES
100.87
FEMALES / 100 MALES
42.2
MEDIAN AGE
3.3
AVG FAMILY SIZE
2.8
AVG HOUSEHOLD SIZE
7,992
LABOR FORCE [ PEOPLE ]
64.5%
PERCENT IN LABOR FORCE
5.2%
UNEMPLOYMENT RATE
Rye Zip Codes
Rye Area Codes
Income in Rye
Income Overview in Rye
Per Capita Income in Rye is $145,604, while median incomes of families and households are $250,001 and $227,565 respectively.
| Characteristic | Number | Measure |
| Per Capita Income | 16,447 | $145,604 |
| Median Family Income | 4,359 | $250,001 |
| Mean Family Income | 4,359 | $497,249 |
| Median Household Income | 5,880 | $227,565 |
| Mean Household Income | 5,880 | $405,074 |
| Income Deficit | 4,359 | $0 |
| Wage / Income Gap (%) | 16,447 | 54.33% |
| Wage / Income Gap ($) | 16,447 | 45.67¢ per $1 |
| Gini / Inequality Index | 16,447 | 0.53 |
Earnings by Sex in Rye
Average Earnings in Rye are $110,515, $173,265 for men and $79,124 for women, a difference of 54.3%.
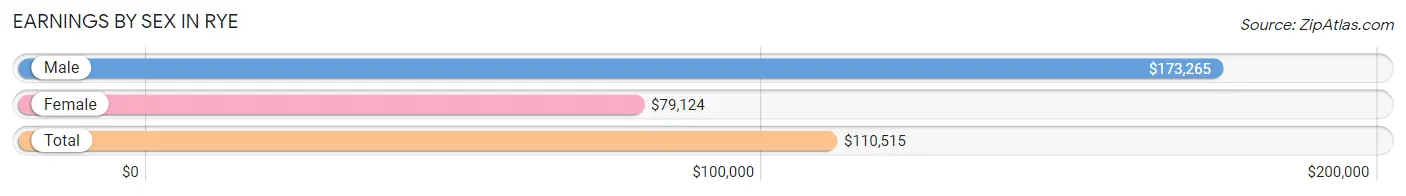
| Sex | Number | Average Earnings |
| Male | 4,552 (55.0%) | $173,265 |
| Female | 3,720 (45.0%) | $79,124 |
| Total | 8,272 (100.0%) | $110,515 |
Earnings by Sex by Income Bracket in Rye
The most common earnings brackets in Rye are $100,000+ for men (3,084 | 67.7%) and $100,000+ for women (1,340 | 36.0%).
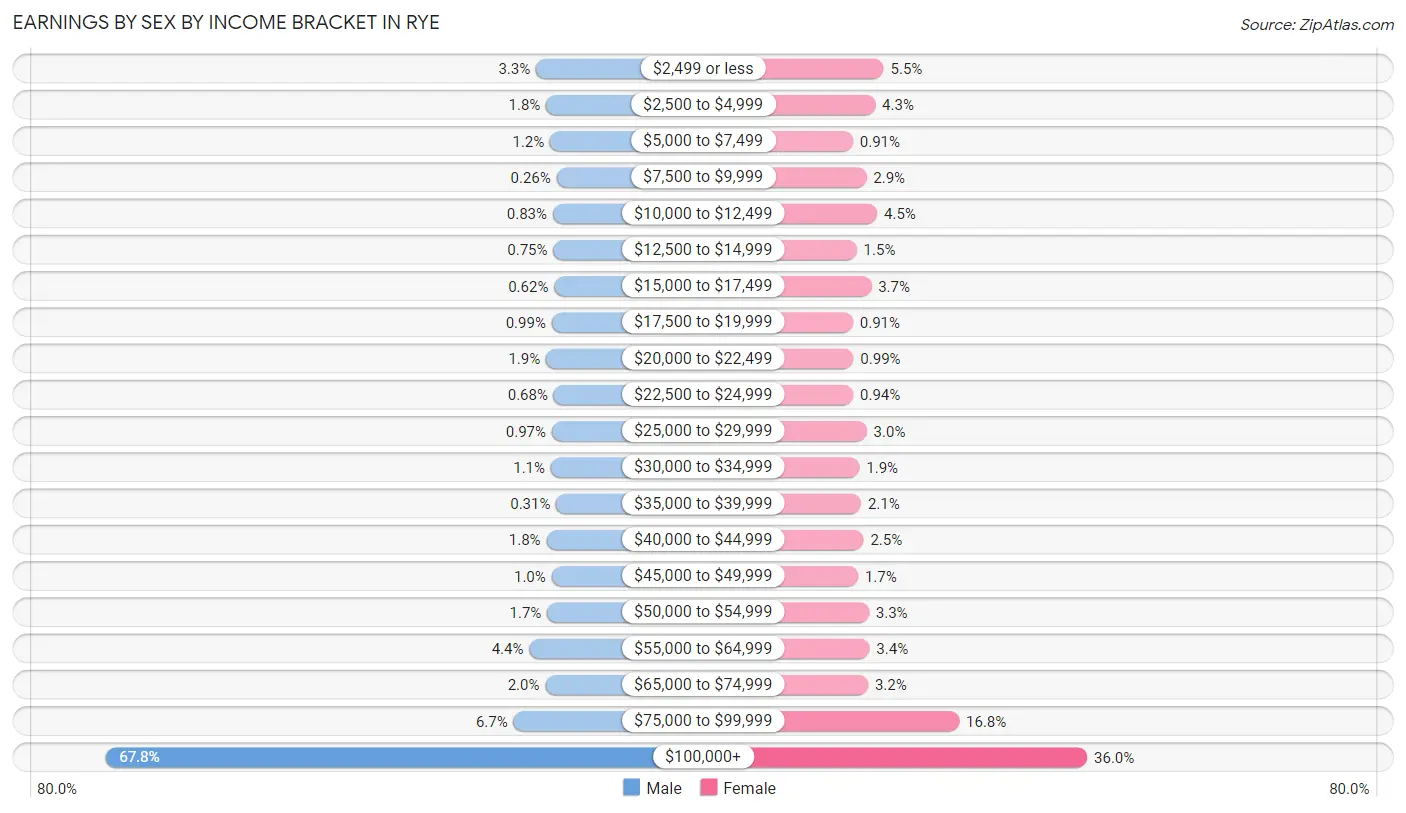
| Income | Male | Female |
| $2,499 or less | 152 (3.3%) | 205 (5.5%) |
| $2,500 to $4,999 | 83 (1.8%) | 158 (4.3%) |
| $5,000 to $7,499 | 56 (1.2%) | 34 (0.9%) |
| $7,500 to $9,999 | 12 (0.3%) | 109 (2.9%) |
| $10,000 to $12,499 | 38 (0.8%) | 169 (4.5%) |
| $12,500 to $14,999 | 34 (0.7%) | 55 (1.5%) |
| $15,000 to $17,499 | 28 (0.6%) | 136 (3.7%) |
| $17,500 to $19,999 | 45 (1.0%) | 34 (0.9%) |
| $20,000 to $22,499 | 84 (1.8%) | 37 (1.0%) |
| $22,500 to $24,999 | 31 (0.7%) | 35 (0.9%) |
| $25,000 to $29,999 | 44 (1.0%) | 111 (3.0%) |
| $30,000 to $34,999 | 51 (1.1%) | 70 (1.9%) |
| $35,000 to $39,999 | 14 (0.3%) | 79 (2.1%) |
| $40,000 to $44,999 | 81 (1.8%) | 93 (2.5%) |
| $45,000 to $49,999 | 46 (1.0%) | 62 (1.7%) |
| $50,000 to $54,999 | 76 (1.7%) | 123 (3.3%) |
| $55,000 to $64,999 | 198 (4.3%) | 126 (3.4%) |
| $65,000 to $74,999 | 89 (2.0%) | 118 (3.2%) |
| $75,000 to $99,999 | 306 (6.7%) | 626 (16.8%) |
| $100,000+ | 3,084 (67.7%) | 1,340 (36.0%) |
| Total | 4,552 (100.0%) | 3,720 (100.0%) |
Earnings by Sex by Educational Attainment in Rye
Average earnings in Rye are $218,456 for men and $86,132 for women, a difference of 60.6%. Men with an educational attainment of graduate degree enjoy the highest average annual earnings of $250,001, while those with high school diploma education earn the least with $69,043. Women with an educational attainment of graduate degree earn the most with the average annual earnings of $97,857, while those with high school diploma education have the smallest earnings of $34,464.
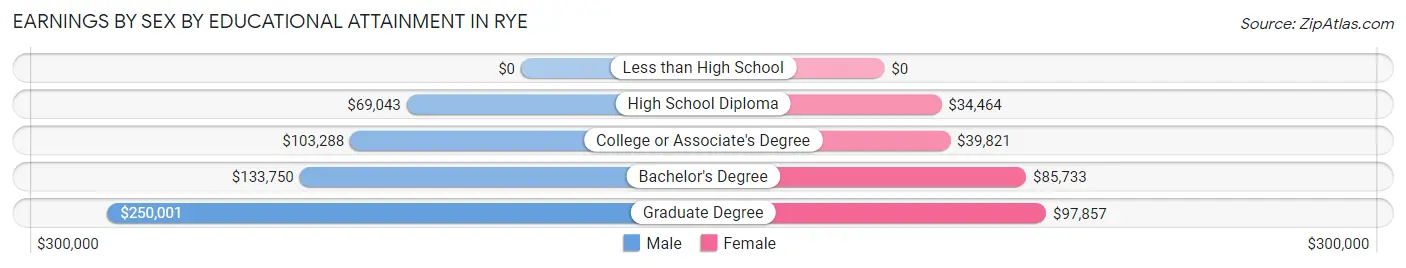
| Educational Attainment | Male Income | Female Income |
| Less than High School | - | - |
| High School Diploma | $69,043 | $34,464 |
| College or Associate's Degree | $103,288 | $39,821 |
| Bachelor's Degree | $133,750 | $85,733 |
| Graduate Degree | $250,001 | $97,857 |
| Total | $218,456 | $86,132 |
Family Income in Rye
Family Income Brackets in Rye
According to the Rye family income data, there are 2,977 families falling into the $200,000+ income range, which is the most common income bracket and makes up 68.3% of all families.
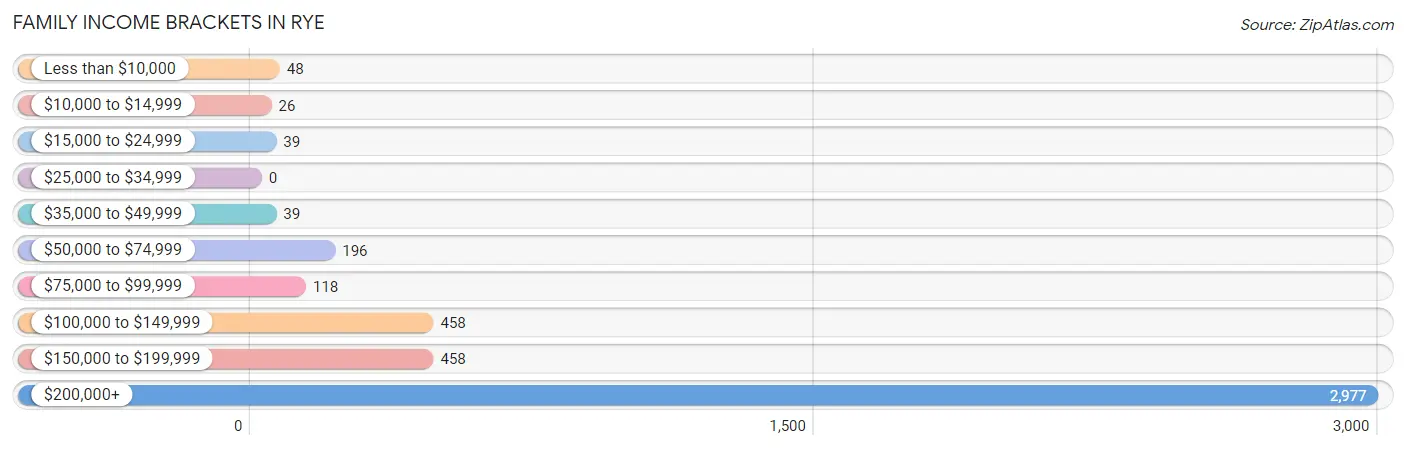
| Income Bracket | # Families | % Families |
| Less than $10,000 | 48 | 1.1% |
| $10,000 to $14,999 | 26 | 0.6% |
| $15,000 to $24,999 | 39 | 0.9% |
| $25,000 to $34,999 | 0 | 0.0% |
| $35,000 to $49,999 | 39 | 0.9% |
| $50,000 to $74,999 | 196 | 4.5% |
| $75,000 to $99,999 | 118 | 2.7% |
| $100,000 to $149,999 | 458 | 10.5% |
| $150,000 to $199,999 | 458 | 10.5% |
| $200,000+ | 2,977 | 68.3% |
Family Income by Famaliy Size in Rye
4-person families (1,239 | 28.4%) account for the highest median family income in Rye with $250,001 per family, while 2-person families (1,268 | 29.1%) have the highest median income of $94,954 per family member.
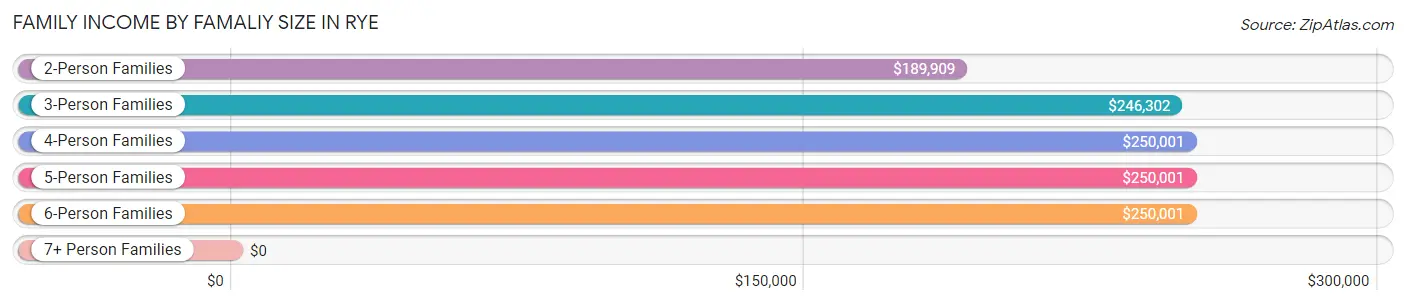
| Income Bracket | # Families | Median Income |
| 2-Person Families | 1,268 (29.1%) | $189,909 |
| 3-Person Families | 997 (22.9%) | $246,302 |
| 4-Person Families | 1,239 (28.4%) | $250,001 |
| 5-Person Families | 725 (16.6%) | $250,001 |
| 6-Person Families | 112 (2.6%) | $250,001 |
| 7+ Person Families | 18 (0.4%) | $0 |
| Total | 4,359 (100.0%) | $250,001 |
Family Income by Number of Earners in Rye
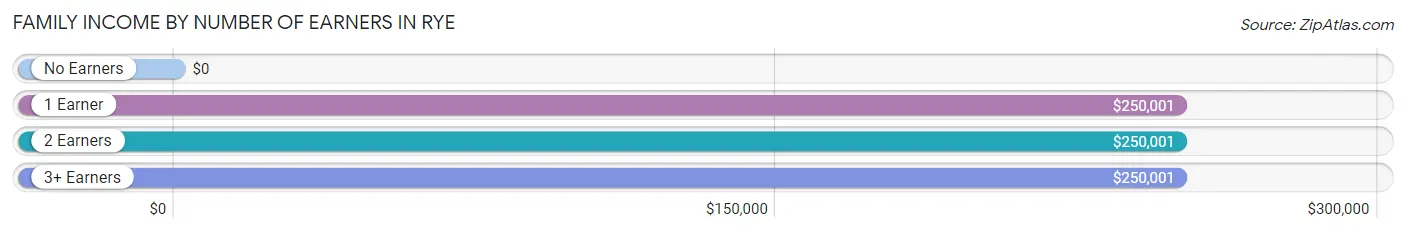
| Number of Earners | # Families | Median Income |
| No Earners | 301 (6.9%) | $0 |
| 1 Earner | 1,563 (35.9%) | $250,001 |
| 2 Earners | 2,109 (48.4%) | $250,001 |
| 3+ Earners | 386 (8.9%) | $250,001 |
| Total | 4,359 (100.0%) | $250,001 |
Household Income in Rye
Household Income Brackets in Rye
With 3,216 households falling in the category, the $200,000+ income range is the most frequent in Rye, accounting for 54.7% of all households. In contrast, only 35 households (0.6%) fall into the $10,000 to $14,999 income bracket, making it the least populous group.
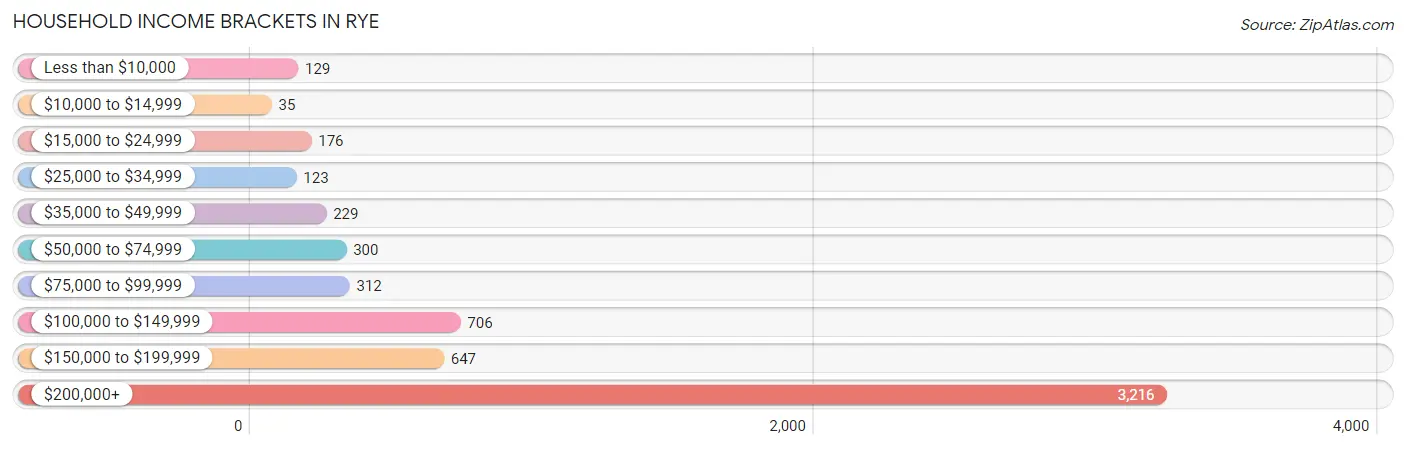
| Income Bracket | # Households | % Households |
| Less than $10,000 | 129 | 2.2% |
| $10,000 to $14,999 | 35 | 0.6% |
| $15,000 to $24,999 | 176 | 3.0% |
| $25,000 to $34,999 | 123 | 2.1% |
| $35,000 to $49,999 | 229 | 3.9% |
| $50,000 to $74,999 | 300 | 5.1% |
| $75,000 to $99,999 | 312 | 5.3% |
| $100,000 to $149,999 | 706 | 12.0% |
| $150,000 to $199,999 | 647 | 11.0% |
| $200,000+ | 3,216 | 54.7% |
Household Income by Householder Age in Rye
The median household income in Rye is $227,565, with the highest median household income of $250,001 found in the 25 to 44 years age bracket for the primary householder. A total of 1,427 households (24.3%) fall into this category. Meanwhile, the 15 to 24 years age bracket for the primary householder has the lowest median household income of $0, with 32 households (0.5%) in this group.
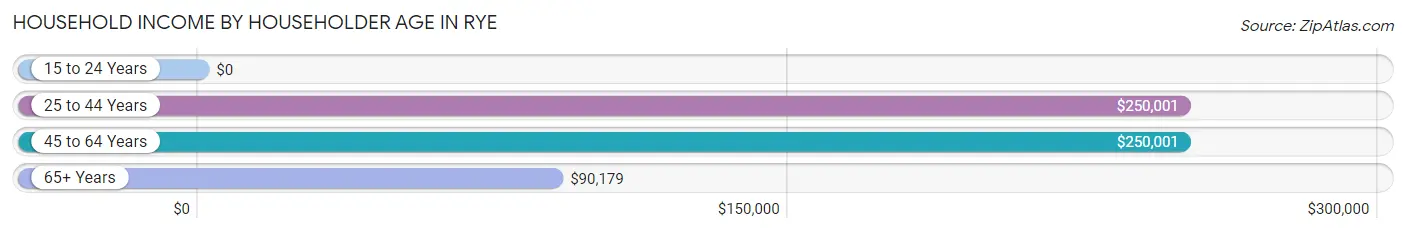
| Income Bracket | # Households | Median Income |
| 15 to 24 Years | 32 (0.5%) | $0 |
| 25 to 44 Years | 1,427 (24.3%) | $250,001 |
| 45 to 64 Years | 2,854 (48.5%) | $250,001 |
| 65+ Years | 1,567 (26.7%) | $90,179 |
| Total | 5,880 (100.0%) | $227,565 |
Poverty in Rye
Income Below Poverty by Sex and Age in Rye
With 2.7% poverty level for males and 3.2% for females among the residents of Rye, 75 year old and over males and 18 to 24 year old females are the most vulnerable to poverty, with 70 males (14.8%) and 52 females (12.3%) in their respective age groups living below the poverty level.
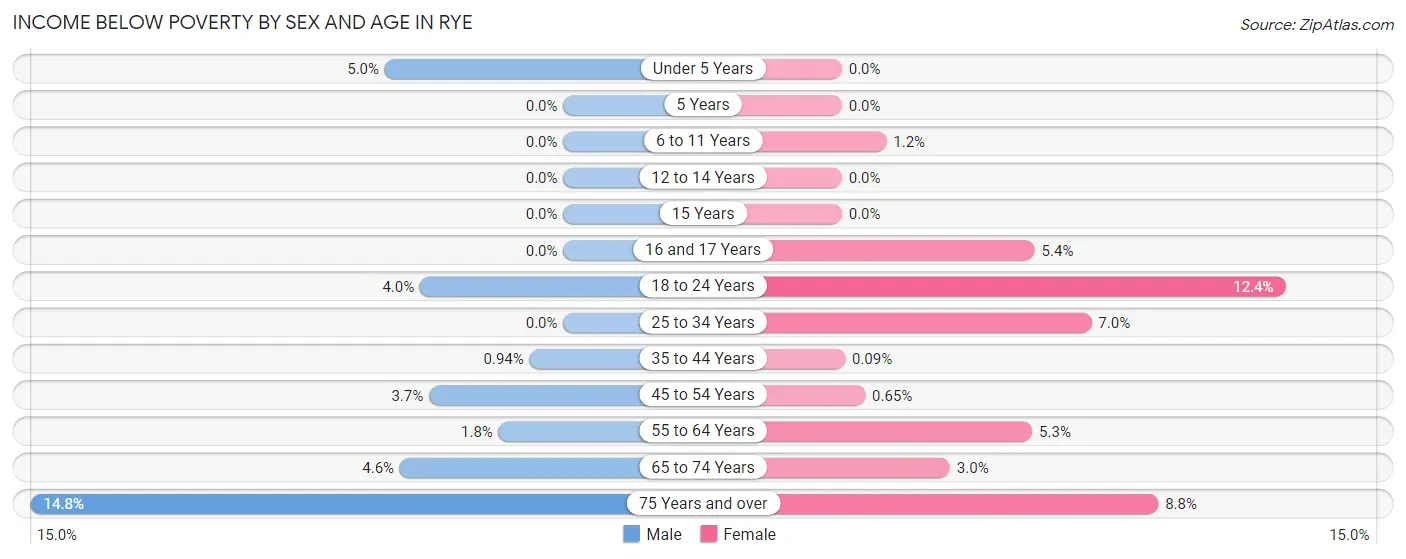
| Age Bracket | Male | Female |
| Under 5 Years | 19 (5.0%) | 0 (0.0%) |
| 5 Years | 0 (0.0%) | 0 (0.0%) |
| 6 to 11 Years | 0 (0.0%) | 11 (1.2%) |
| 12 to 14 Years | 0 (0.0%) | 0 (0.0%) |
| 15 Years | 0 (0.0%) | 0 (0.0%) |
| 16 and 17 Years | 0 (0.0%) | 23 (5.4%) |
| 18 to 24 Years | 28 (4.0%) | 52 (12.3%) |
| 25 to 34 Years | 0 (0.0%) | 23 (7.0%) |
| 35 to 44 Years | 11 (0.9%) | 1 (0.1%) |
| 45 to 54 Years | 52 (3.7%) | 10 (0.6%) |
| 55 to 64 Years | 19 (1.8%) | 50 (5.3%) |
| 65 to 74 Years | 20 (4.5%) | 19 (3.0%) |
| 75 Years and over | 70 (14.8%) | 71 (8.8%) |
| Total | 219 (2.7%) | 260 (3.2%) |
Income Above Poverty by Sex and Age in Rye
According to the poverty statistics in Rye, males aged 5 years and females aged under 5 years are the age groups that are most secure financially, with 100.0% of males and 100.0% of females in these age groups living above the poverty line.
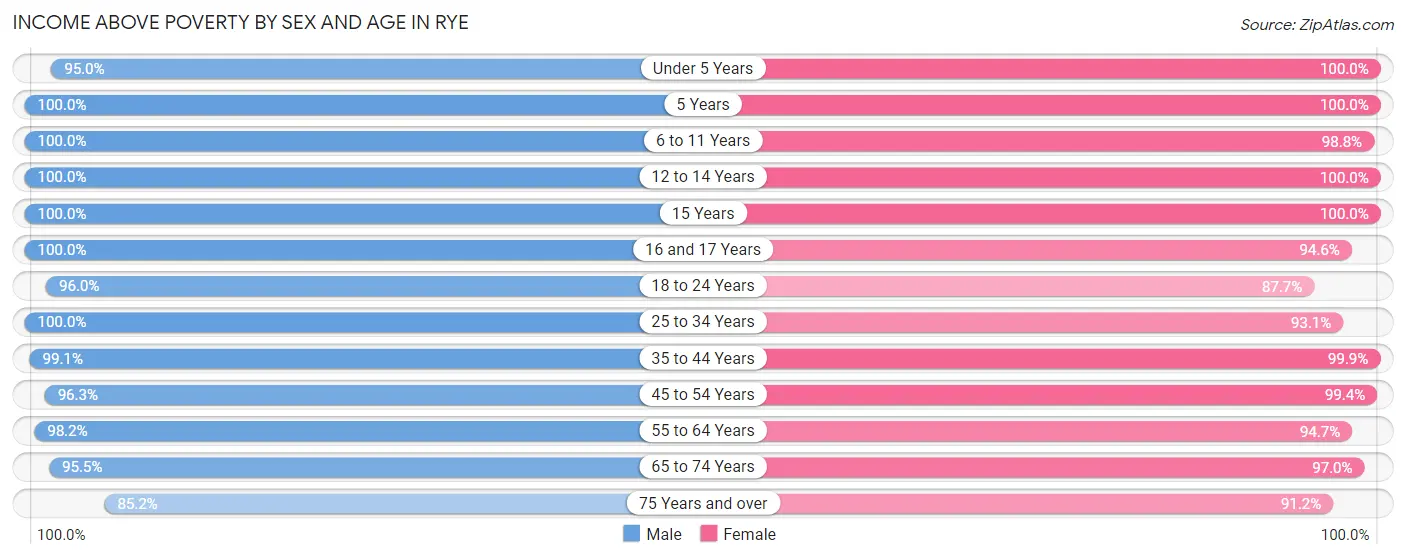
| Age Bracket | Male | Female |
| Under 5 Years | 363 (95.0%) | 287 (100.0%) |
| 5 Years | 154 (100.0%) | 144 (100.0%) |
| 6 to 11 Years | 881 (100.0%) | 878 (98.8%) |
| 12 to 14 Years | 516 (100.0%) | 459 (100.0%) |
| 15 Years | 160 (100.0%) | 128 (100.0%) |
| 16 and 17 Years | 335 (100.0%) | 405 (94.6%) |
| 18 to 24 Years | 673 (96.0%) | 369 (87.6%) |
| 25 to 34 Years | 439 (100.0%) | 308 (93.0%) |
| 35 to 44 Years | 1,164 (99.1%) | 1,168 (99.9%) |
| 45 to 54 Years | 1,340 (96.3%) | 1,531 (99.4%) |
| 55 to 64 Years | 1,038 (98.2%) | 893 (94.7%) |
| 65 to 74 Years | 420 (95.5%) | 612 (97.0%) |
| 75 Years and over | 402 (85.2%) | 735 (91.2%) |
| Total | 7,885 (97.3%) | 7,917 (96.8%) |
Income Below Poverty Among Married-Couple Families in Rye
The poverty statistics for married-couple families in Rye show that 1.7% or 67 of the total 3,951 families live below the poverty line. Families with no children have the highest poverty rate of 2.3%, comprising of 34 families. On the other hand, families with 5 or more children have the lowest poverty rate of 0.0%, which includes 0 families.
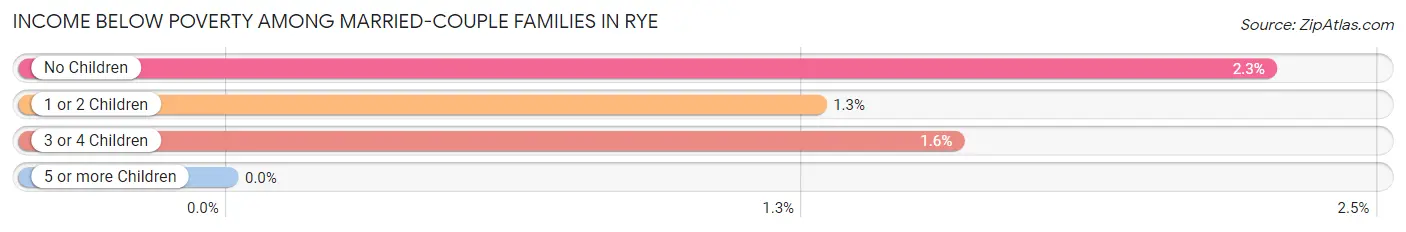
| Children | Above Poverty | Below Poverty |
| No Children | 1,473 (97.7%) | 34 (2.3%) |
| 1 or 2 Children | 1,770 (98.7%) | 23 (1.3%) |
| 3 or 4 Children | 623 (98.4%) | 10 (1.6%) |
| 5 or more Children | 18 (100.0%) | 0 (0.0%) |
| Total | 3,884 (98.3%) | 67 (1.7%) |
Income Below Poverty Among Single-Parent Households in Rye
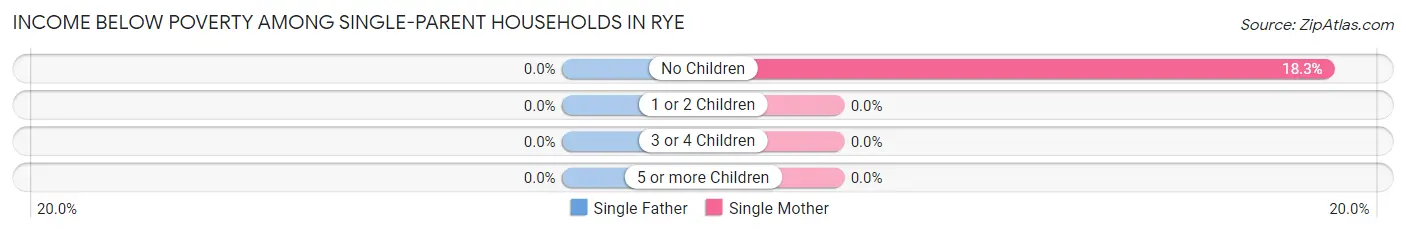
| Children | Single Father | Single Mother |
| No Children | 0 (0.0%) | 17 (18.3%) |
| 1 or 2 Children | 0 (0.0%) | 0 (0.0%) |
| 3 or 4 Children | 0 (0.0%) | 0 (0.0%) |
| 5 or more Children | 0 (0.0%) | 0 (0.0%) |
| Total | 0 (0.0%) | 17 (5.8%) |
Income Below Poverty Among Married-Couple vs Single-Parent Households in Rye
The poverty data for Rye shows that 67 of the married-couple family households (1.7%) and 17 of the single-parent households (4.2%) are living below the poverty level. Within the married-couple family households, those with no children have the highest poverty rate, with 34 households (2.3%) falling below the poverty line. Among the single-parent households, those with no children have the highest poverty rate, with 17 household (16.8%) living below poverty.
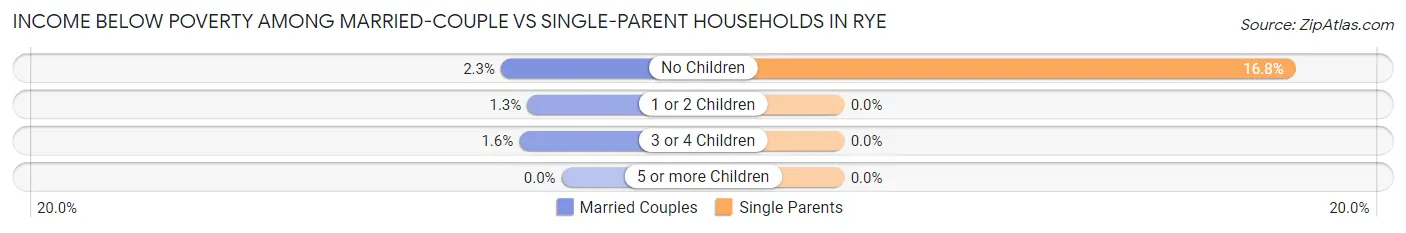
| Children | Married-Couple Families | Single-Parent Households |
| No Children | 34 (2.3%) | 17 (16.8%) |
| 1 or 2 Children | 23 (1.3%) | 0 (0.0%) |
| 3 or 4 Children | 10 (1.6%) | 0 (0.0%) |
| 5 or more Children | 0 (0.0%) | 0 (0.0%) |
| Total | 67 (1.7%) | 17 (4.2%) |
Race in Rye
The most populous races in Rye are White / Caucasian (13,105 | 79.7%), Two or more Races (1,423 | 8.6%), and Hispanic or Latino (1,259 | 7.6%).
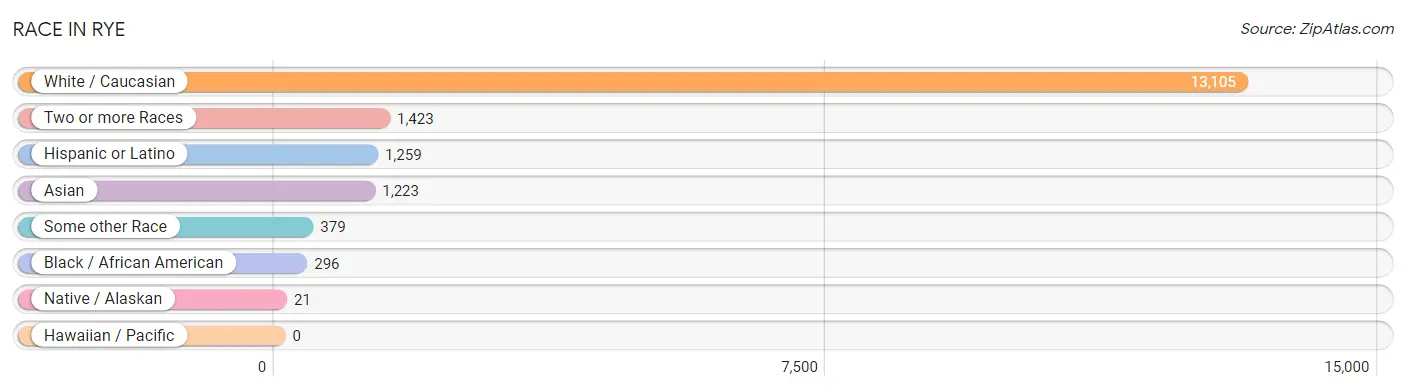
| Race | # Population | % Population |
| Asian | 1,223 | 7.4% |
| Black / African American | 296 | 1.8% |
| Hawaiian / Pacific | 0 | 0.0% |
| Hispanic or Latino | 1,259 | 7.6% |
| Native / Alaskan | 21 | 0.1% |
| White / Caucasian | 13,105 | 79.7% |
| Two or more Races | 1,423 | 8.6% |
| Some other Race | 379 | 2.3% |
| Total | 16,447 | 100.0% |
Ancestry in Rye
The most populous ancestries reported in Rye are Irish (3,375 | 20.5%), German (2,058 | 12.5%), Italian (1,860 | 11.3%), English (1,212 | 7.4%), and American (842 | 5.1%), together accounting for 56.8% of all Rye residents.
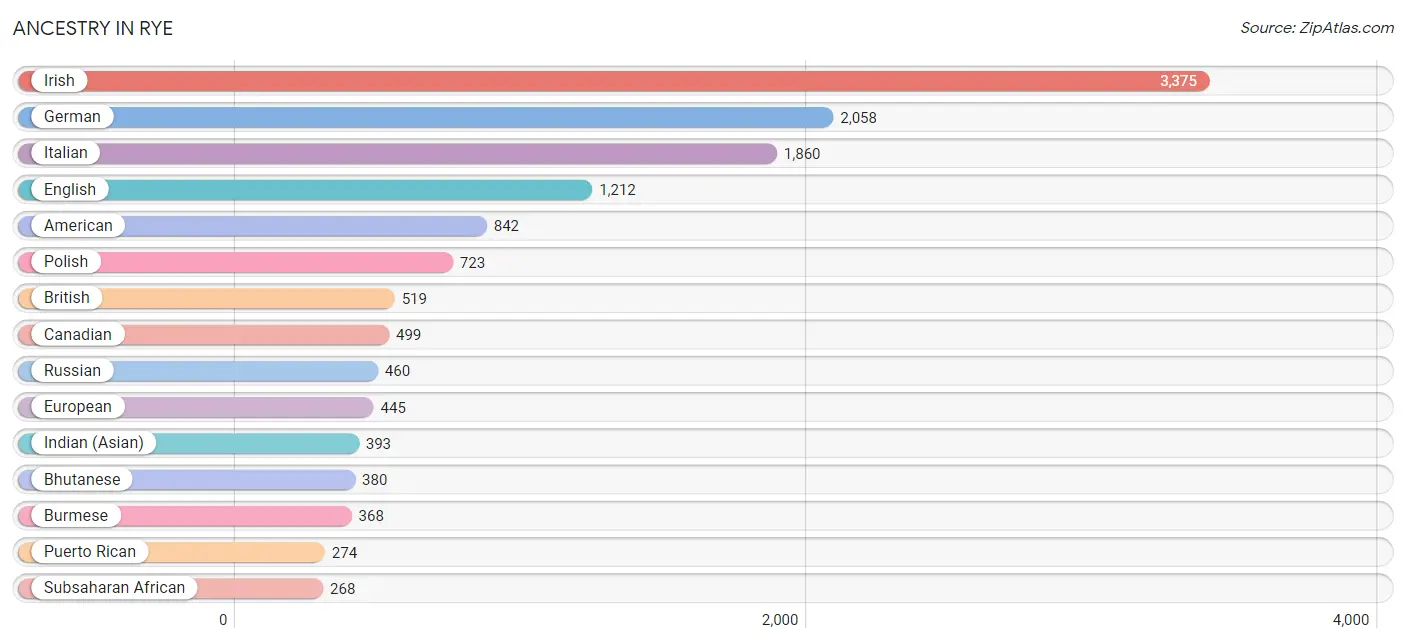
| Ancestry | # Population | % Population |
| African | 8 | 0.1% |
| Albanian | 31 | 0.2% |
| American | 842 | 5.1% |
| Arab | 252 | 1.5% |
| Argentinean | 44 | 0.3% |
| Armenian | 150 | 0.9% |
| Australian | 73 | 0.4% |
| Austrian | 102 | 0.6% |
| Belgian | 41 | 0.3% |
| Bhutanese | 380 | 2.3% |
| Brazilian | 157 | 0.9% |
| British | 519 | 3.2% |
| Bulgarian | 8 | 0.1% |
| Burmese | 368 | 2.2% |
| Canadian | 499 | 3.0% |
| Central American | 262 | 1.6% |
| Central American Indian | 55 | 0.3% |
| Colombian | 15 | 0.1% |
| Croatian | 7 | 0.0% |
| Cuban | 41 | 0.3% |
| Czech | 19 | 0.1% |
| Czechoslovakian | 7 | 0.0% |
| Danish | 6 | 0.0% |
| Dominican | 121 | 0.7% |
| Dutch | 200 | 1.2% |
| Eastern European | 246 | 1.5% |
| Ecuadorian | 6 | 0.0% |
| Egyptian | 158 | 1.0% |
| English | 1,212 | 7.4% |
| European | 445 | 2.7% |
| Filipino | 41 | 0.3% |
| Finnish | 61 | 0.4% |
| French | 207 | 1.3% |
| French Canadian | 10 | 0.1% |
| German | 2,058 | 12.5% |
| Ghanaian | 60 | 0.4% |
| Greek | 54 | 0.3% |
| Haitian | 12 | 0.1% |
| Hungarian | 220 | 1.3% |
| Indian (Asian) | 393 | 2.4% |
| Indonesian | 11 | 0.1% |
| Iranian | 24 | 0.2% |
| Irish | 3,375 | 20.5% |
| Iroquois | 21 | 0.1% |
| Israeli | 65 | 0.4% |
| Italian | 1,860 | 11.3% |
| Jamaican | 1 | 0.0% |
| Korean | 76 | 0.5% |
| Latvian | 10 | 0.1% |
| Lebanese | 67 | 0.4% |
| Lithuanian | 123 | 0.7% |
| Mexican | 116 | 0.7% |
| Moroccan | 27 | 0.2% |
| Native Hawaiian | 46 | 0.3% |
| Nigerian | 82 | 0.5% |
| Northern European | 98 | 0.6% |
| Norwegian | 75 | 0.5% |
| Okinawan | 198 | 1.2% |
| Pakistani | 14 | 0.1% |
| Panamanian | 211 | 1.3% |
| Pennsylvania German | 4 | 0.0% |
| Polish | 723 | 4.4% |
| Portuguese | 33 | 0.2% |
| Puerto Rican | 274 | 1.7% |
| Romanian | 76 | 0.5% |
| Russian | 460 | 2.8% |
| Salvadoran | 51 | 0.3% |
| Scandinavian | 59 | 0.4% |
| Scotch-Irish | 131 | 0.8% |
| Scottish | 265 | 1.6% |
| Serbian | 72 | 0.4% |
| Slovak | 66 | 0.4% |
| Slovene | 24 | 0.2% |
| South African | 83 | 0.5% |
| South American | 127 | 0.8% |
| South American Indian | 7 | 0.0% |
| Spaniard | 210 | 1.3% |
| Spanish | 91 | 0.5% |
| Subsaharan African | 268 | 1.6% |
| Swedish | 160 | 1.0% |
| Swiss | 188 | 1.1% |
| Thai | 120 | 0.7% |
| Turkish | 128 | 0.8% |
| Ukrainian | 143 | 0.9% |
| Uruguayan | 23 | 0.1% |
| Venezuelan | 39 | 0.2% |
| Vietnamese | 150 | 0.9% |
| Welsh | 8 | 0.1% |
| Yugoslavian | 7 | 0.0% | View All 89 Rows |
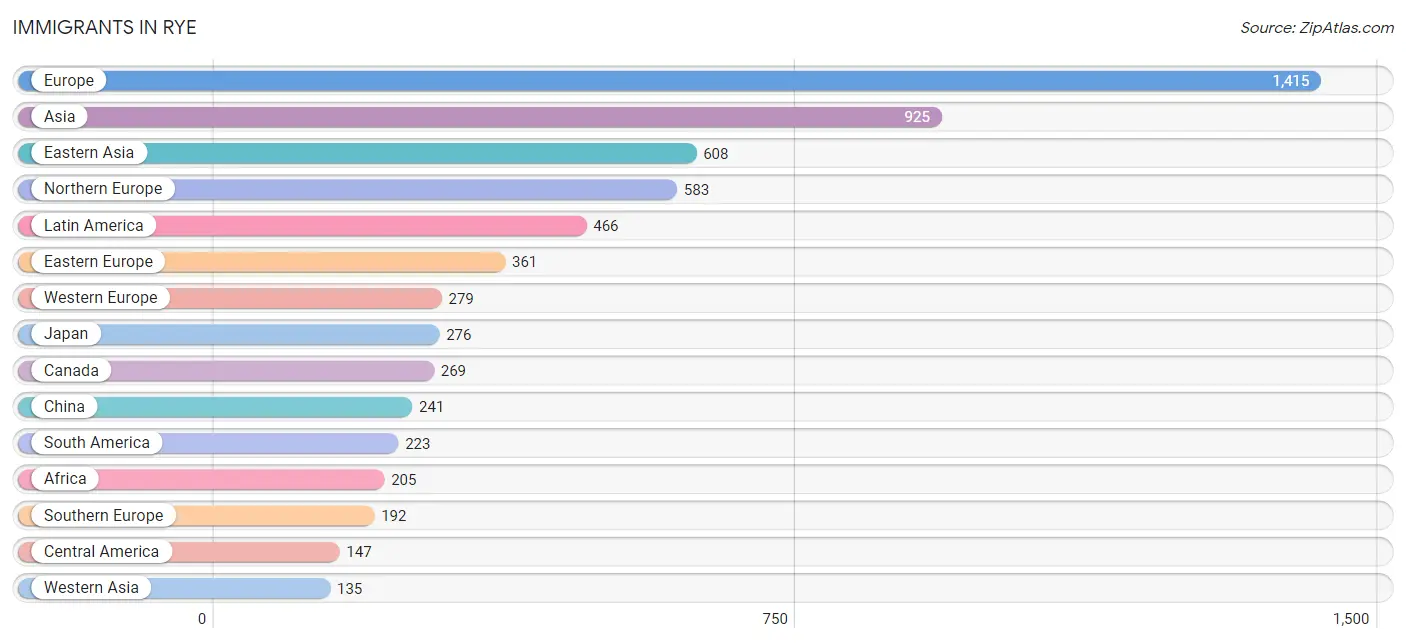
Immigrants in Rye
The most numerous immigrant groups reported in Rye came from Europe (1,415 | 8.6%), Asia (925 | 5.6%), Eastern Asia (608 | 3.7%), Northern Europe (583 | 3.5%), and Latin America (466 | 2.8%), together accounting for 24.3% of all Rye residents.
| Immigration Origin | # Population | % Population |
| Africa | 205 | 1.3% |
| Albania | 30 | 0.2% |
| Argentina | 44 | 0.3% |
| Asia | 925 | 5.6% |
| Australia | 39 | 0.2% |
| Austria | 11 | 0.1% |
| Bangladesh | 62 | 0.4% |
| Belgium | 30 | 0.2% |
| Brazil | 88 | 0.5% |
| Bulgaria | 8 | 0.1% |
| Cameroon | 12 | 0.1% |
| Canada | 269 | 1.6% |
| Caribbean | 96 | 0.6% |
| Central America | 147 | 0.9% |
| China | 241 | 1.5% |
| Colombia | 30 | 0.2% |
| Czechoslovakia | 45 | 0.3% |
| Dominican Republic | 84 | 0.5% |
| Eastern Asia | 608 | 3.7% |
| Eastern Europe | 361 | 2.2% |
| Ecuador | 6 | 0.0% |
| England | 89 | 0.5% |
| Europe | 1,415 | 8.6% |
| France | 52 | 0.3% |
| Germany | 70 | 0.4% |
| Ghana | 32 | 0.2% |
| Haiti | 11 | 0.1% |
| Hong Kong | 35 | 0.2% |
| India | 34 | 0.2% |
| Iran | 24 | 0.2% |
| Ireland | 67 | 0.4% |
| Israel | 29 | 0.2% |
| Italy | 116 | 0.7% |
| Jamaica | 1 | 0.0% |
| Japan | 276 | 1.7% |
| Korea | 91 | 0.5% |
| Latin America | 466 | 2.8% |
| Latvia | 47 | 0.3% |
| Lebanon | 25 | 0.2% |
| Mexico | 103 | 0.6% |
| Middle Africa | 12 | 0.1% |
| Morocco | 49 | 0.3% |
| Netherlands | 69 | 0.4% |
| Northern Africa | 49 | 0.3% |
| Northern Europe | 583 | 3.5% |
| Oceania | 57 | 0.4% |
| Panama | 44 | 0.3% |
| Philippines | 30 | 0.2% |
| Poland | 21 | 0.1% |
| Portugal | 22 | 0.1% |
| Romania | 41 | 0.3% |
| Russia | 85 | 0.5% |
| Scotland | 53 | 0.3% |
| Serbia | 18 | 0.1% |
| Singapore | 8 | 0.1% |
| South Africa | 112 | 0.7% |
| South America | 223 | 1.4% |
| South Central Asia | 130 | 0.8% |
| South Eastern Asia | 52 | 0.3% |
| Southern Europe | 192 | 1.2% |
| Spain | 54 | 0.3% |
| Sweden | 7 | 0.0% |
| Switzerland | 47 | 0.3% |
| Taiwan | 17 | 0.1% |
| Thailand | 14 | 0.1% |
| Turkey | 81 | 0.5% |
| Ukraine | 66 | 0.4% |
| Uruguay | 23 | 0.1% |
| Venezuela | 32 | 0.2% |
| Western Africa | 32 | 0.2% |
| Western Asia | 135 | 0.8% |
| Western Europe | 279 | 1.7% | View All 72 Rows |
Sex and Age in Rye
Sex and Age in Rye
The most populous age groups in Rye are 15 to 19 Years (844 | 10.3%) for men and 50 to 54 Years (810 | 9.8%) for women.
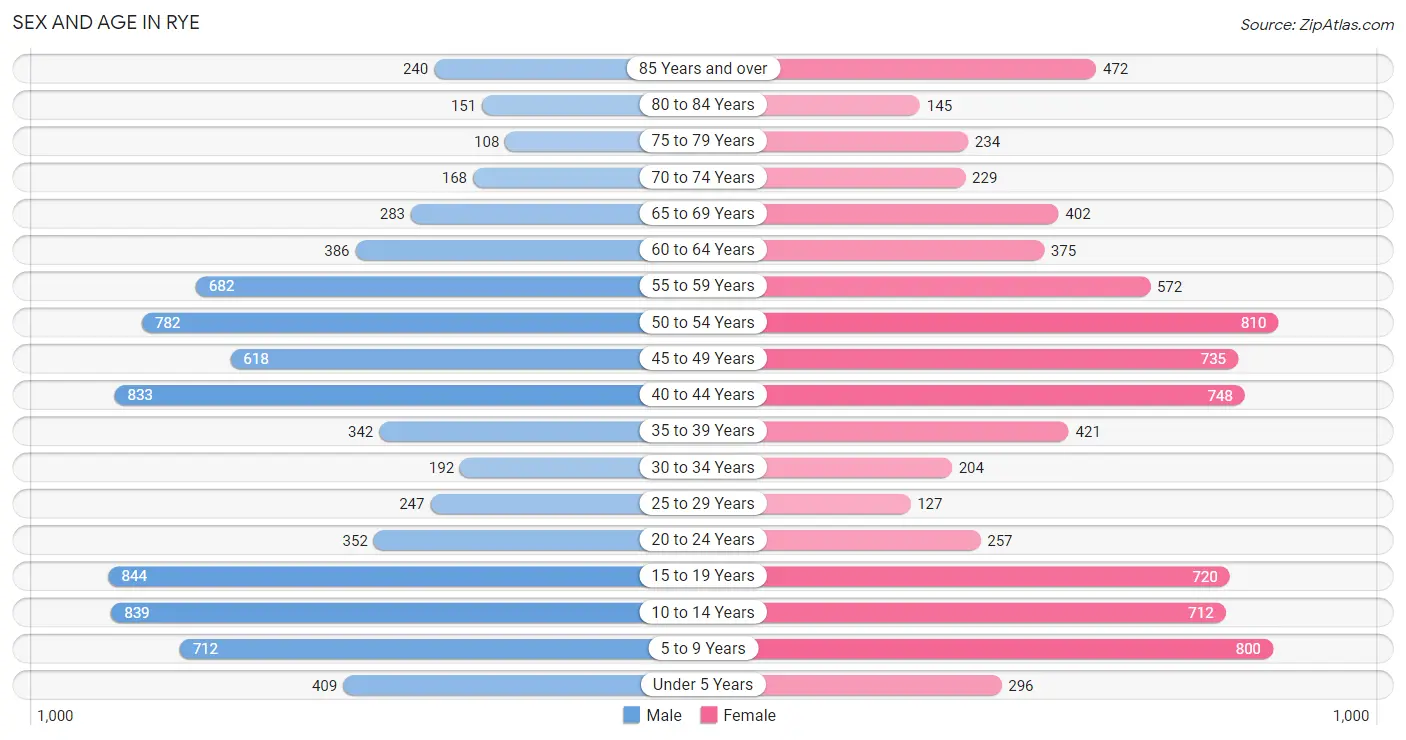
| Age Bracket | Male | Female |
| Under 5 Years | 409 (5.0%) | 296 (3.6%) |
| 5 to 9 Years | 712 (8.7%) | 800 (9.7%) |
| 10 to 14 Years | 839 (10.2%) | 712 (8.6%) |
| 15 to 19 Years | 844 (10.3%) | 720 (8.7%) |
| 20 to 24 Years | 352 (4.3%) | 257 (3.1%) |
| 25 to 29 Years | 247 (3.0%) | 127 (1.5%) |
| 30 to 34 Years | 192 (2.3%) | 204 (2.5%) |
| 35 to 39 Years | 342 (4.2%) | 421 (5.1%) |
| 40 to 44 Years | 833 (10.2%) | 748 (9.1%) |
| 45 to 49 Years | 618 (7.5%) | 735 (8.9%) |
| 50 to 54 Years | 782 (9.6%) | 810 (9.8%) |
| 55 to 59 Years | 682 (8.3%) | 572 (6.9%) |
| 60 to 64 Years | 386 (4.7%) | 375 (4.5%) |
| 65 to 69 Years | 283 (3.5%) | 402 (4.9%) |
| 70 to 74 Years | 168 (2.1%) | 229 (2.8%) |
| 75 to 79 Years | 108 (1.3%) | 234 (2.8%) |
| 80 to 84 Years | 151 (1.8%) | 145 (1.8%) |
| 85 Years and over | 240 (2.9%) | 472 (5.7%) |
| Total | 8,188 (100.0%) | 8,259 (100.0%) |
Families and Households in Rye
Median Family Size in Rye
The median family size in Rye is 3.30 persons per family, with married-couple families (3,951 | 90.6%) accounting for the largest median family size of 3.35 persons per family. On the other hand, single female/mother families (293 | 6.7%) represent the smallest median family size with 2.67 persons per family.
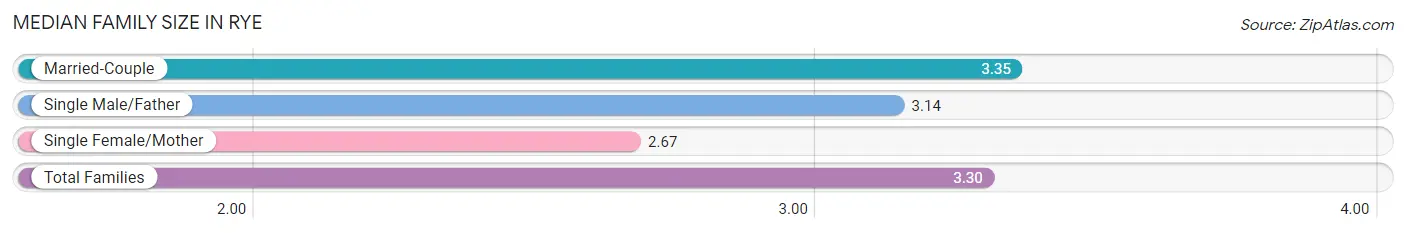
| Family Type | # Families | Family Size |
| Married-Couple | 3,951 (90.6%) | 3.35 |
| Single Male/Father | 115 (2.6%) | 3.14 |
| Single Female/Mother | 293 (6.7%) | 2.67 |
| Total Families | 4,359 (100.0%) | 3.30 |
Median Household Size in Rye
The median household size in Rye is 2.77 persons per household, with married-couple households (3,951 | 67.2%) accounting for the largest median household size of 3.37 persons per household. non-family households (1,521 | 25.9%) represent the smallest median household size with 1.17 persons per household.
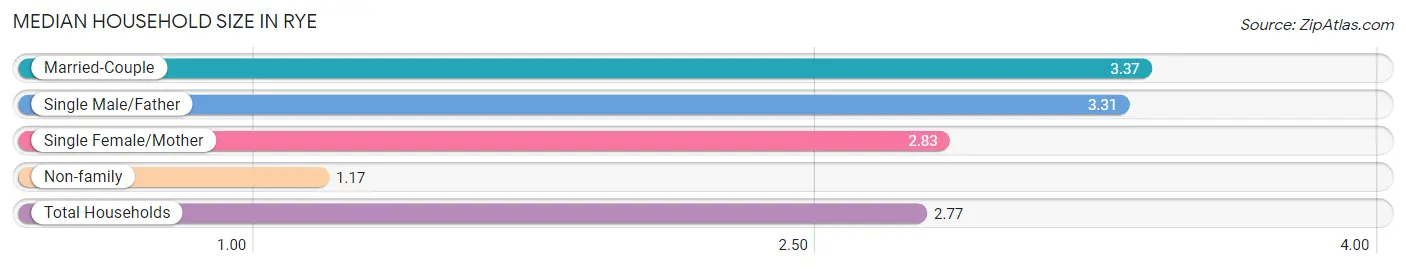
| Household Type | # Households | Household Size |
| Married-Couple | 3,951 (67.2%) | 3.37 |
| Single Male/Father | 115 (2.0%) | 3.31 |
| Single Female/Mother | 293 (5.0%) | 2.83 |
| Non-family | 1,521 (25.9%) | 1.17 |
| Total Households | 5,880 (100.0%) | 2.77 |
Household Size by Marriage Status in Rye
Out of a total of 5,880 households in Rye, 4,359 (74.1%) are family households, while 1,521 (25.9%) are nonfamily households. The most numerous type of family households are 4-person households, comprising 1,260, and the most common type of nonfamily households are 1-person households, comprising 1,318.
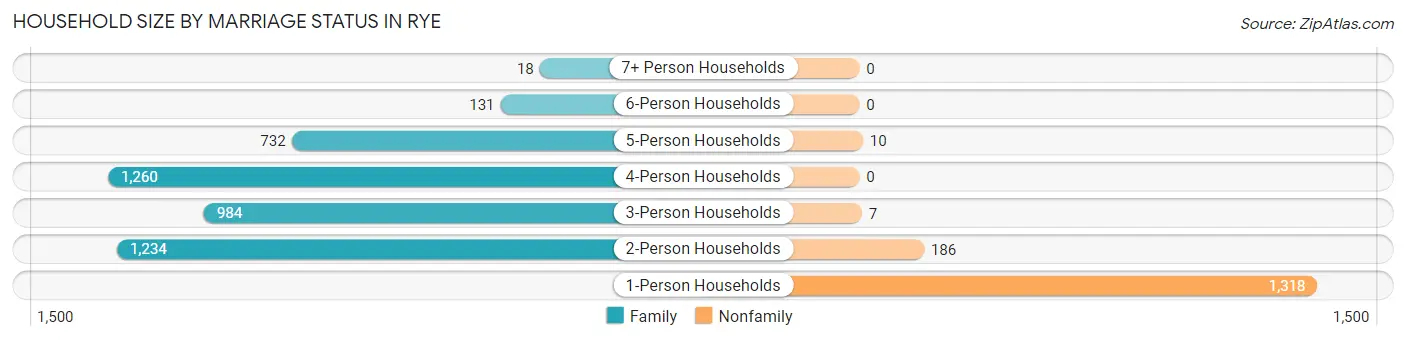
| Household Size | Family Households | Nonfamily Households |
| 1-Person Households | - | 1,318 (22.4%) |
| 2-Person Households | 1,234 (21.0%) | 186 (3.2%) |
| 3-Person Households | 984 (16.7%) | 7 (0.1%) |
| 4-Person Households | 1,260 (21.4%) | 0 (0.0%) |
| 5-Person Households | 732 (12.4%) | 10 (0.2%) |
| 6-Person Households | 131 (2.2%) | 0 (0.0%) |
| 7+ Person Households | 18 (0.3%) | 0 (0.0%) |
| Total | 4,359 (74.1%) | 1,521 (25.9%) |
Female Fertility in Rye
Fertility by Age in Rye
Average fertility rate in Rye is 24.0 births per 1,000 women. Women in the age bracket of 20 to 34 years have the highest fertility rate with 54.0 births per 1,000 women. Women in the age bracket of 35 to 50 years acount for 61.5% of all women with births.
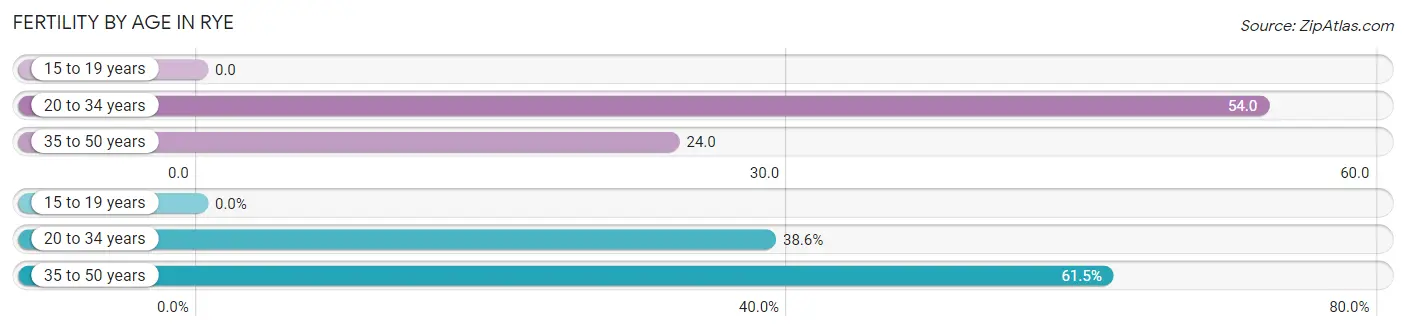
| Age Bracket | Women with Births | Births / 1,000 Women |
| 15 to 19 years | 0 (0.0%) | 0.0 |
| 20 to 34 years | 32 (38.6%) | 54.0 |
| 35 to 50 years | 51 (61.5%) | 24.0 |
| Total | 83 (100.0%) | 24.0 |
Fertility by Age by Marriage Status in Rye
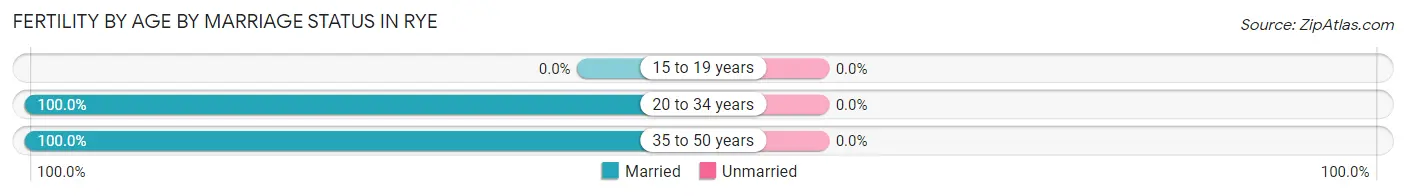
| Age Bracket | Married | Unmarried |
| 15 to 19 years | 0 (0.0%) | 0 (0.0%) |
| 20 to 34 years | 32 (100.0%) | 0 (0.0%) |
| 35 to 50 years | 51 (100.0%) | 0 (0.0%) |
| Total | 83 (100.0%) | 0 (0.0%) |
Fertility by Education in Rye
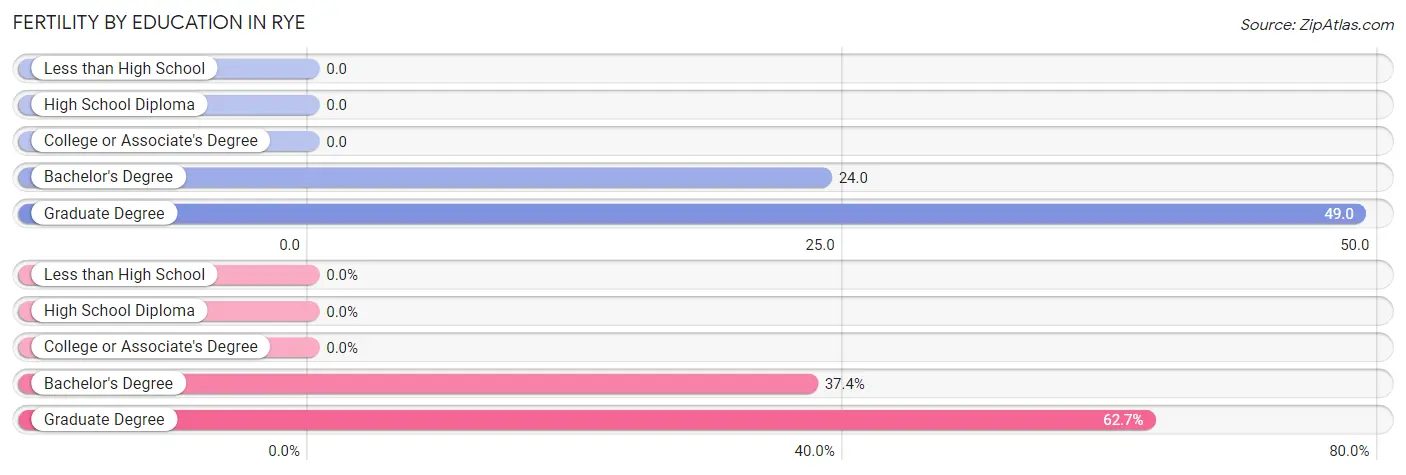
| Educational Attainment | Women with Births | Births / 1,000 Women |
| Less than High School | 0 (0.0%) | 0.0 |
| High School Diploma | 0 (0.0%) | 0.0 |
| College or Associate's Degree | 0 (0.0%) | 0.0 |
| Bachelor's Degree | 31 (37.3%) | 24.0 |
| Graduate Degree | 52 (62.6%) | 49.0 |
| Total | 83 (100.0%) | 24.0 |
Fertility by Education by Marriage Status in Rye
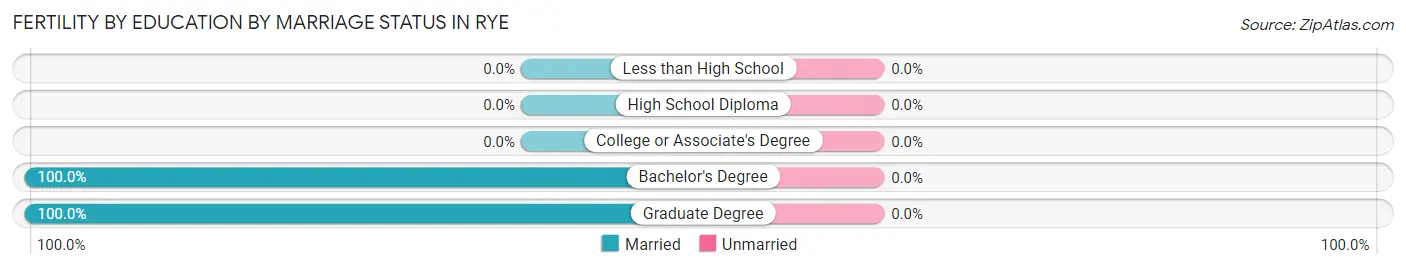
| Educational Attainment | Married | Unmarried |
| Less than High School | 0 (0.0%) | 0 (0.0%) |
| High School Diploma | 0 (0.0%) | 0 (0.0%) |
| College or Associate's Degree | 0 (0.0%) | 0 (0.0%) |
| Bachelor's Degree | 31 (100.0%) | 0 (0.0%) |
| Graduate Degree | 52 (100.0%) | 0 (0.0%) |
| Total | 83 (100.0%) | 0 (0.0%) |
Employment Characteristics in Rye
Employment by Class of Employer in Rye
Among the 7,466 employed individuals in Rye, private company employees (4,887 | 65.5%), not-for-profit organizations (787 | 10.5%), and self-employed (incorporated) (697 | 9.3%) make up the most common classes of employment.
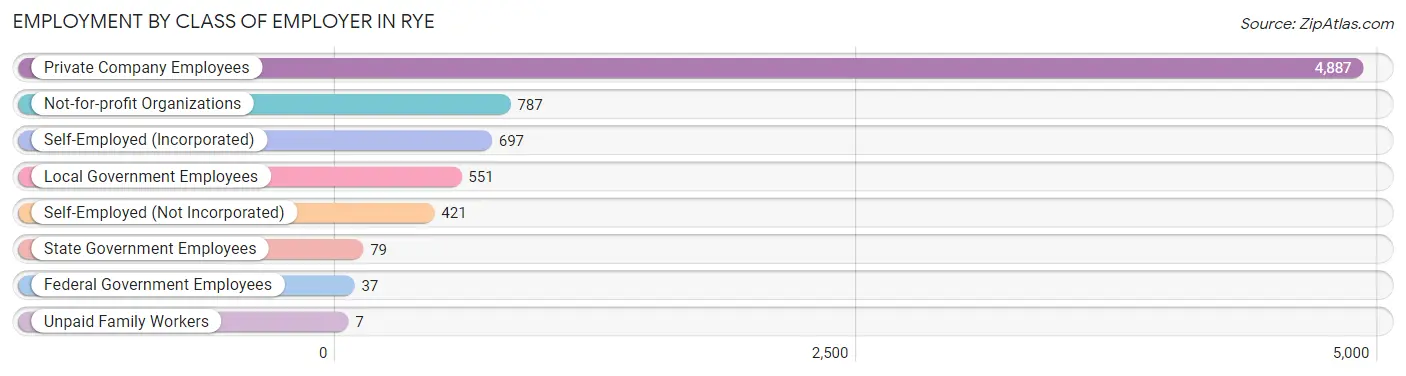
| Employer Class | # Employees | % Employees |
| Private Company Employees | 4,887 | 65.5% |
| Self-Employed (Incorporated) | 697 | 9.3% |
| Self-Employed (Not Incorporated) | 421 | 5.6% |
| Not-for-profit Organizations | 787 | 10.5% |
| Local Government Employees | 551 | 7.4% |
| State Government Employees | 79 | 1.1% |
| Federal Government Employees | 37 | 0.5% |
| Unpaid Family Workers | 7 | 0.1% |
| Total | 7,466 | 100.0% |
Employment Status by Age in Rye
According to the labor force statistics for Rye, out of the total population over 16 years of age (12,391), 64.5% or 7,992 individuals are in the labor force, with 5.2% or 416 of them unemployed. The age group with the highest labor force participation rate is 25 to 29 years, with 97.9% or 366 individuals in the labor force. Within the labor force, the 20 to 24 years age range has the highest percentage of unemployed individuals, with 15.0% or 73 of them being unemployed.
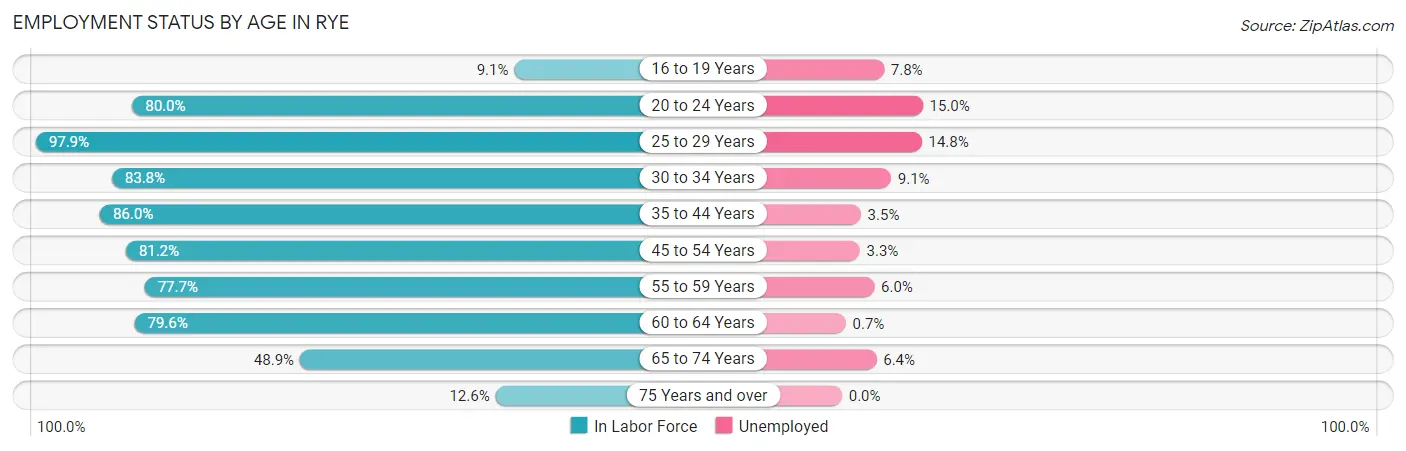
| Age Bracket | In Labor Force | Unemployed |
| 16 to 19 Years | 116 (9.1%) | 9 (7.8%) |
| 20 to 24 Years | 487 (80.0%) | 73 (15.0%) |
| 25 to 29 Years | 366 (97.9%) | 54 (14.8%) |
| 30 to 34 Years | 332 (83.8%) | 30 (9.1%) |
| 35 to 44 Years | 2,016 (86.0%) | 71 (3.5%) |
| 45 to 54 Years | 2,391 (81.2%) | 79 (3.3%) |
| 55 to 59 Years | 974 (77.7%) | 58 (6.0%) |
| 60 to 64 Years | 606 (79.6%) | 4 (0.7%) |
| 65 to 74 Years | 529 (48.9%) | 34 (6.4%) |
| 75 Years and over | 170 (12.6%) | 0 (0.0%) |
| Total | 7,992 (64.5%) | 416 (5.2%) |
Employment Status by Educational Attainment in Rye
According to labor force statistics for Rye, 82.8% of individuals (6,685) out of the total population between 25 and 64 years of age (8,074) are in the labor force, with 4.4% or 294 of them being unemployed. The group with the highest labor force participation rate are those with the educational attainment of bachelor's degree or higher, with 84.1% or 5,794 individuals in the labor force. Within the labor force, individuals with high school diploma education have the highest percentage of unemployment, with 19.0% or 51 of them being unemployed.
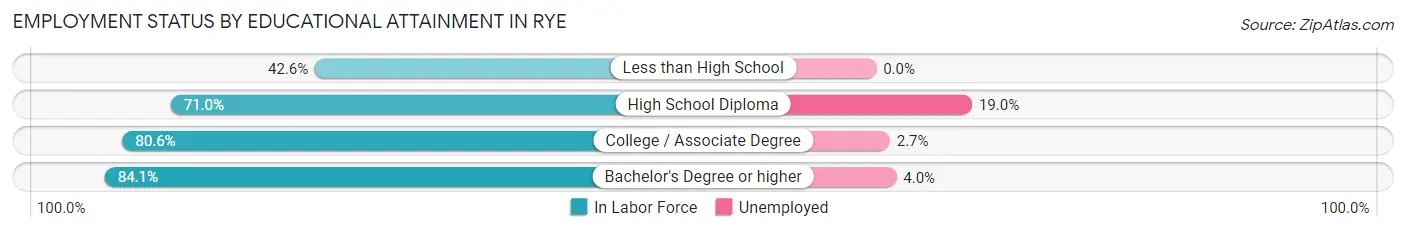
| Educational Attainment | In Labor Force | Unemployed |
| Less than High School | 29 (42.6%) | 0 (0.0%) |
| High School Diploma | 269 (71.0%) | 72 (19.0%) |
| College / Associate Degree | 594 (80.6%) | 20 (2.7%) |
| Bachelor's Degree or higher | 5,794 (84.1%) | 276 (4.0%) |
| Total | 6,685 (82.8%) | 355 (4.4%) |
Employment Occupations by Sex in Rye
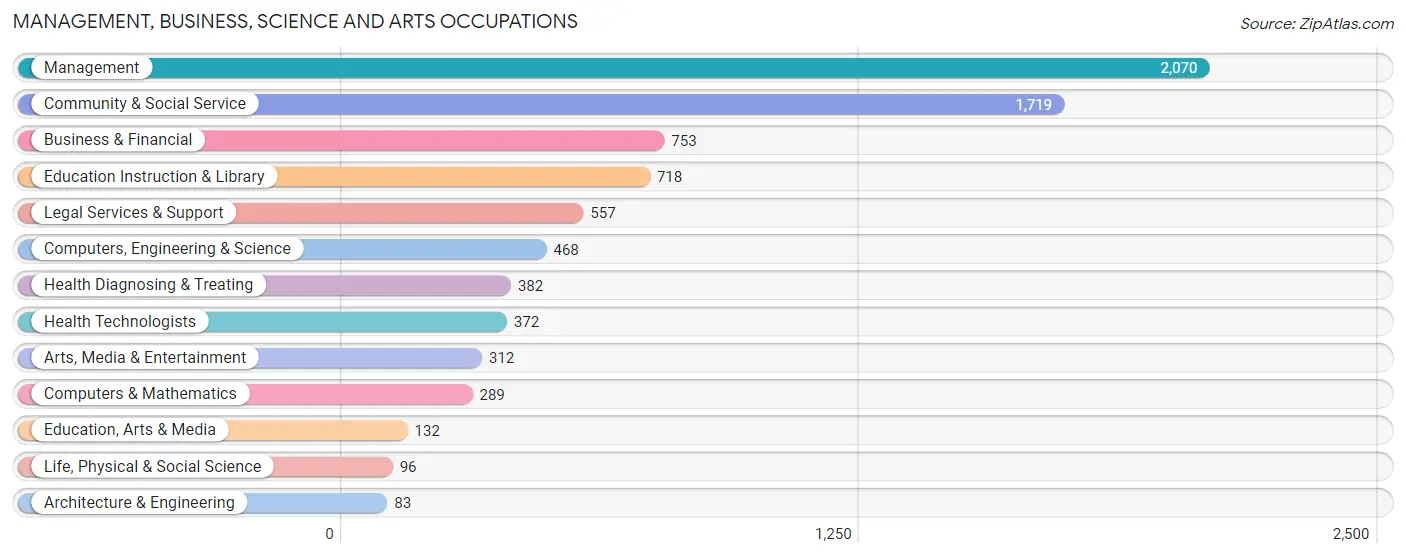
Management, Business, Science and Arts Occupations
The most common Management, Business, Science and Arts occupations in Rye are Management (2,070 | 27.3%), Community & Social Service (1,719 | 22.7%), Business & Financial (753 | 10.0%), Education Instruction & Library (718 | 9.5%), and Legal Services & Support (557 | 7.4%).
Management, Business, Science and Arts Occupations by Sex
Within the Management, Business, Science and Arts occupations in Rye, the most male-oriented occupations are Architecture & Engineering (100.0%), Legal Services & Support (77.2%), and Management (70.3%), while the most female-oriented occupations are Education, Arts & Media (94.7%), Education Instruction & Library (84.7%), and Life, Physical & Social Science (82.3%).
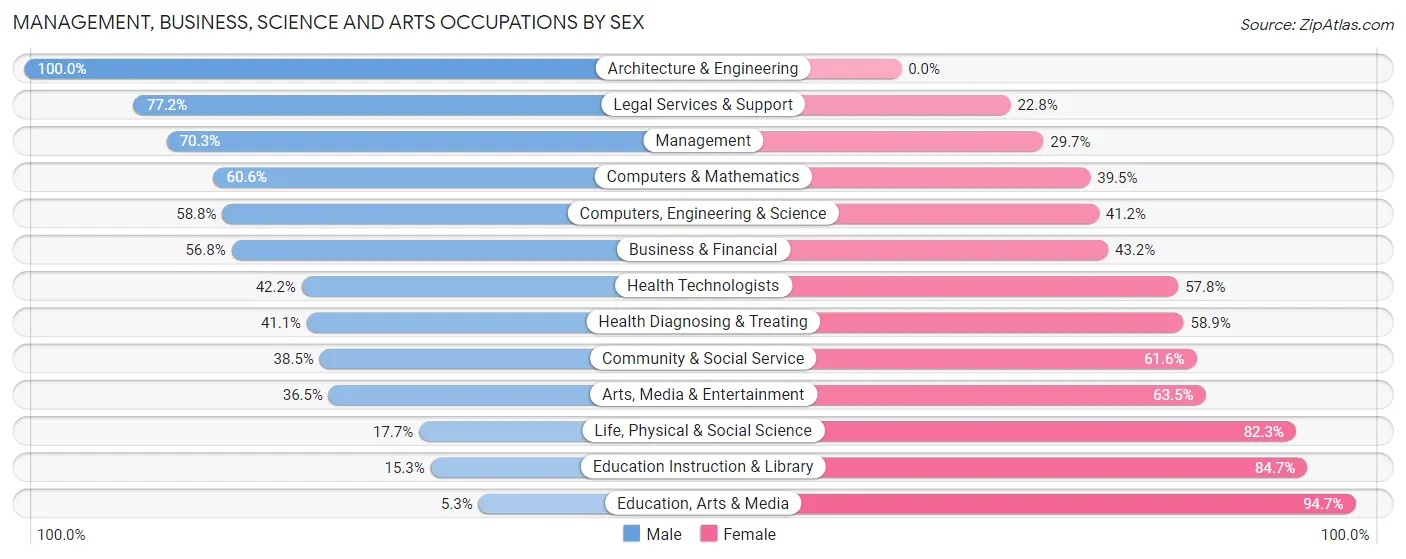
| Occupation | Male | Female |
| Management | 1,456 (70.3%) | 614 (29.7%) |
| Business & Financial | 428 (56.8%) | 325 (43.2%) |
| Computers, Engineering & Science | 275 (58.8%) | 193 (41.2%) |
| Computers & Mathematics | 175 (60.6%) | 114 (39.5%) |
| Architecture & Engineering | 83 (100.0%) | 0 (0.0%) |
| Life, Physical & Social Science | 17 (17.7%) | 79 (82.3%) |
| Community & Social Service | 661 (38.5%) | 1,058 (61.6%) |
| Education, Arts & Media | 7 (5.3%) | 125 (94.7%) |
| Legal Services & Support | 430 (77.2%) | 127 (22.8%) |
| Education Instruction & Library | 110 (15.3%) | 608 (84.7%) |
| Arts, Media & Entertainment | 114 (36.5%) | 198 (63.5%) |
| Health Diagnosing & Treating | 157 (41.1%) | 225 (58.9%) |
| Health Technologists | 157 (42.2%) | 215 (57.8%) |
| Total (Category) | 2,977 (55.2%) | 2,415 (44.8%) |
| Total (Overall) | 4,198 (55.4%) | 3,373 (44.6%) |
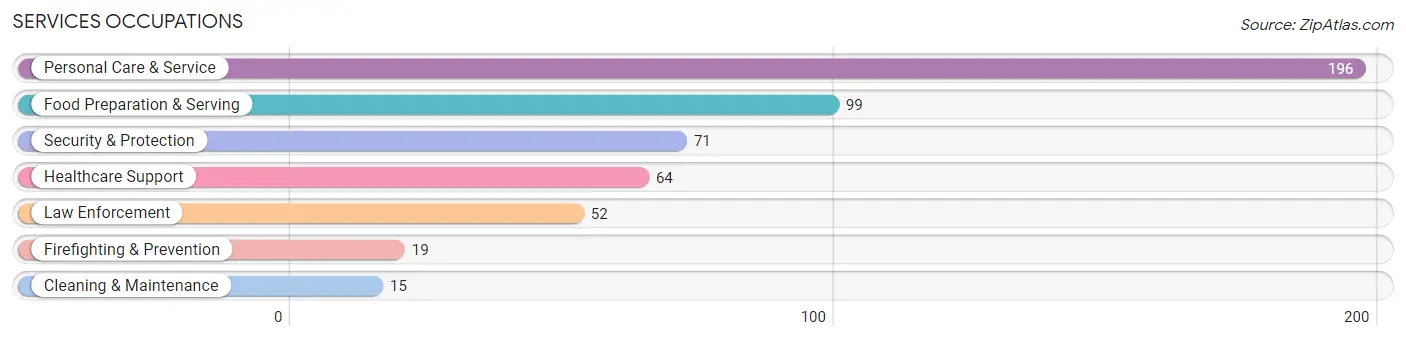
Services Occupations
The most common Services occupations in Rye are Personal Care & Service (196 | 2.6%), Food Preparation & Serving (99 | 1.3%), Security & Protection (71 | 0.9%), Healthcare Support (64 | 0.9%), and Law Enforcement (52 | 0.7%).
Services Occupations by Sex
Within the Services occupations in Rye, the most male-oriented occupations are Law Enforcement (100.0%), Cleaning & Maintenance (100.0%), and Security & Protection (81.7%), while the most female-oriented occupations are Food Preparation & Serving (77.8%), Healthcare Support (71.9%), and Firefighting & Prevention (68.4%).
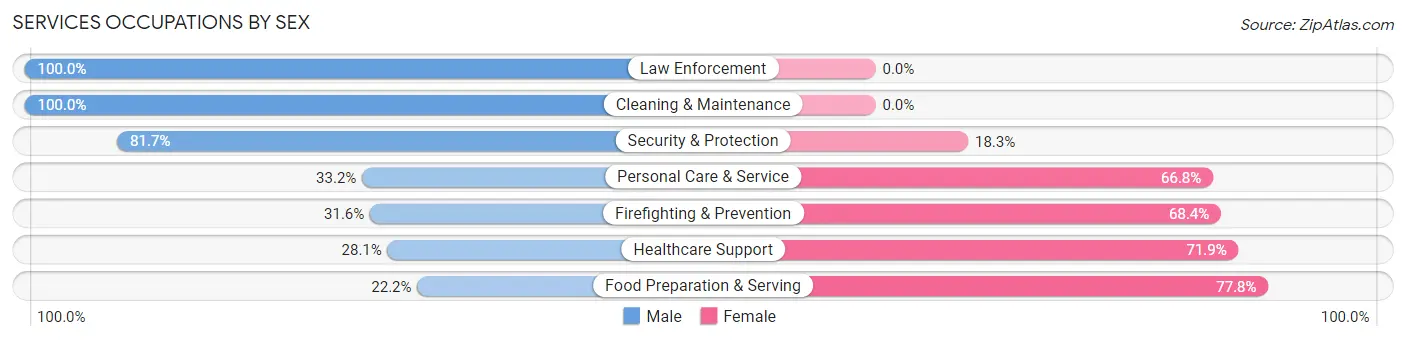
| Occupation | Male | Female |
| Healthcare Support | 18 (28.1%) | 46 (71.9%) |
| Security & Protection | 58 (81.7%) | 13 (18.3%) |
| Firefighting & Prevention | 6 (31.6%) | 13 (68.4%) |
| Law Enforcement | 52 (100.0%) | 0 (0.0%) |
| Food Preparation & Serving | 22 (22.2%) | 77 (77.8%) |
| Cleaning & Maintenance | 15 (100.0%) | 0 (0.0%) |
| Personal Care & Service | 65 (33.2%) | 131 (66.8%) |
| Total (Category) | 178 (40.0%) | 267 (60.0%) |
| Total (Overall) | 4,198 (55.4%) | 3,373 (44.6%) |
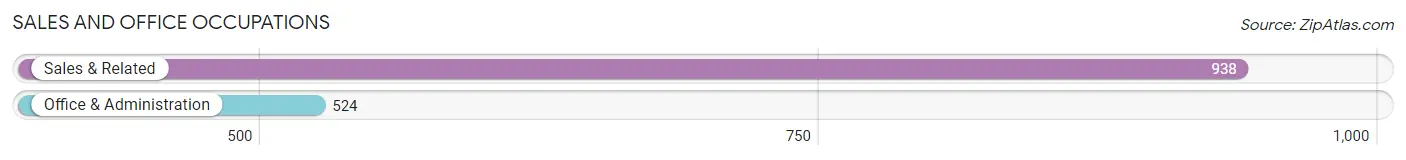
Sales and Office Occupations
The most common Sales and Office occupations in Rye are Sales & Related (938 | 12.4%), and Office & Administration (524 | 6.9%).
Sales and Office Occupations by Sex
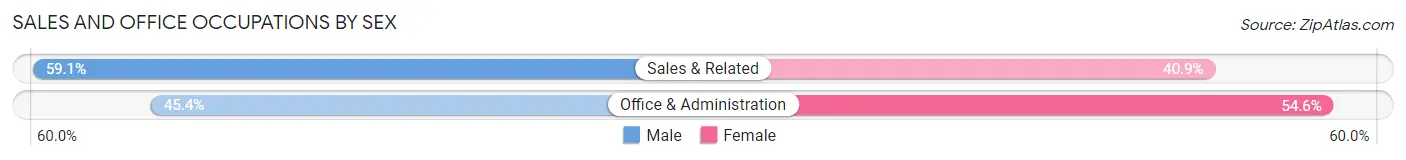
| Occupation | Male | Female |
| Sales & Related | 554 (59.1%) | 384 (40.9%) |
| Office & Administration | 238 (45.4%) | 286 (54.6%) |
| Total (Category) | 792 (54.2%) | 670 (45.8%) |
| Total (Overall) | 4,198 (55.4%) | 3,373 (44.6%) |
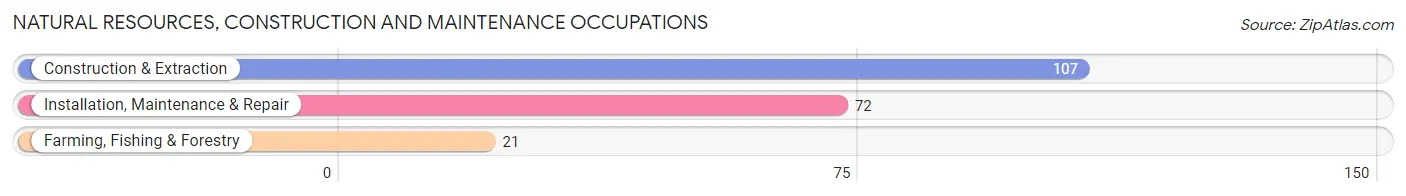
Natural Resources, Construction and Maintenance Occupations
The most common Natural Resources, Construction and Maintenance occupations in Rye are Construction & Extraction (107 | 1.4%), Installation, Maintenance & Repair (72 | 0.9%), and Farming, Fishing & Forestry (21 | 0.3%).
Natural Resources, Construction and Maintenance Occupations by Sex
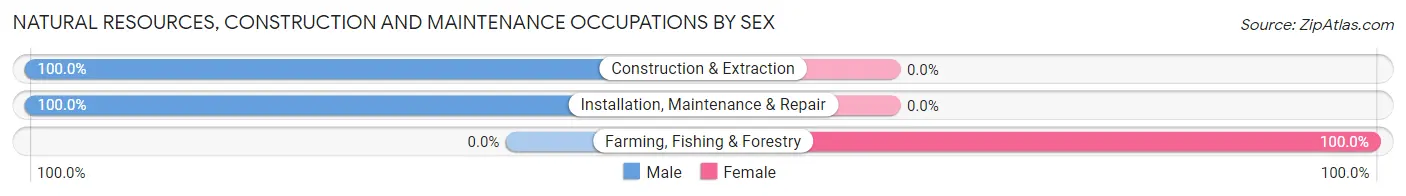
| Occupation | Male | Female |
| Farming, Fishing & Forestry | 0 (0.0%) | 21 (100.0%) |
| Construction & Extraction | 107 (100.0%) | 0 (0.0%) |
| Installation, Maintenance & Repair | 72 (100.0%) | 0 (0.0%) |
| Total (Category) | 179 (89.5%) | 21 (10.5%) |
| Total (Overall) | 4,198 (55.4%) | 3,373 (44.6%) |
Production, Transportation and Moving Occupations
The most common Production, Transportation and Moving occupations in Rye are Transportation (38 | 0.5%), and Production (34 | 0.4%).
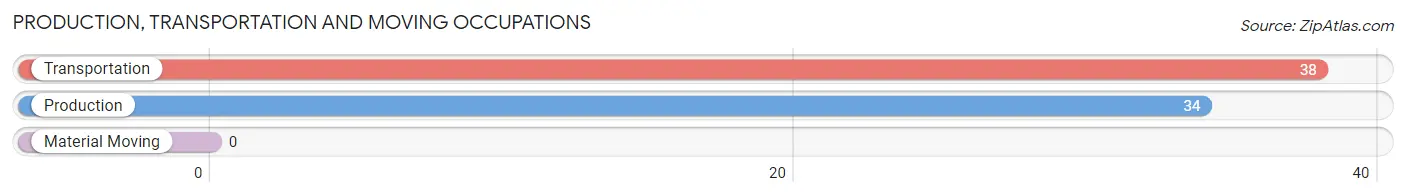
Production, Transportation and Moving Occupations by Sex
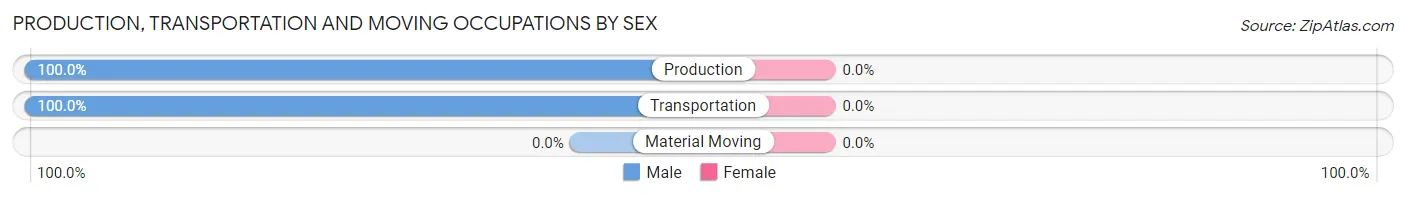
| Occupation | Male | Female |
| Production | 34 (100.0%) | 0 (0.0%) |
| Transportation | 38 (100.0%) | 0 (0.0%) |
| Material Moving | 0 (0.0%) | 0 (0.0%) |
| Total (Category) | 72 (100.0%) | 0 (0.0%) |
| Total (Overall) | 4,198 (55.4%) | 3,373 (44.6%) |
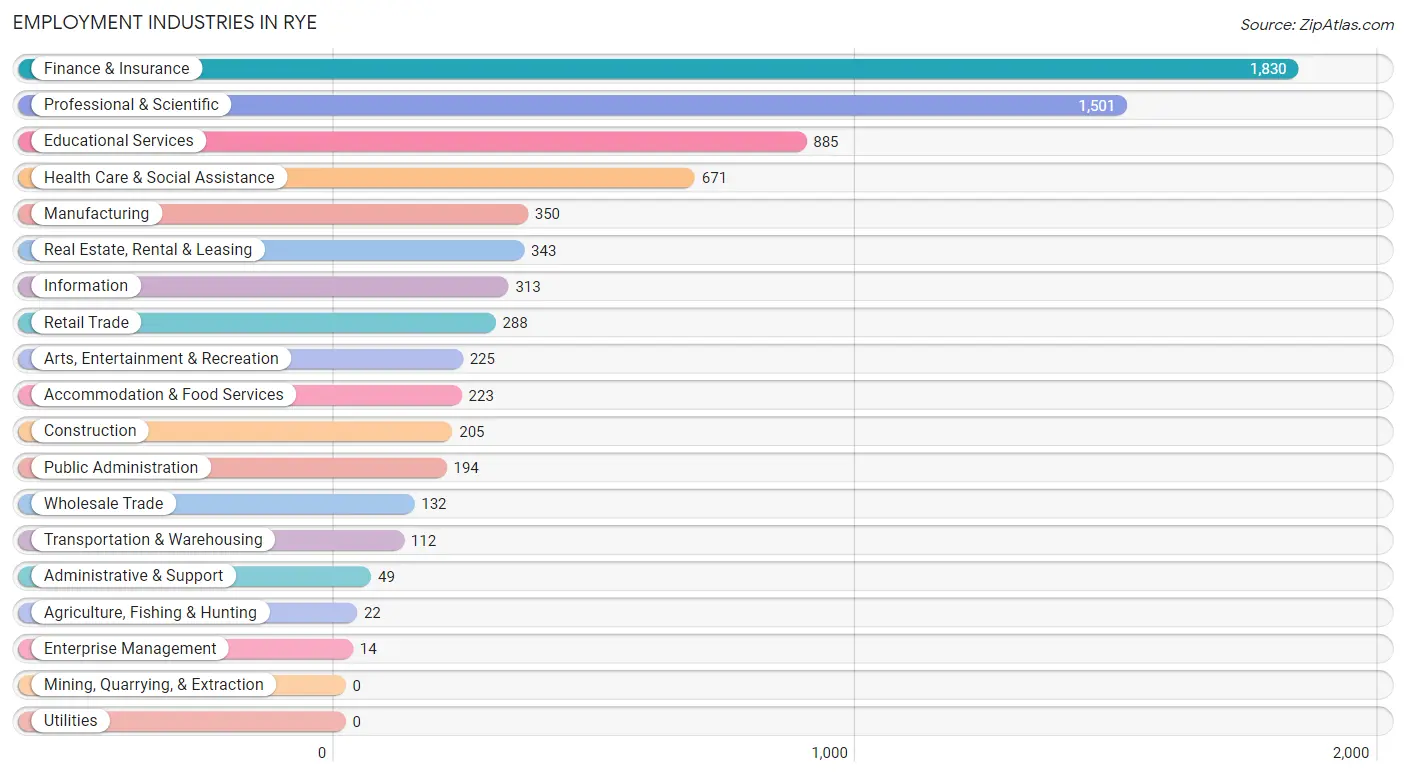
Employment Industries by Sex in Rye
Employment Industries in Rye
The major employment industries in Rye include Finance & Insurance (1,830 | 24.2%), Professional & Scientific (1,501 | 19.8%), Educational Services (885 | 11.7%), Health Care & Social Assistance (671 | 8.9%), and Manufacturing (350 | 4.6%).
Employment Industries by Sex in Rye
The Rye industries that see more men than women are Construction (100.0%), Enterprise Management (100.0%), and Public Administration (83.0%), whereas the industries that tend to have a higher number of women are Agriculture, Fishing & Hunting (95.5%), Educational Services (79.2%), and Health Care & Social Assistance (64.7%).
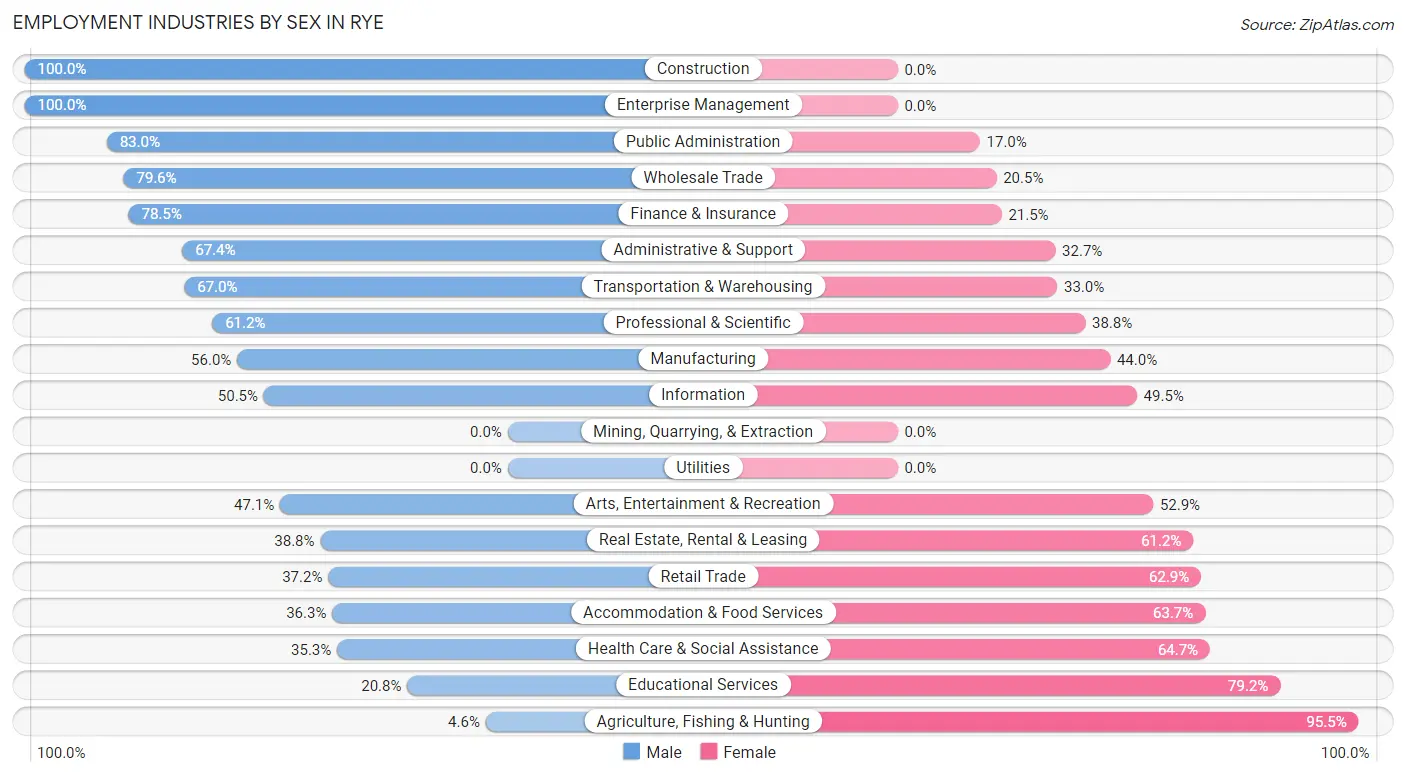
| Industry | Male | Female |
| Agriculture, Fishing & Hunting | 1 (4.5%) | 21 (95.5%) |
| Mining, Quarrying, & Extraction | 0 (0.0%) | 0 (0.0%) |
| Construction | 205 (100.0%) | 0 (0.0%) |
| Manufacturing | 196 (56.0%) | 154 (44.0%) |
| Wholesale Trade | 105 (79.5%) | 27 (20.4%) |
| Retail Trade | 107 (37.1%) | 181 (62.8%) |
| Transportation & Warehousing | 75 (67.0%) | 37 (33.0%) |
| Utilities | 0 (0.0%) | 0 (0.0%) |
| Information | 158 (50.5%) | 155 (49.5%) |
| Finance & Insurance | 1,436 (78.5%) | 394 (21.5%) |
| Real Estate, Rental & Leasing | 133 (38.8%) | 210 (61.2%) |
| Professional & Scientific | 918 (61.2%) | 583 (38.8%) |
| Enterprise Management | 14 (100.0%) | 0 (0.0%) |
| Administrative & Support | 33 (67.3%) | 16 (32.7%) |
| Educational Services | 184 (20.8%) | 701 (79.2%) |
| Health Care & Social Assistance | 237 (35.3%) | 434 (64.7%) |
| Arts, Entertainment & Recreation | 106 (47.1%) | 119 (52.9%) |
| Accommodation & Food Services | 81 (36.3%) | 142 (63.7%) |
| Public Administration | 161 (83.0%) | 33 (17.0%) |
| Total | 4,198 (55.4%) | 3,373 (44.6%) |
Education in Rye
School Enrollment in Rye
The most common levels of schooling among the 5,344 students in Rye are high school (1,496 | 28.0%), middle school (1,204 | 22.5%), and elementary school (1,147 | 21.5%).
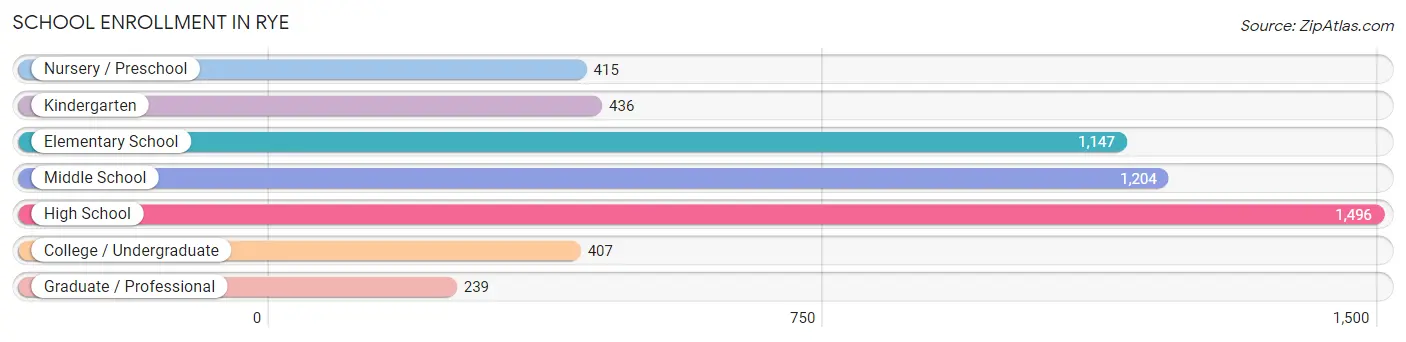
| School Level | # Students | % Students |
| Nursery / Preschool | 415 | 7.8% |
| Kindergarten | 436 | 8.2% |
| Elementary School | 1,147 | 21.5% |
| Middle School | 1,204 | 22.5% |
| High School | 1,496 | 28.0% |
| College / Undergraduate | 407 | 7.6% |
| Graduate / Professional | 239 | 4.5% |
| Total | 5,344 | 100.0% |
School Enrollment by Age by Funding Source in Rye
Out of a total of 5,344 students who are enrolled in schools in Rye, 1,673 (31.3%) attend a private institution, while the remaining 3,671 (68.7%) are enrolled in public schools. The age group of 25 to 34 year olds has the highest likelihood of being enrolled in private schools, with 43 (100.0% in the age bracket) enrolled. Conversely, the age group of 10 to 14 year olds has the lowest likelihood of being enrolled in a private school, with 1,291 (83.2% in the age bracket) attending a public institution.
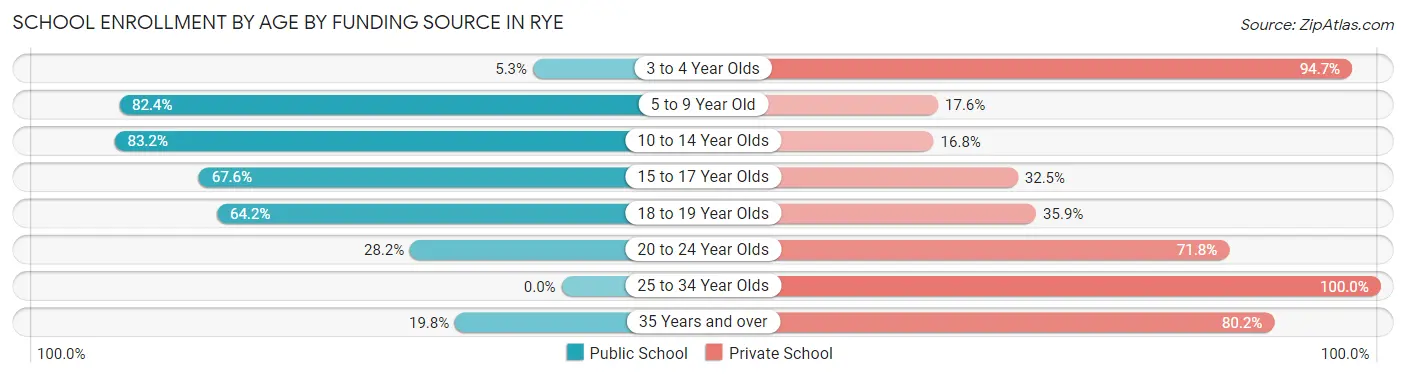
| Age Bracket | Public School | Private School |
| 3 to 4 Year Olds | 17 (5.3%) | 302 (94.7%) |
| 5 to 9 Year Old | 1,246 (82.4%) | 266 (17.6%) |
| 10 to 14 Year Olds | 1,291 (83.2%) | 260 (16.8%) |
| 15 to 17 Year Olds | 710 (67.5%) | 341 (32.5%) |
| 18 to 19 Year Olds | 306 (64.1%) | 171 (35.8%) |
| 20 to 24 Year Olds | 79 (28.2%) | 201 (71.8%) |
| 25 to 34 Year Olds | 0 (0.0%) | 43 (100.0%) |
| 35 Years and over | 22 (19.8%) | 89 (80.2%) |
| Total | 3,671 (68.7%) | 1,673 (31.3%) |
Educational Attainment by Field of Study in Rye
Business (2,192 | 23.3%), social sciences (1,780 | 18.9%), literature & languages (762 | 8.1%), liberal arts & history (669 | 7.1%), and psychology (569 | 6.0%) are the most common fields of study among 9,403 individuals in Rye who have obtained a bachelor's degree or higher.
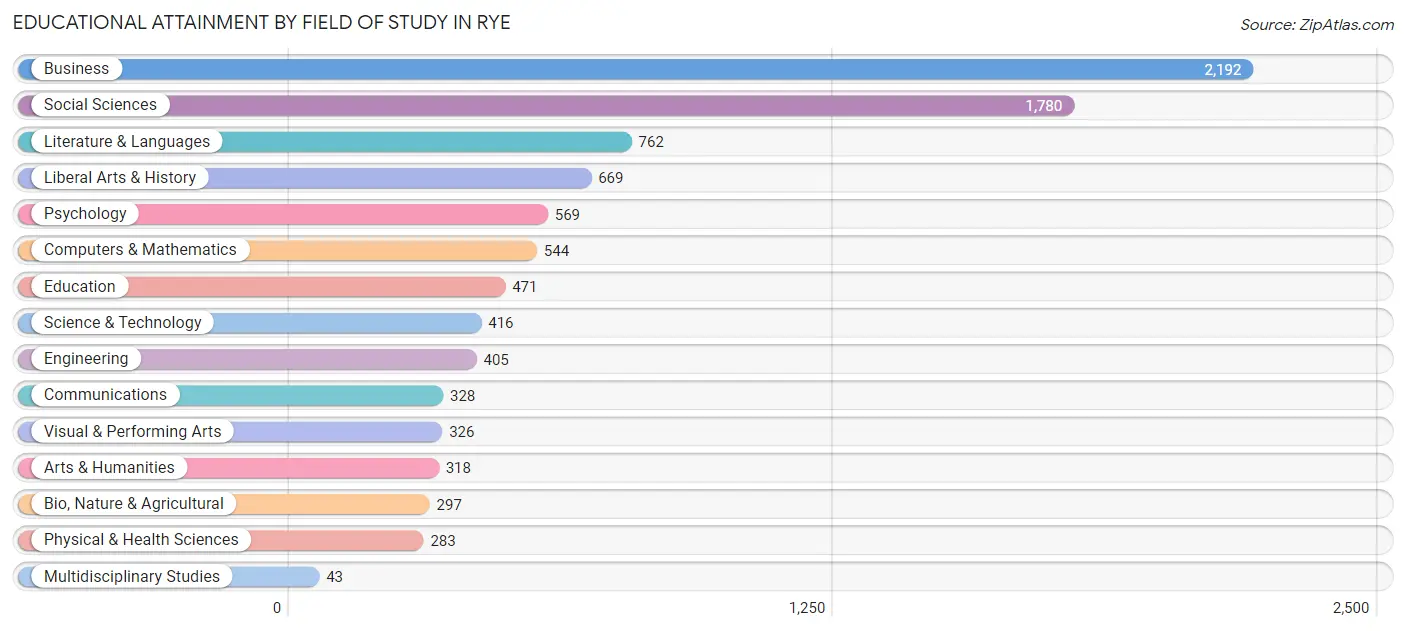
| Field of Study | # Graduates | % Graduates |
| Computers & Mathematics | 544 | 5.8% |
| Bio, Nature & Agricultural | 297 | 3.2% |
| Physical & Health Sciences | 283 | 3.0% |
| Psychology | 569 | 6.0% |
| Social Sciences | 1,780 | 18.9% |
| Engineering | 405 | 4.3% |
| Multidisciplinary Studies | 43 | 0.5% |
| Science & Technology | 416 | 4.4% |
| Business | 2,192 | 23.3% |
| Education | 471 | 5.0% |
| Literature & Languages | 762 | 8.1% |
| Liberal Arts & History | 669 | 7.1% |
| Visual & Performing Arts | 326 | 3.5% |
| Communications | 328 | 3.5% |
| Arts & Humanities | 318 | 3.4% |
| Total | 9,403 | 100.0% |
Transportation & Commute in Rye
Vehicle Availability by Sex in Rye
The most prevalent vehicle ownership categories in Rye are males with 2 vehicles (2,017, accounting for 48.4%) and females with 2 vehicles (1,327, making up 61.5%).
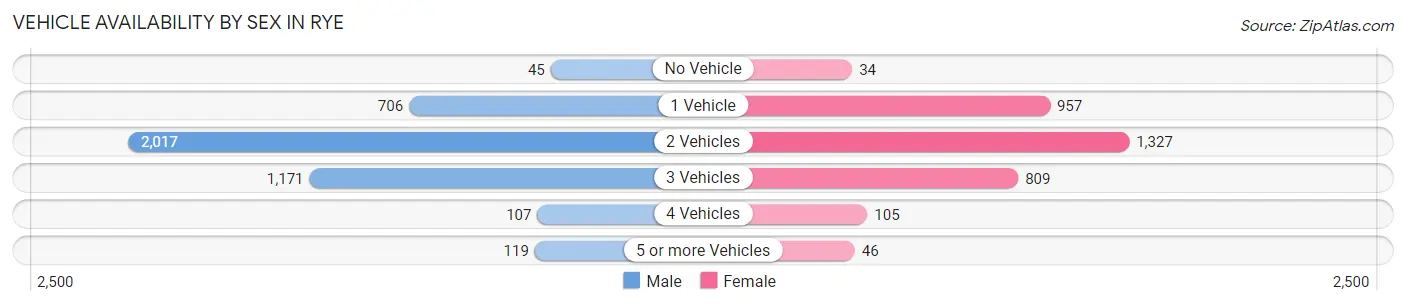
| Vehicles Available | Male | Female |
| No Vehicle | 45 (1.1%) | 34 (1.0%) |
| 1 Vehicle | 706 (17.0%) | 957 (29.2%) |
| 2 Vehicles | 2,017 (48.4%) | 1,327 (40.5%) |
| 3 Vehicles | 1,171 (28.1%) | 809 (24.7%) |
| 4 Vehicles | 107 (2.6%) | 105 (3.2%) |
| 5 or more Vehicles | 119 (2.9%) | 46 (1.4%) |
| Total | 4,165 (100.0%) | 3,278 (100.0%) |
Commute Time in Rye
The most frequently occuring commute durations in Rye are 60 to 89 minutes (1,702 commuters, 30.3%), 5 to 9 minutes (672 commuters, 12.0%), and 15 to 19 minutes (658 commuters, 11.7%).
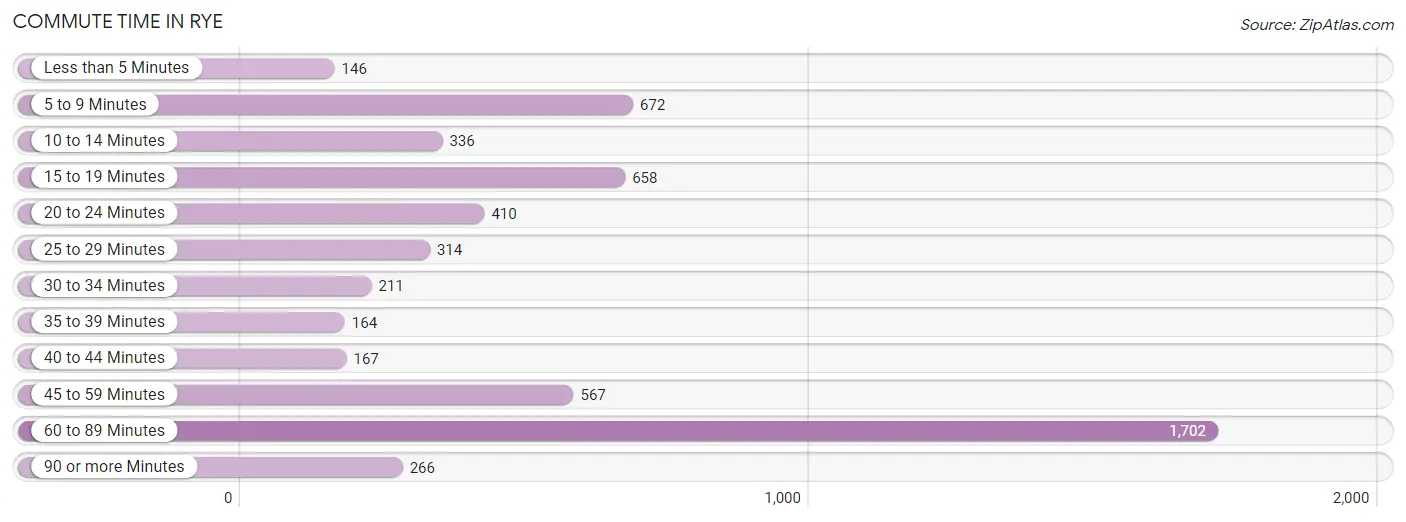
| Commute Time | # Commuters | % Commuters |
| Less than 5 Minutes | 146 | 2.6% |
| 5 to 9 Minutes | 672 | 12.0% |
| 10 to 14 Minutes | 336 | 6.0% |
| 15 to 19 Minutes | 658 | 11.7% |
| 20 to 24 Minutes | 410 | 7.3% |
| 25 to 29 Minutes | 314 | 5.6% |
| 30 to 34 Minutes | 211 | 3.8% |
| 35 to 39 Minutes | 164 | 2.9% |
| 40 to 44 Minutes | 167 | 3.0% |
| 45 to 59 Minutes | 567 | 10.1% |
| 60 to 89 Minutes | 1,702 | 30.3% |
| 90 or more Minutes | 266 | 4.7% |
Commute Time by Sex in Rye
The most common commute times in Rye are 60 to 89 minutes (1,392 commuters, 42.5%) for males and 5 to 9 minutes (402 commuters, 17.2%) for females.
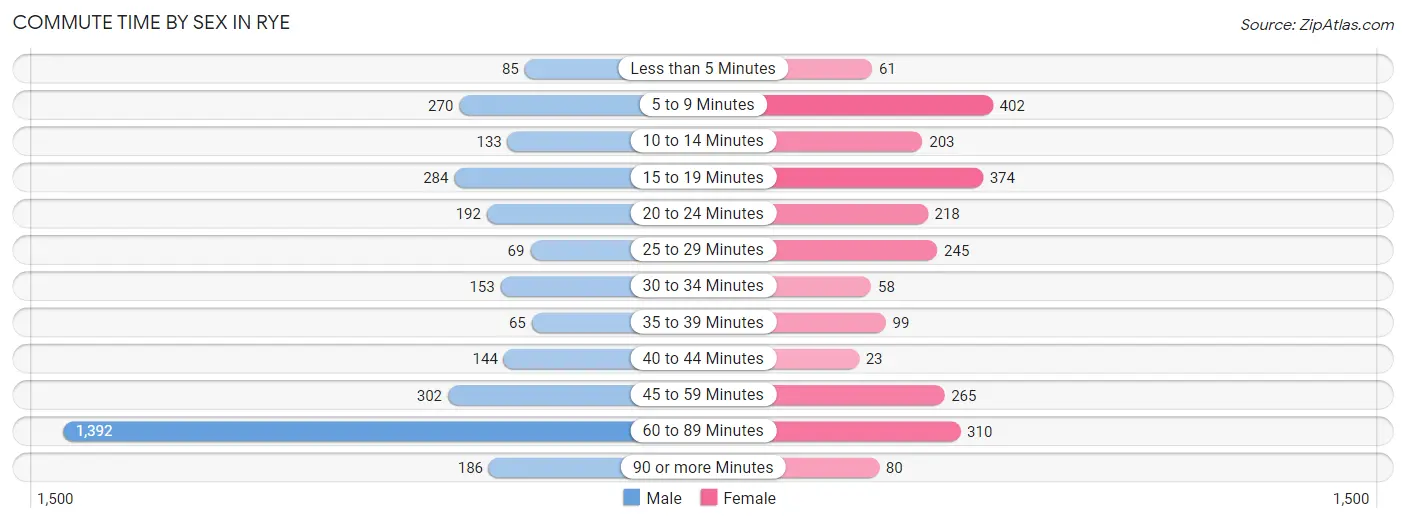
| Commute Time | Male | Female |
| Less than 5 Minutes | 85 (2.6%) | 61 (2.6%) |
| 5 to 9 Minutes | 270 (8.2%) | 402 (17.2%) |
| 10 to 14 Minutes | 133 (4.1%) | 203 (8.7%) |
| 15 to 19 Minutes | 284 (8.7%) | 374 (16.0%) |
| 20 to 24 Minutes | 192 (5.9%) | 218 (9.3%) |
| 25 to 29 Minutes | 69 (2.1%) | 245 (10.5%) |
| 30 to 34 Minutes | 153 (4.7%) | 58 (2.5%) |
| 35 to 39 Minutes | 65 (2.0%) | 99 (4.2%) |
| 40 to 44 Minutes | 144 (4.4%) | 23 (1.0%) |
| 45 to 59 Minutes | 302 (9.2%) | 265 (11.3%) |
| 60 to 89 Minutes | 1,392 (42.5%) | 310 (13.3%) |
| 90 or more Minutes | 186 (5.7%) | 80 (3.4%) |
Time of Departure to Work by Sex in Rye
The most frequent times of departure to work in Rye are 7:30 AM to 7:59 AM (751, 22.9%) for males and 7:30 AM to 7:59 AM (511, 21.9%) for females.
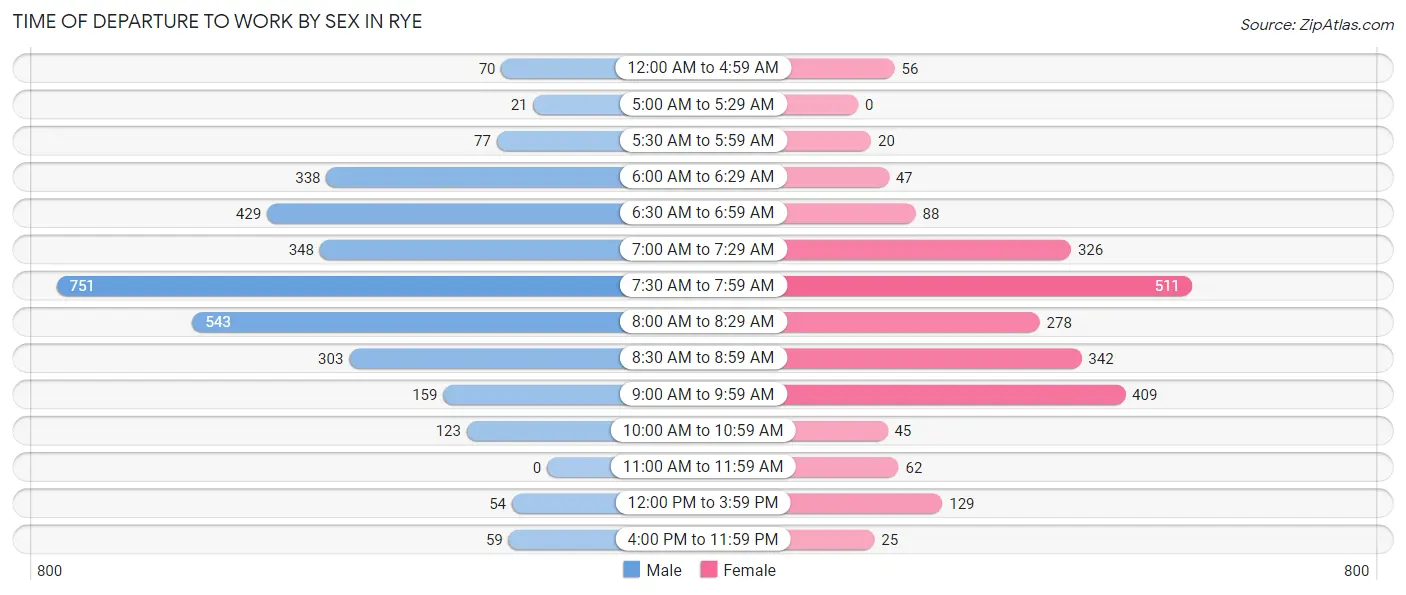
| Time of Departure | Male | Female |
| 12:00 AM to 4:59 AM | 70 (2.1%) | 56 (2.4%) |
| 5:00 AM to 5:29 AM | 21 (0.6%) | 0 (0.0%) |
| 5:30 AM to 5:59 AM | 77 (2.4%) | 20 (0.9%) |
| 6:00 AM to 6:29 AM | 338 (10.3%) | 47 (2.0%) |
| 6:30 AM to 6:59 AM | 429 (13.1%) | 88 (3.8%) |
| 7:00 AM to 7:29 AM | 348 (10.6%) | 326 (13.9%) |
| 7:30 AM to 7:59 AM | 751 (22.9%) | 511 (21.9%) |
| 8:00 AM to 8:29 AM | 543 (16.6%) | 278 (11.9%) |
| 8:30 AM to 8:59 AM | 303 (9.2%) | 342 (14.6%) |
| 9:00 AM to 9:59 AM | 159 (4.9%) | 409 (17.5%) |
| 10:00 AM to 10:59 AM | 123 (3.8%) | 45 (1.9%) |
| 11:00 AM to 11:59 AM | 0 (0.0%) | 62 (2.6%) |
| 12:00 PM to 3:59 PM | 54 (1.7%) | 129 (5.5%) |
| 4:00 PM to 11:59 PM | 59 (1.8%) | 25 (1.1%) |
| Total | 3,275 (100.0%) | 2,338 (100.0%) |
Housing Occupancy in Rye
Occupancy by Ownership in Rye
Of the total 5,880 dwellings in Rye, owner-occupied units account for 4,192 (71.3%), while renter-occupied units make up 1,688 (28.7%).
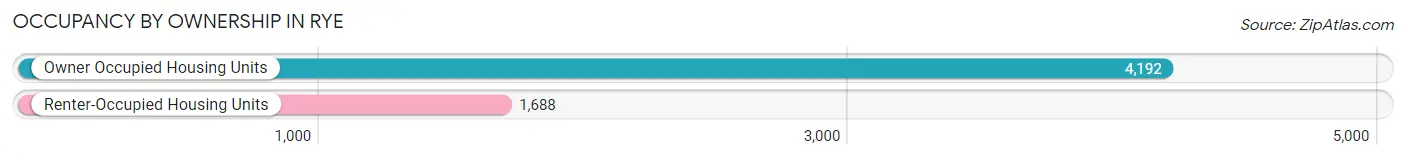
| Occupancy | # Housing Units | % Housing Units |
| Owner Occupied Housing Units | 4,192 | 71.3% |
| Renter-Occupied Housing Units | 1,688 | 28.7% |
| Total Occupied Housing Units | 5,880 | 100.0% |
Occupancy by Household Size in Rye
| Household Size | # Housing Units | % Housing Units |
| 1-Person Household | 1,318 | 22.4% |
| 2-Person Household | 1,420 | 24.1% |
| 3-Person Household | 991 | 16.9% |
| 4+ Person Household | 2,151 | 36.6% |
| Total Housing Units | 5,880 | 100.0% |
Occupancy by Ownership by Household Size in Rye
| Household Size | Owner-occupied | Renter-occupied |
| 1-Person Household | 740 (56.1%) | 578 (43.9%) |
| 2-Person Household | 959 (67.5%) | 461 (32.5%) |
| 3-Person Household | 772 (77.9%) | 219 (22.1%) |
| 4+ Person Household | 1,721 (80.0%) | 430 (20.0%) |
| Total Housing Units | 4,192 (71.3%) | 1,688 (28.7%) |
Occupancy by Educational Attainment in Rye
| Household Size | Owner-occupied | Renter-occupied |
| Less than High School | 13 (17.3%) | 62 (82.7%) |
| High School Diploma | 135 (50.4%) | 133 (49.6%) |
| College/Associate Degree | 395 (63.6%) | 226 (36.4%) |
| Bachelor's Degree or higher | 3,649 (74.2%) | 1,267 (25.8%) |
Occupancy by Age of Householder in Rye
| Age Bracket | # Households | % Households |
| Under 35 Years | 250 | 4.3% |
| 35 to 44 Years | 1,209 | 20.6% |
| 45 to 54 Years | 1,654 | 28.1% |
| 55 to 64 Years | 1,200 | 20.4% |
| 65 to 74 Years | 628 | 10.7% |
| 75 to 84 Years | 424 | 7.2% |
| 85 Years and Over | 515 | 8.8% |
| Total | 5,880 | 100.0% |
Housing Finances in Rye
Median Income by Occupancy in Rye
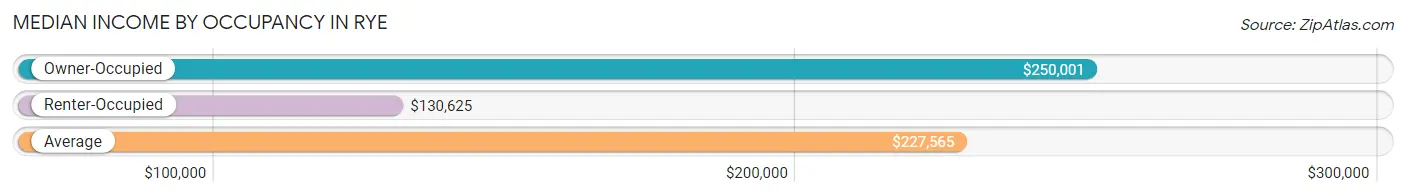
| Occupancy Type | # Households | Median Income |
| Owner-Occupied | 4,192 (71.3%) | $250,001 |
| Renter-Occupied | 1,688 (28.7%) | $130,625 |
| Average | 5,880 (100.0%) | $227,565 |
Occupancy by Householder Income Bracket in Rye
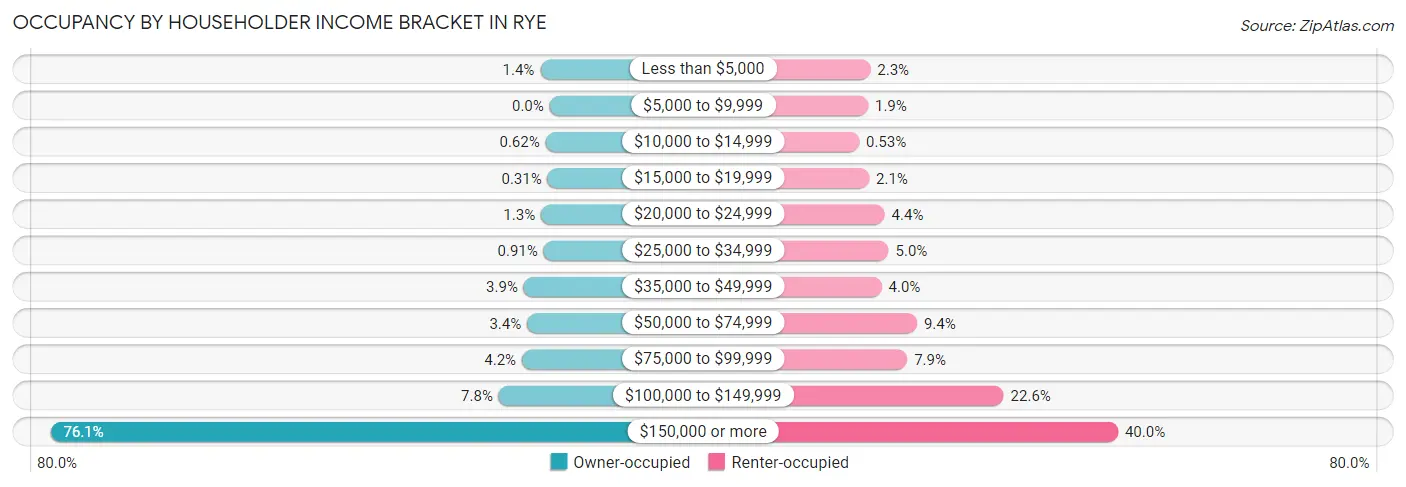
| Income Bracket | Owner-occupied | Renter-occupied |
| Less than $5,000 | 60 (1.4%) | 38 (2.2%) |
| $5,000 to $9,999 | 0 (0.0%) | 32 (1.9%) |
| $10,000 to $14,999 | 26 (0.6%) | 9 (0.5%) |
| $15,000 to $19,999 | 13 (0.3%) | 35 (2.1%) |
| $20,000 to $24,999 | 55 (1.3%) | 75 (4.4%) |
| $25,000 to $34,999 | 38 (0.9%) | 85 (5.0%) |
| $35,000 to $49,999 | 165 (3.9%) | 67 (4.0%) |
| $50,000 to $74,999 | 144 (3.4%) | 158 (9.4%) |
| $75,000 to $99,999 | 177 (4.2%) | 133 (7.9%) |
| $100,000 to $149,999 | 325 (7.7%) | 381 (22.6%) |
| $150,000 or more | 3,189 (76.1%) | 675 (40.0%) |
| Total | 4,192 (100.0%) | 1,688 (100.0%) |
Monthly Housing Cost Tiers in Rye
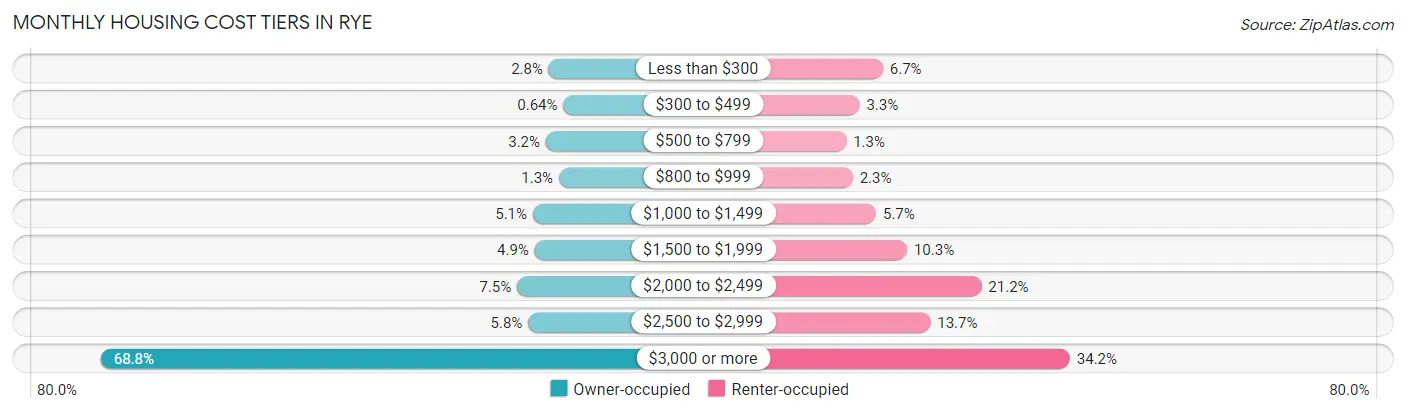
| Monthly Cost | Owner-occupied | Renter-occupied |
| Less than $300 | 117 (2.8%) | 113 (6.7%) |
| $300 to $499 | 27 (0.6%) | 55 (3.3%) |
| $500 to $799 | 135 (3.2%) | 22 (1.3%) |
| $800 to $999 | 54 (1.3%) | 38 (2.2%) |
| $1,000 to $1,499 | 215 (5.1%) | 96 (5.7%) |
| $1,500 to $1,999 | 204 (4.9%) | 173 (10.2%) |
| $2,000 to $2,499 | 313 (7.5%) | 358 (21.2%) |
| $2,500 to $2,999 | 244 (5.8%) | 231 (13.7%) |
| $3,000 or more | 2,883 (68.8%) | 578 (34.2%) |
| Total | 4,192 (100.0%) | 1,688 (100.0%) |
Physical Housing Characteristics in Rye
Housing Structures in Rye
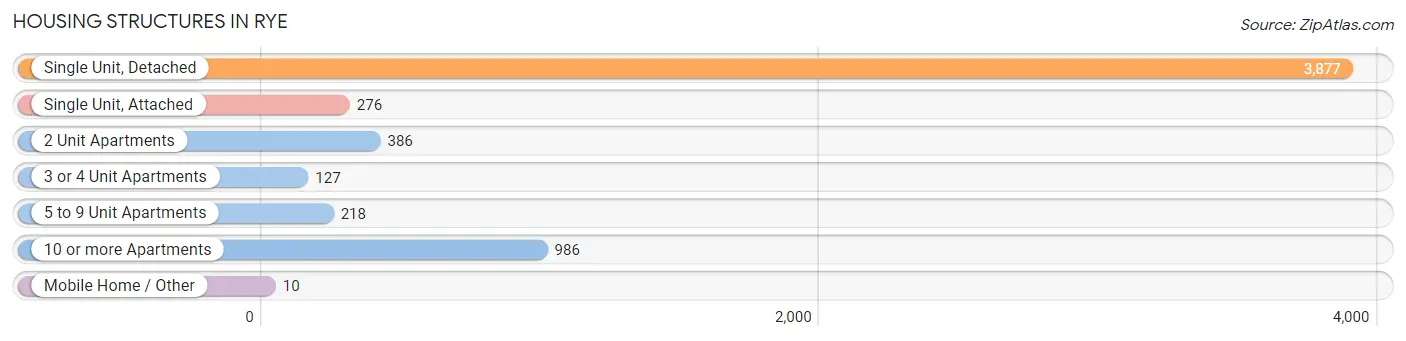
| Structure Type | # Housing Units | % Housing Units |
| Single Unit, Detached | 3,877 | 65.9% |
| Single Unit, Attached | 276 | 4.7% |
| 2 Unit Apartments | 386 | 6.6% |
| 3 or 4 Unit Apartments | 127 | 2.2% |
| 5 to 9 Unit Apartments | 218 | 3.7% |
| 10 or more Apartments | 986 | 16.8% |
| Mobile Home / Other | 10 | 0.2% |
| Total | 5,880 | 100.0% |
Housing Structures by Occupancy in Rye
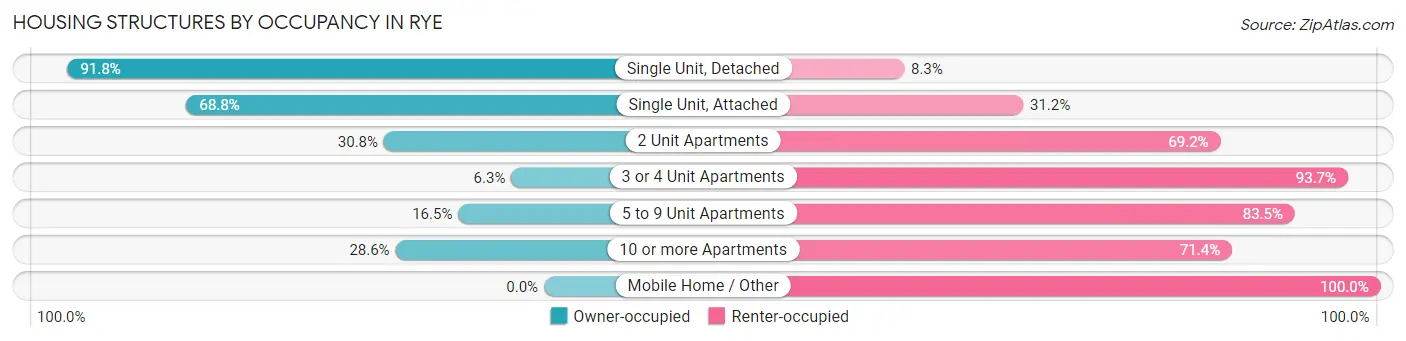
| Structure Type | Owner-occupied | Renter-occupied |
| Single Unit, Detached | 3,557 (91.7%) | 320 (8.3%) |
| Single Unit, Attached | 190 (68.8%) | 86 (31.2%) |
| 2 Unit Apartments | 119 (30.8%) | 267 (69.2%) |
| 3 or 4 Unit Apartments | 8 (6.3%) | 119 (93.7%) |
| 5 to 9 Unit Apartments | 36 (16.5%) | 182 (83.5%) |
| 10 or more Apartments | 282 (28.6%) | 704 (71.4%) |
| Mobile Home / Other | 0 (0.0%) | 10 (100.0%) |
| Total | 4,192 (71.3%) | 1,688 (28.7%) |
Housing Structures by Number of Rooms in Rye
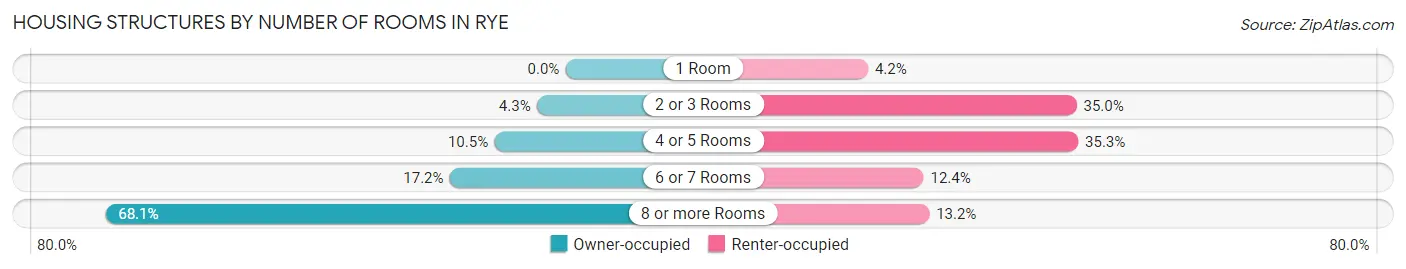
| Number of Rooms | Owner-occupied | Renter-occupied |
| 1 Room | 0 (0.0%) | 70 (4.2%) |
| 2 or 3 Rooms | 178 (4.3%) | 591 (35.0%) |
| 4 or 5 Rooms | 442 (10.5%) | 595 (35.2%) |
| 6 or 7 Rooms | 719 (17.2%) | 209 (12.4%) |
| 8 or more Rooms | 2,853 (68.1%) | 223 (13.2%) |
| Total | 4,192 (100.0%) | 1,688 (100.0%) |
Housing Structure by Heating Type in Rye
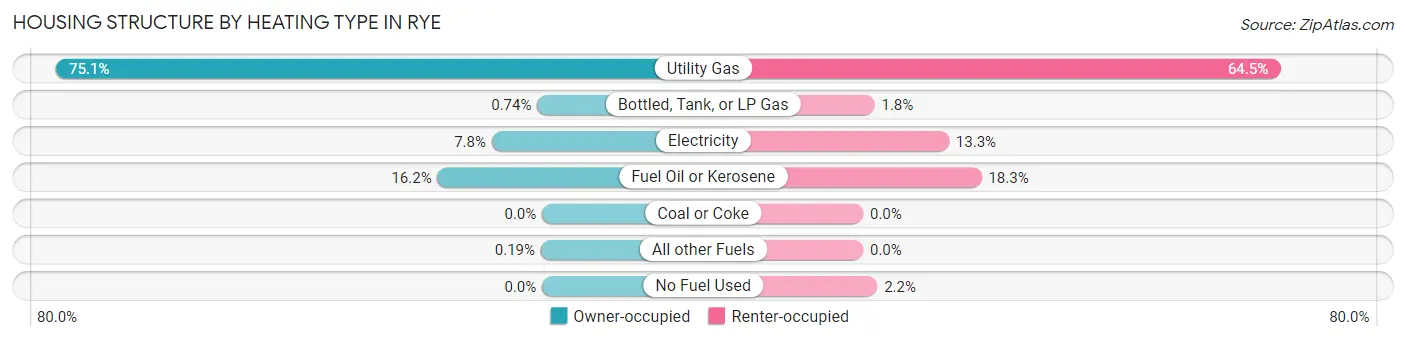
| Heating Type | Owner-occupied | Renter-occupied |
| Utility Gas | 3,149 (75.1%) | 1,088 (64.4%) |
| Bottled, Tank, or LP Gas | 31 (0.7%) | 30 (1.8%) |
| Electricity | 326 (7.8%) | 224 (13.3%) |
| Fuel Oil or Kerosene | 678 (16.2%) | 309 (18.3%) |
| Coal or Coke | 0 (0.0%) | 0 (0.0%) |
| All other Fuels | 8 (0.2%) | 0 (0.0%) |
| No Fuel Used | 0 (0.0%) | 37 (2.2%) |
| Total | 4,192 (100.0%) | 1,688 (100.0%) |
Household Vehicle Usage in Rye
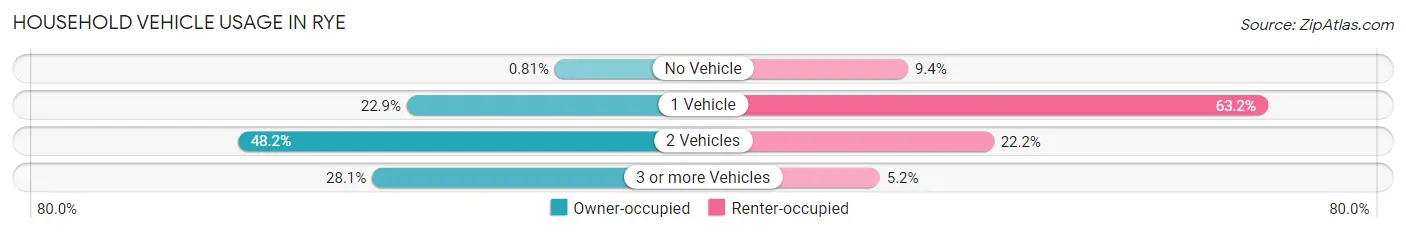
| Vehicles per Household | Owner-occupied | Renter-occupied |
| No Vehicle | 34 (0.8%) | 159 (9.4%) |
| 1 Vehicle | 961 (22.9%) | 1,066 (63.1%) |
| 2 Vehicles | 2,019 (48.2%) | 375 (22.2%) |
| 3 or more Vehicles | 1,178 (28.1%) | 88 (5.2%) |
| Total | 4,192 (100.0%) | 1,688 (100.0%) |
Real Estate & Mortgages in Rye
Real Estate and Mortgage Overview in Rye
| Characteristic | Without Mortgage | With Mortgage |
| Housing Units | 1,490 | 2,702 |
| Median Property Value | $1,242,900 | $1,906,500 |
| Median Household Income | $196,750 | $2,293 |
| Monthly Housing Costs | $1,501 | $2,396 |
| Real Estate Taxes | $10,001 | $96 |
Property Value by Mortgage Status in Rye
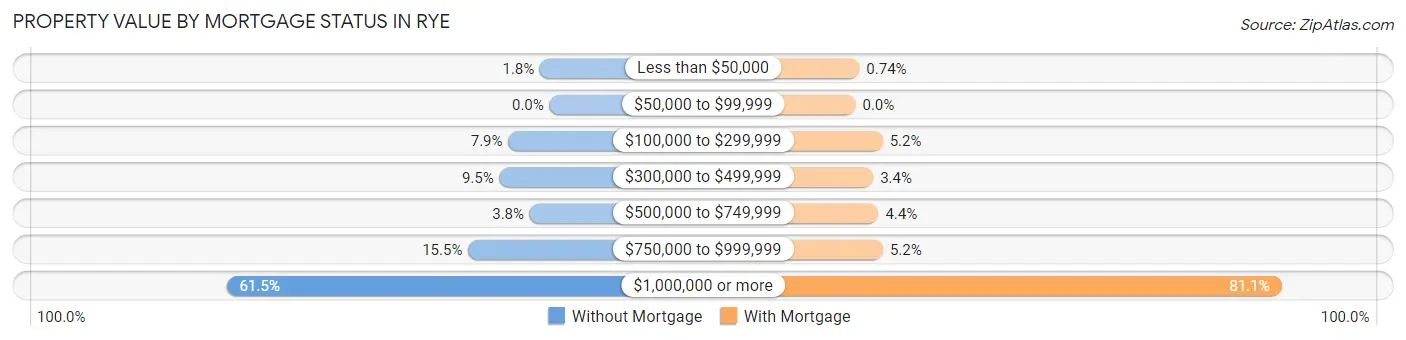
| Property Value | Without Mortgage | With Mortgage |
| Less than $50,000 | 27 (1.8%) | 20 (0.7%) |
| $50,000 to $99,999 | 0 (0.0%) | 0 (0.0%) |
| $100,000 to $299,999 | 117 (7.9%) | 140 (5.2%) |
| $300,000 to $499,999 | 142 (9.5%) | 91 (3.4%) |
| $500,000 to $749,999 | 56 (3.8%) | 118 (4.4%) |
| $750,000 to $999,999 | 231 (15.5%) | 141 (5.2%) |
| $1,000,000 or more | 917 (61.5%) | 2,192 (81.1%) |
| Total | 1,490 (100.0%) | 2,702 (100.0%) |
Household Income by Mortgage Status in Rye
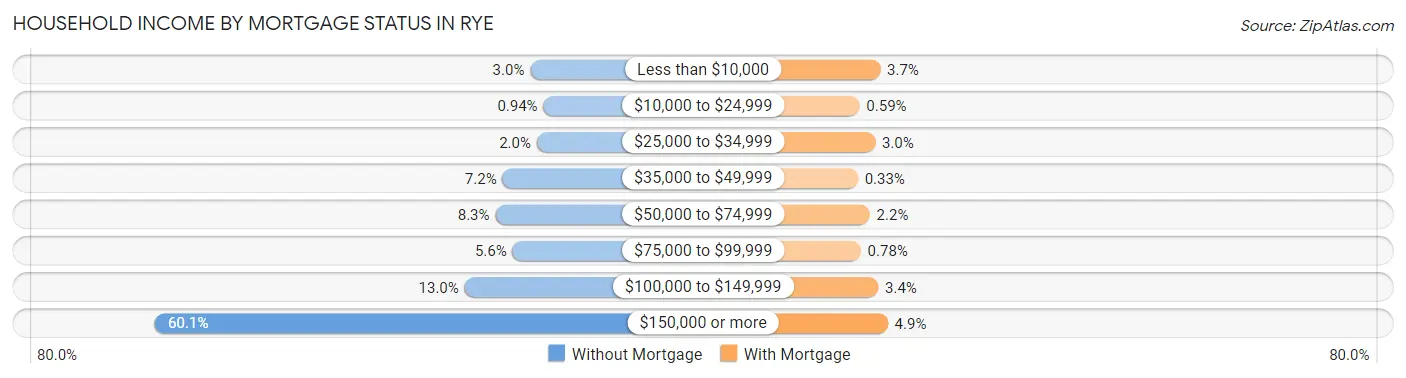
| Household Income | Without Mortgage | With Mortgage |
| Less than $10,000 | 44 (2.9%) | 101 (3.7%) |
| $10,000 to $24,999 | 14 (0.9%) | 16 (0.6%) |
| $25,000 to $34,999 | 29 (1.9%) | 80 (3.0%) |
| $35,000 to $49,999 | 107 (7.2%) | 9 (0.3%) |
| $50,000 to $74,999 | 123 (8.3%) | 58 (2.1%) |
| $75,000 to $99,999 | 84 (5.6%) | 21 (0.8%) |
| $100,000 to $149,999 | 193 (13.0%) | 93 (3.4%) |
| $150,000 or more | 896 (60.1%) | 132 (4.9%) |
| Total | 1,490 (100.0%) | 2,702 (100.0%) |
Property Value to Household Income Ratio in Rye
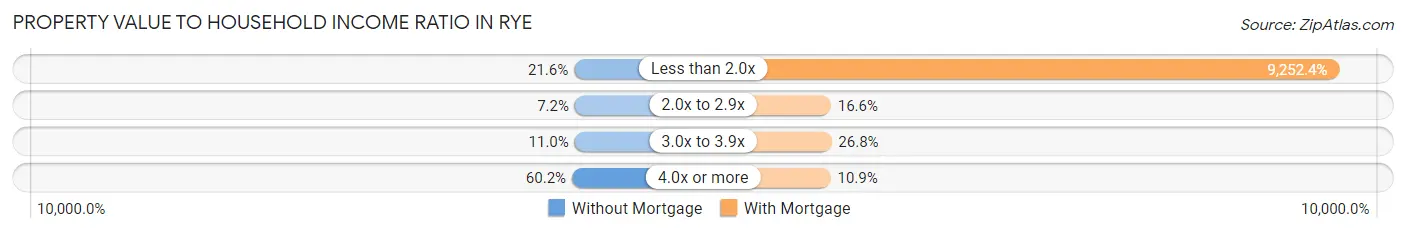
| Value-to-Income Ratio | Without Mortgage | With Mortgage |
| Less than 2.0x | 322 (21.6%) | 250,001 (9,252.4%) |
| 2.0x to 2.9x | 107 (7.2%) | 448 (16.6%) |
| 3.0x to 3.9x | 164 (11.0%) | 724 (26.8%) |
| 4.0x or more | 897 (60.2%) | 295 (10.9%) |
| Total | 1,490 (100.0%) | 2,702 (100.0%) |
Real Estate Taxes by Mortgage Status in Rye
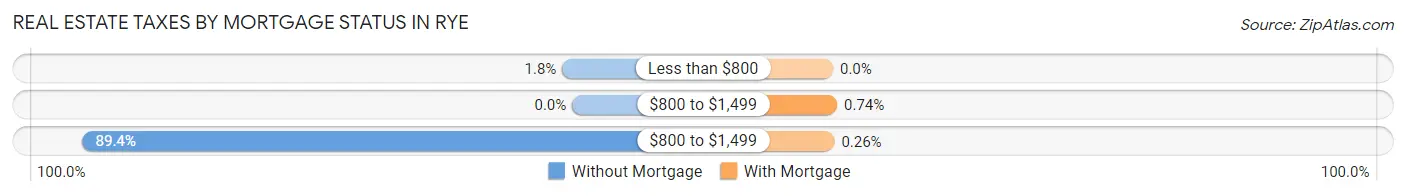
| Property Taxes | Without Mortgage | With Mortgage |
| Less than $800 | 27 (1.8%) | 0 (0.0%) |
| $800 to $1,499 | 0 (0.0%) | 20 (0.7%) |
| $800 to $1,499 | 1,332 (89.4%) | 7 (0.3%) |
| Total | 1,490 (100.0%) | 2,702 (100.0%) |
Health & Disability in Rye
Health Insurance Coverage by Age in Rye
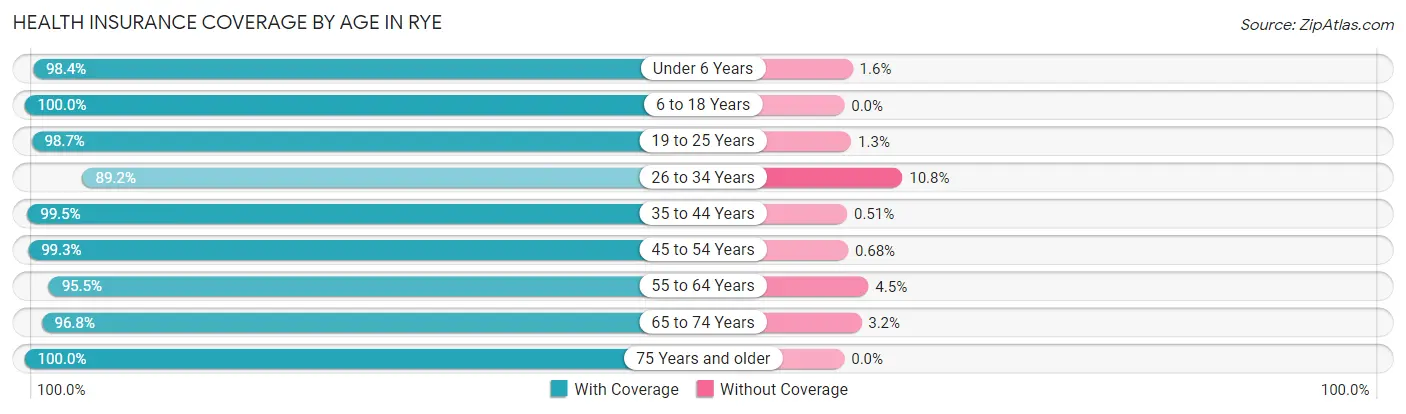
| Age Bracket | With Coverage | Without Coverage |
| Under 6 Years | 1,007 (98.4%) | 16 (1.6%) |
| 6 to 18 Years | 4,088 (100.0%) | 0 (0.0%) |
| 19 to 25 Years | 928 (98.7%) | 12 (1.3%) |
| 26 to 34 Years | 585 (89.2%) | 71 (10.8%) |
| 35 to 44 Years | 2,332 (99.5%) | 12 (0.5%) |
| 45 to 54 Years | 2,913 (99.3%) | 20 (0.7%) |
| 55 to 64 Years | 1,910 (95.5%) | 90 (4.5%) |
| 65 to 74 Years | 1,037 (96.8%) | 34 (3.2%) |
| 75 Years and older | 1,278 (100.0%) | 0 (0.0%) |
| Total | 16,078 (98.4%) | 255 (1.6%) |
Health Insurance Coverage by Citizenship Status in Rye
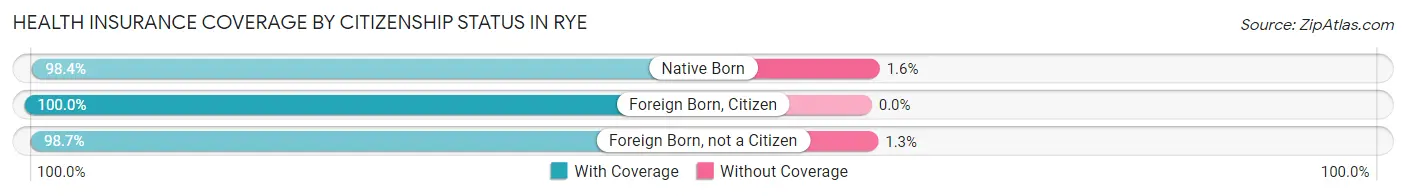
| Citizenship Status | With Coverage | Without Coverage |
| Native Born | 1,007 (98.4%) | 16 (1.6%) |
| Foreign Born, Citizen | 4,088 (100.0%) | 0 (0.0%) |
| Foreign Born, not a Citizen | 928 (98.7%) | 12 (1.3%) |
Health Insurance Coverage by Household Income in Rye
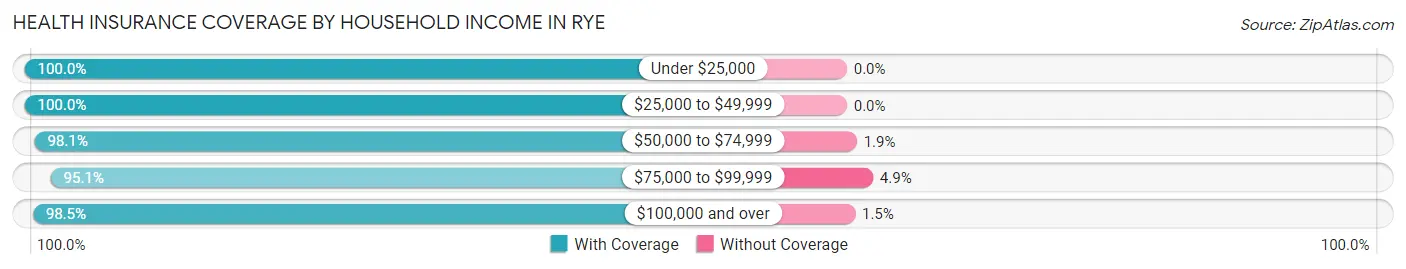
| Household Income | With Coverage | Without Coverage |
| Under $25,000 | 559 (100.0%) | 0 (0.0%) |
| $25,000 to $49,999 | 474 (100.0%) | 0 (0.0%) |
| $50,000 to $74,999 | 632 (98.1%) | 12 (1.9%) |
| $75,000 to $99,999 | 506 (95.1%) | 26 (4.9%) |
| $100,000 and over | 13,868 (98.5%) | 217 (1.5%) |
Public vs Private Health Insurance Coverage by Age in Rye
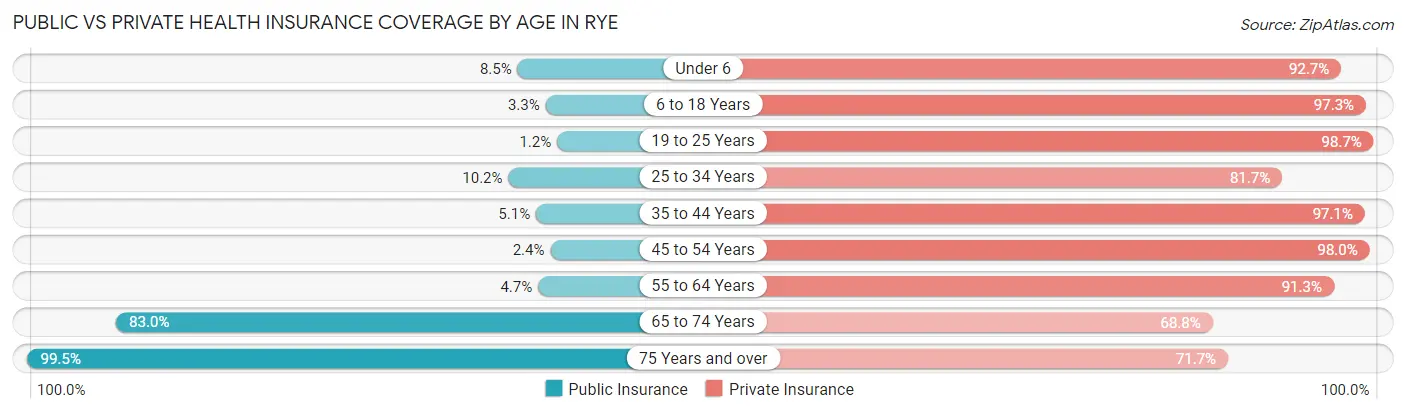
| Age Bracket | Public Insurance | Private Insurance |
| Under 6 | 87 (8.5%) | 948 (92.7%) |
| 6 to 18 Years | 135 (3.3%) | 3,977 (97.3%) |
| 19 to 25 Years | 11 (1.2%) | 928 (98.7%) |
| 25 to 34 Years | 67 (10.2%) | 536 (81.7%) |
| 35 to 44 Years | 119 (5.1%) | 2,275 (97.1%) |
| 45 to 54 Years | 71 (2.4%) | 2,873 (98.0%) |
| 55 to 64 Years | 94 (4.7%) | 1,826 (91.3%) |
| 65 to 74 Years | 889 (83.0%) | 737 (68.8%) |
| 75 Years and over | 1,271 (99.5%) | 916 (71.7%) |
| Total | 2,744 (16.8%) | 15,016 (91.9%) |
Disability Status by Sex by Age in Rye
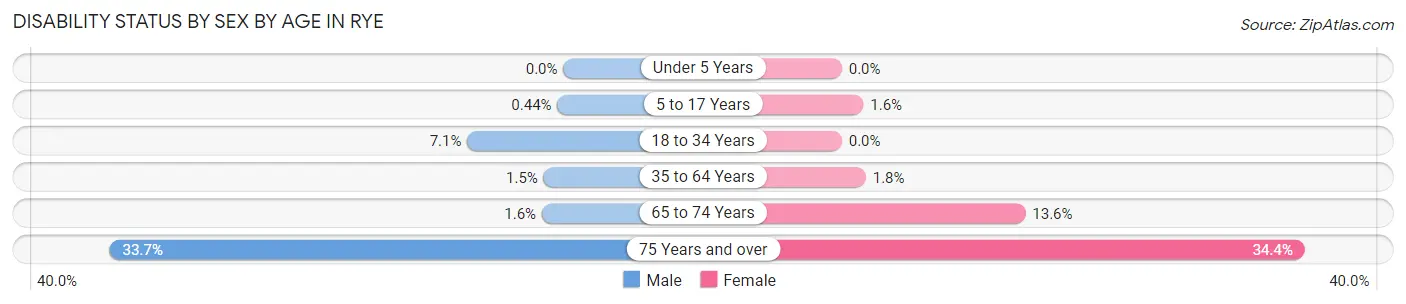
| Age Bracket | Male | Female |
| Under 5 Years | 0 (0.0%) | 0 (0.0%) |
| 5 to 17 Years | 9 (0.4%) | 33 (1.6%) |
| 18 to 34 Years | 81 (7.1%) | 0 (0.0%) |
| 35 to 64 Years | 53 (1.5%) | 65 (1.8%) |
| 65 to 74 Years | 7 (1.6%) | 86 (13.6%) |
| 75 Years and over | 159 (33.7%) | 277 (34.4%) |
Disability Class by Sex by Age in Rye
Disability Class: Hearing Difficulty
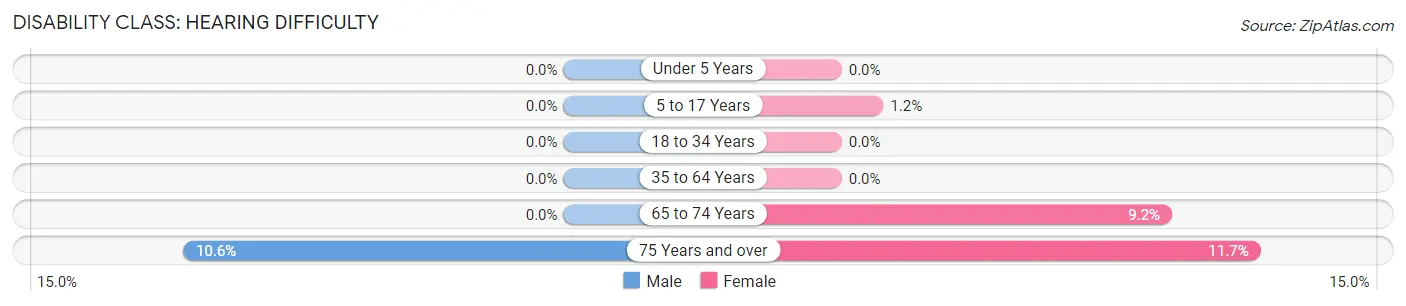
| Age Bracket | Male | Female |
| Under 5 Years | 0 (0.0%) | 0 (0.0%) |
| 5 to 17 Years | 0 (0.0%) | 24 (1.2%) |
| 18 to 34 Years | 0 (0.0%) | 0 (0.0%) |
| 35 to 64 Years | 0 (0.0%) | 0 (0.0%) |
| 65 to 74 Years | 0 (0.0%) | 58 (9.2%) |
| 75 Years and over | 50 (10.6%) | 94 (11.7%) |
Disability Class: Vision Difficulty
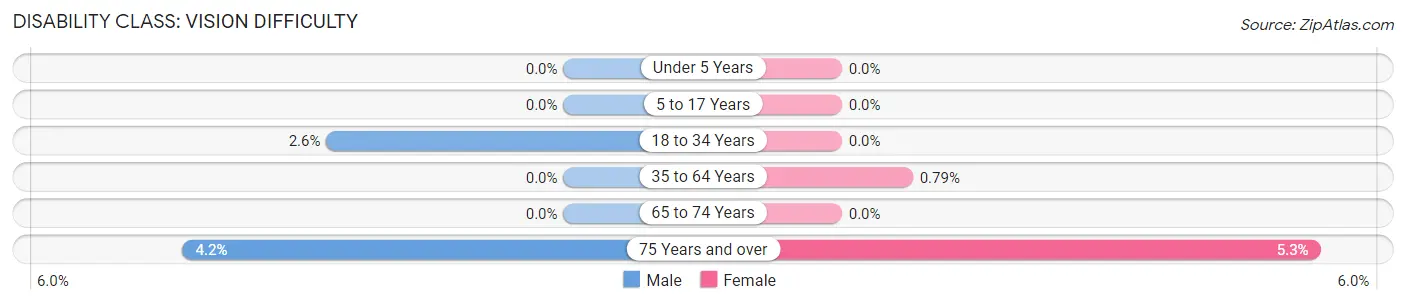
| Age Bracket | Male | Female |
| Under 5 Years | 0 (0.0%) | 0 (0.0%) |
| 5 to 17 Years | 0 (0.0%) | 0 (0.0%) |
| 18 to 34 Years | 30 (2.6%) | 0 (0.0%) |
| 35 to 64 Years | 0 (0.0%) | 29 (0.8%) |
| 65 to 74 Years | 0 (0.0%) | 0 (0.0%) |
| 75 Years and over | 20 (4.2%) | 43 (5.3%) |
Disability Class: Cognitive Difficulty
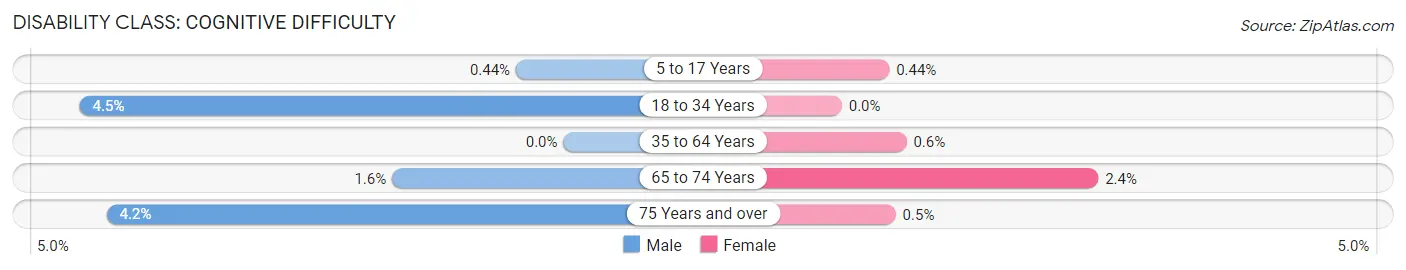
| Age Bracket | Male | Female |
| 5 to 17 Years | 9 (0.4%) | 9 (0.4%) |
| 18 to 34 Years | 51 (4.5%) | 0 (0.0%) |
| 35 to 64 Years | 0 (0.0%) | 22 (0.6%) |
| 65 to 74 Years | 7 (1.6%) | 15 (2.4%) |
| 75 Years and over | 20 (4.2%) | 4 (0.5%) |
Disability Class: Ambulatory Difficulty
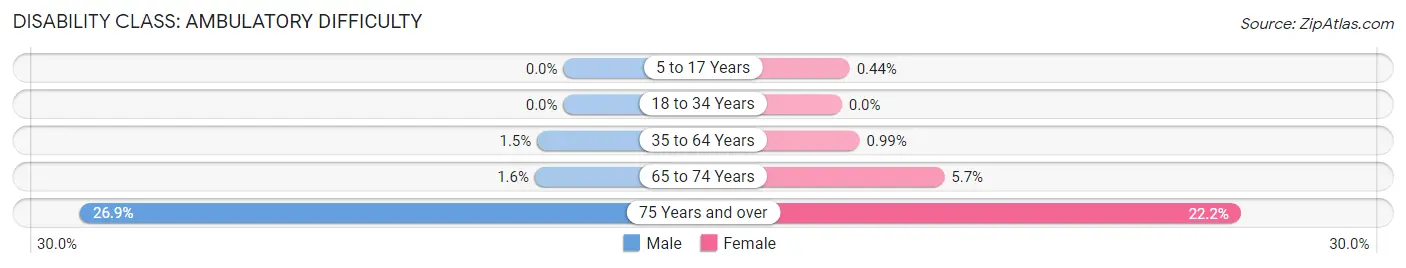
| Age Bracket | Male | Female |
| 5 to 17 Years | 0 (0.0%) | 9 (0.4%) |
| 18 to 34 Years | 0 (0.0%) | 0 (0.0%) |
| 35 to 64 Years | 53 (1.5%) | 36 (1.0%) |
| 65 to 74 Years | 7 (1.6%) | 36 (5.7%) |
| 75 Years and over | 127 (26.9%) | 179 (22.2%) |
Disability Class: Self-Care Difficulty
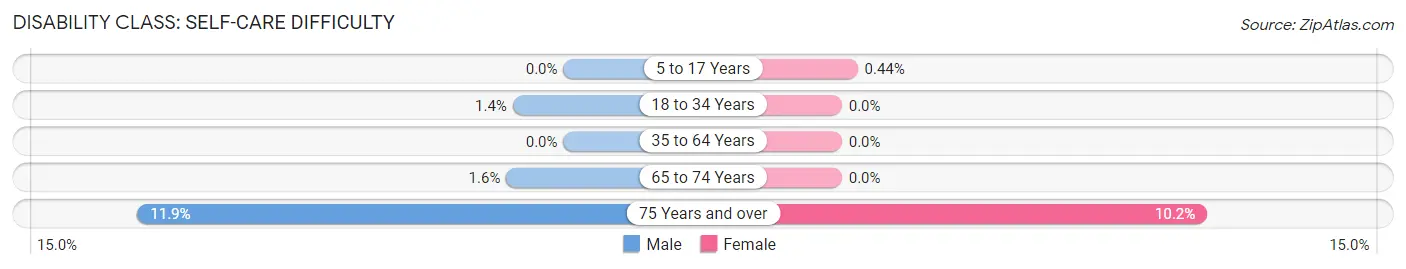
| Age Bracket | Male | Female |
| 5 to 17 Years | 0 (0.0%) | 9 (0.4%) |
| 18 to 34 Years | 16 (1.4%) | 0 (0.0%) |
| 35 to 64 Years | 0 (0.0%) | 0 (0.0%) |
| 65 to 74 Years | 7 (1.6%) | 0 (0.0%) |
| 75 Years and over | 56 (11.9%) | 82 (10.2%) |
Technology Access in Rye
Computing Device Access in Rye
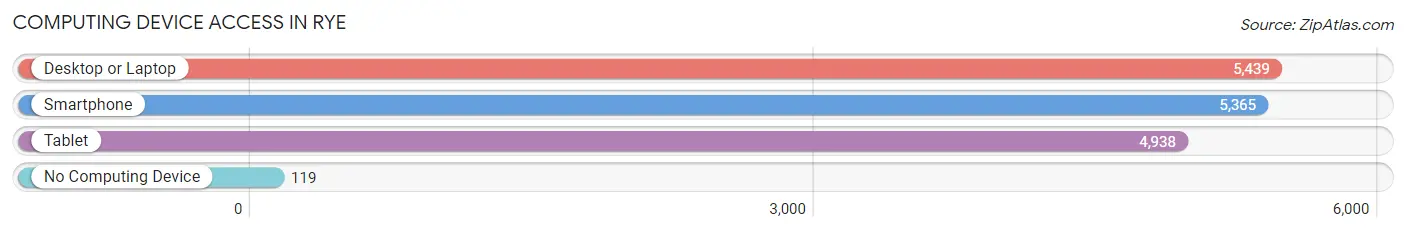
| Device Type | # Households | % Households |
| Desktop or Laptop | 5,439 | 92.5% |
| Smartphone | 5,365 | 91.2% |
| Tablet | 4,938 | 84.0% |
| No Computing Device | 119 | 2.0% |
| Total | 5,880 | 100.0% |
Internet Access in Rye
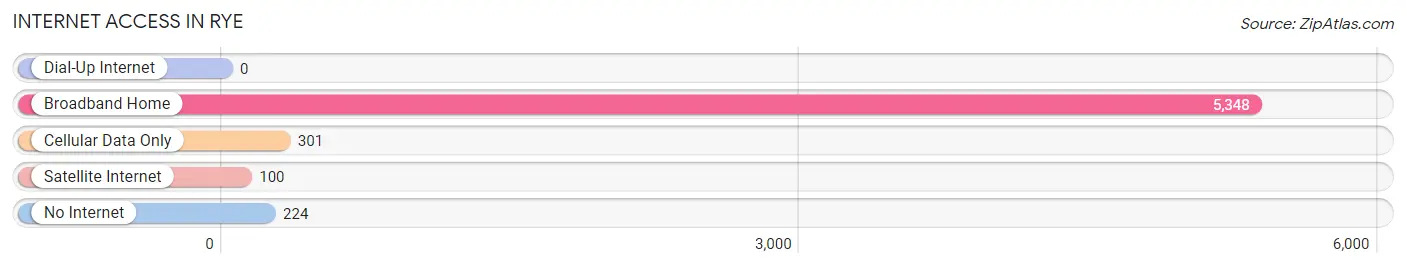
| Internet Type | # Households | % Households |
| Dial-Up Internet | 0 | 0.0% |
| Broadband Home | 5,348 | 90.9% |
| Cellular Data Only | 301 | 5.1% |
| Satellite Internet | 100 | 1.7% |
| No Internet | 224 | 3.8% |
| Total | 5,880 | 100.0% |
Rye Summary
Rye, New York is a city located in Westchester County, New York, United States. It is situated on the Long Island Sound, approximately 25 miles northeast of Manhattan. The city has a population of 15,720 as of the 2010 census.
History
Rye was first settled in 1660 by a group of English settlers from the New Haven Colony. The town was named after the city of Rye in England. The town was officially incorporated in 1683.
In the late 19th century, Rye became a popular summer resort for wealthy New Yorkers. The town was home to several grand estates, including the Jay Estate, which was owned by John Jay, the first Chief Justice of the United States.
In the early 20th century, Rye was a popular destination for wealthy New Yorkers looking to escape the hustle and bustle of the city. The town was home to several grand estates, including the Jay Estate, which was owned by John Jay, the first Chief Justice of the United States.
Geography
Rye is located in Westchester County, New York, on the Long Island Sound. It is bordered by the cities of Port Chester to the west, Harrison to the north, and Mamaroneck to the east. The city covers an area of 5.2 square miles, with a population density of 2,945 people per square mile.
Economy
Rye is a primarily residential community, with a small but vibrant business district. The city is home to several corporate headquarters, including the headquarters of PepsiCo, which is located in the city's downtown area.
The city is also home to several small businesses, including restaurants, retail stores, and professional services. The city is also home to several financial institutions, including JPMorgan Chase and Citibank.
Demographics
As of the 2010 census, Rye had a population of 15,720. The racial makeup of the city was 87.3% White, 5.2% African American, 0.2% Native American, 4.2% Asian, 0.1% Pacific Islander, and 2.2% from other races. Hispanic or Latino of any race were 6.7% of the population.
The median income for a household in the city was $117,837, and the median income for a family was $142,857. The per capita income for the city was $63,945.
Conclusion
Rye, New York is a city located in Westchester County, New York, United States. It is situated on the Long Island Sound, approximately 25 miles northeast of Manhattan. The city has a population of 15,720 as of the 2010 census. Rye was first settled in 1660 by a group of English settlers from the New Haven Colony. The town was named after the city of Rye in England. The town was officially incorporated in 1683. In the late 19th century, Rye became a popular summer resort for wealthy New Yorkers. The town was home to several grand estates, including the Jay Estate, which was owned by John Jay, the first Chief Justice of the United States. Rye is a primarily residential community, with a small but vibrant business district. The city is home to several corporate headquarters, including the headquarters of PepsiCo, which is located in the city's downtown area. As of the 2010 census, Rye had a population of 15,720. The racial makeup of the city was 87.3% White, 5.2% African American, 0.2% Native American, 4.2% Asian, 0.1% Pacific Islander, and 2.2% from other races. Hispanic or Latino of any race were 6.7% of the population. The median income for a household in the city was $117,837, and the median income for a family was $142,857. The per capita income for the city was $63,945.
Common Questions
What is Per Capita Income in Rye?
Per Capita income in Rye is $145,604.
What is the Median Family Income in Rye?
Median Family Income in Rye is $250,001.
What is the Median Household income in Rye?
Median Household Income in Rye is $227,565.
What is Income or Wage Gap in Rye?
Income or Wage Gap in Rye is 54.3%.
Women in Rye earn 45.7 cents for every dollar earned by a man.
What is Inequality or Gini Index in Rye?
Inequality or Gini Index in Rye is 0.53.
What is the Total Population of Rye?
Total Population of Rye is 16,447.
What is the Total Male Population of Rye?
Total Male Population of Rye is 8,188.
What is the Total Female Population of Rye?
Total Female Population of Rye is 8,259.
What is the Ratio of Males per 100 Females in Rye?
There are 99.14 Males per 100 Females in Rye.
What is the Ratio of Females per 100 Males in Rye?
There are 100.87 Females per 100 Males in Rye.
What is the Median Population Age in Rye?
Median Population Age in Rye is 42.2 Years.
What is the Average Family Size in Rye
Average Family Size in Rye is 3.3 People.
What is the Average Household Size in Rye
Average Household Size in Rye is 2.8 People.
How Large is the Labor Force in Rye?
There are 7,992 People in the Labor Forcein in Rye.
What is the Percentage of People in the Labor Force in Rye?
64.5% of People are in the Labor Force in Rye.
What is the Unemployment Rate in Rye?
Unemployment Rate in Rye is 5.2%.