Armonk, NY Map & Demographics
Armonk Map
Armonk Overview
$113,310
PER CAPITA INCOME
$240,208
AVG FAMILY INCOME
$234,688
AVG HOUSEHOLD INCOME
46.7%
WAGE / INCOME GAP [ % ]
53.3¢/ $1
WAGE / INCOME GAP [ $ ]
0.50
INEQUALITY / GINI INDEX
4,378
TOTAL POPULATION
2,262
MALE POPULATION
2,116
FEMALE POPULATION
106.90
MALES / 100 FEMALES
93.55
FEMALES / 100 MALES
42.6
MEDIAN AGE
3.2
AVG FAMILY SIZE
3.0
AVG HOUSEHOLD SIZE
2,124
LABOR FORCE [ PEOPLE ]
62.0%
PERCENT IN LABOR FORCE
1.3%
UNEMPLOYMENT RATE
Armonk Zip Codes
Armonk Area Codes
Income in Armonk
Income Overview in Armonk
Per Capita Income in Armonk is $113,310, while median incomes of families and households are $240,208 and $234,688 respectively.
| Characteristic | Number | Measure |
| Per Capita Income | 4,378 | $113,310 |
| Median Family Income | 1,265 | $240,208 |
| Mean Family Income | 1,265 | $361,140 |
| Median Household Income | 1,471 | $234,688 |
| Mean Household Income | 1,471 | $330,787 |
| Income Deficit | 1,265 | $0 |
| Wage / Income Gap (%) | 4,378 | 46.66% |
| Wage / Income Gap ($) | 4,378 | 53.34¢ per $1 |
| Gini / Inequality Index | 4,378 | 0.50 |
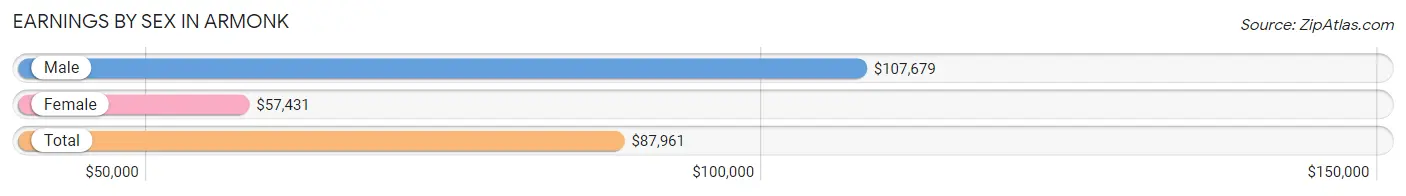
Earnings by Sex in Armonk
Average Earnings in Armonk are $87,961, $107,679 for men and $57,431 for women, a difference of 46.7%.
| Sex | Number | Average Earnings |
| Male | 1,383 (58.1%) | $107,679 |
| Female | 996 (41.9%) | $57,431 |
| Total | 2,379 (100.0%) | $87,961 |
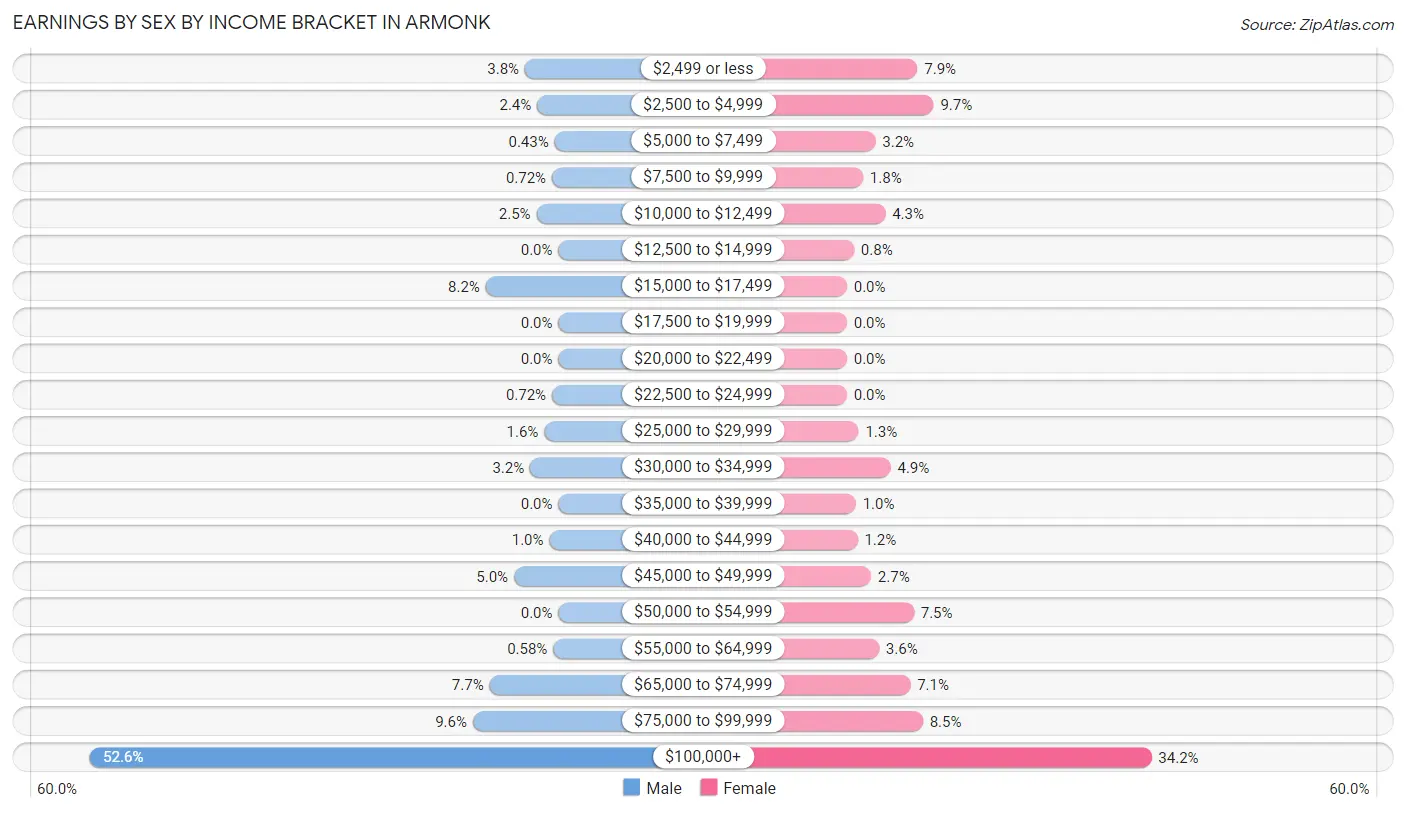
Earnings by Sex by Income Bracket in Armonk
The most common earnings brackets in Armonk are $100,000+ for men (728 | 52.6%) and $100,000+ for women (341 | 34.2%).
| Income | Male | Female |
| $2,499 or less | 52 (3.8%) | 79 (7.9%) |
| $2,500 to $4,999 | 33 (2.4%) | 97 (9.7%) |
| $5,000 to $7,499 | 6 (0.4%) | 32 (3.2%) |
| $7,500 to $9,999 | 10 (0.7%) | 18 (1.8%) |
| $10,000 to $12,499 | 34 (2.5%) | 43 (4.3%) |
| $12,500 to $14,999 | 0 (0.0%) | 8 (0.8%) |
| $15,000 to $17,499 | 113 (8.2%) | 0 (0.0%) |
| $17,500 to $19,999 | 0 (0.0%) | 0 (0.0%) |
| $20,000 to $22,499 | 0 (0.0%) | 0 (0.0%) |
| $22,500 to $24,999 | 10 (0.7%) | 0 (0.0%) |
| $25,000 to $29,999 | 22 (1.6%) | 13 (1.3%) |
| $30,000 to $34,999 | 44 (3.2%) | 49 (4.9%) |
| $35,000 to $39,999 | 0 (0.0%) | 10 (1.0%) |
| $40,000 to $44,999 | 14 (1.0%) | 12 (1.2%) |
| $45,000 to $49,999 | 69 (5.0%) | 27 (2.7%) |
| $50,000 to $54,999 | 0 (0.0%) | 75 (7.5%) |
| $55,000 to $64,999 | 8 (0.6%) | 36 (3.6%) |
| $65,000 to $74,999 | 107 (7.7%) | 71 (7.1%) |
| $75,000 to $99,999 | 133 (9.6%) | 85 (8.5%) |
| $100,000+ | 728 (52.6%) | 341 (34.2%) |
| Total | 1,383 (100.0%) | 996 (100.0%) |
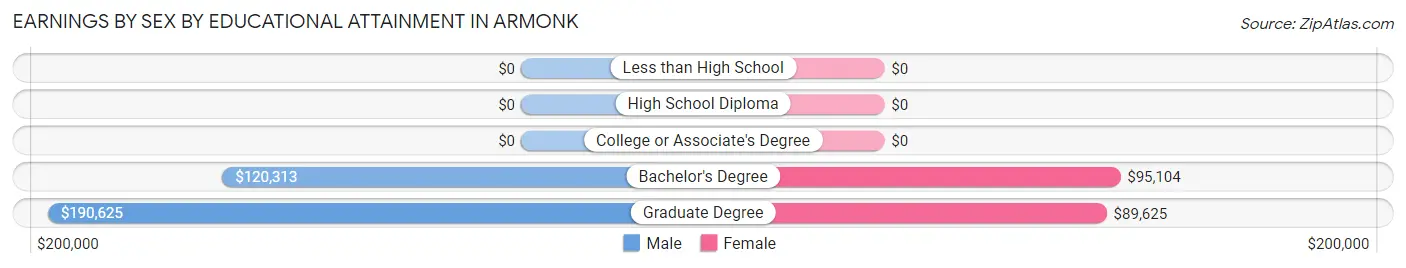
Earnings by Sex by Educational Attainment in Armonk
Average earnings in Armonk are $120,027 for men and $73,125 for women, a difference of 39.1%. Men with an educational attainment of graduate degree enjoy the highest average annual earnings of $190,625, while those with bachelor's degree education earn the least with $120,313. Women with an educational attainment of bachelor's degree earn the most with the average annual earnings of $95,104, while those with graduate degree education have the smallest earnings of $89,625.
| Educational Attainment | Male Income | Female Income |
| Less than High School | - | - |
| High School Diploma | - | - |
| College or Associate's Degree | - | - |
| Bachelor's Degree | $120,313 | $95,104 |
| Graduate Degree | $190,625 | $89,625 |
| Total | $120,027 | $73,125 |
Family Income in Armonk
Family Income Brackets in Armonk
According to the Armonk family income data, there are 797 families falling into the $200,000+ income range, which is the most common income bracket and makes up 63.0% of all families.
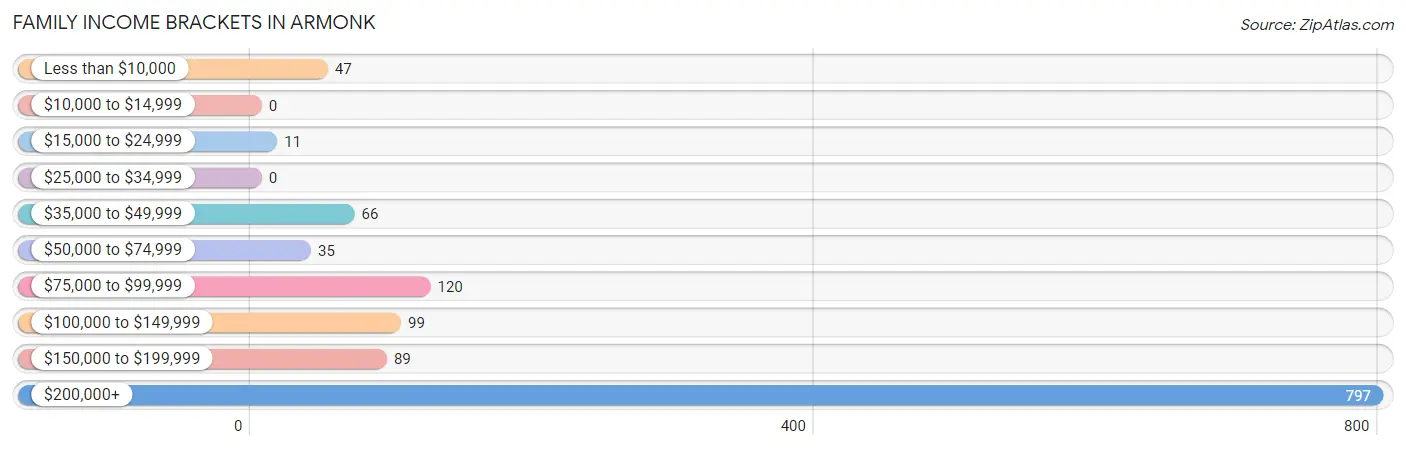
| Income Bracket | # Families | % Families |
| Less than $10,000 | 47 | 3.7% |
| $10,000 to $14,999 | 0 | 0.0% |
| $15,000 to $24,999 | 11 | 0.9% |
| $25,000 to $34,999 | 0 | 0.0% |
| $35,000 to $49,999 | 66 | 5.2% |
| $50,000 to $74,999 | 35 | 2.8% |
| $75,000 to $99,999 | 120 | 9.5% |
| $100,000 to $149,999 | 99 | 7.8% |
| $150,000 to $199,999 | 89 | 7.0% |
| $200,000+ | 797 | 63.0% |
Family Income by Famaliy Size in Armonk
5-person families (28 | 2.2%) account for the highest median family income in Armonk with $250,001 per family, while 2-person families (471 | 37.2%) have the highest median income of $120,840 per family member.
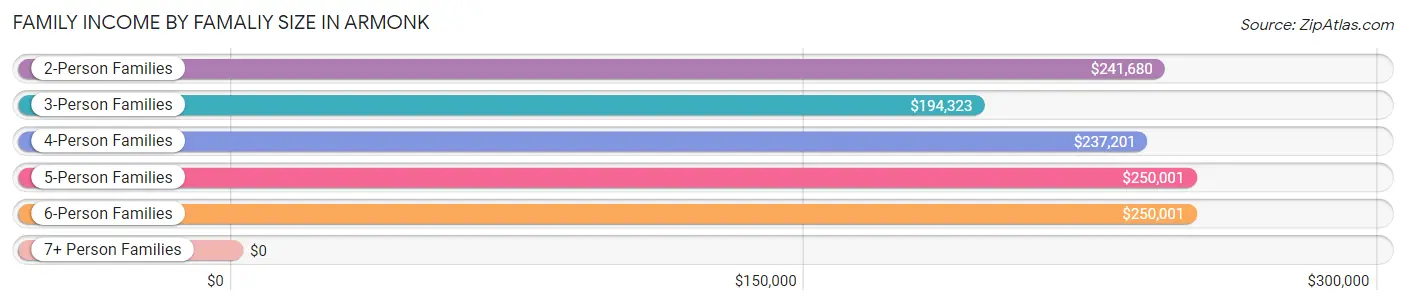
| Income Bracket | # Families | Median Income |
| 2-Person Families | 471 (37.2%) | $241,680 |
| 3-Person Families | 277 (21.9%) | $194,323 |
| 4-Person Families | 445 (35.2%) | $237,201 |
| 5-Person Families | 28 (2.2%) | $250,001 |
| 6-Person Families | 44 (3.5%) | $250,001 |
| 7+ Person Families | 0 (0.0%) | $0 |
| Total | 1,265 (100.0%) | $240,208 |
Family Income by Number of Earners in Armonk
The median family income in Armonk is $240,208, with families comprising 1 earner (371) having the highest median family income of $250,001, while families with no earners (124) have the lowest median family income of $76,176, accounting for 29.3% and 9.8% of families, respectively.
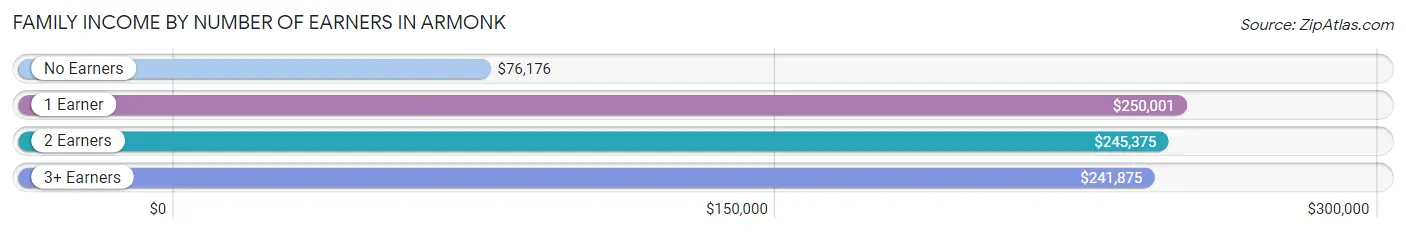
| Number of Earners | # Families | Median Income |
| No Earners | 124 (9.8%) | $76,176 |
| 1 Earner | 371 (29.3%) | $250,001 |
| 2 Earners | 621 (49.1%) | $245,375 |
| 3+ Earners | 149 (11.8%) | $241,875 |
| Total | 1,265 (100.0%) | $240,208 |
Household Income in Armonk
Household Income Brackets in Armonk
With 844 households falling in the category, the $200,000+ income range is the most frequent in Armonk, accounting for 57.4% of all households. In contrast, only 7 households (0.5%) fall into the $10,000 to $14,999 income bracket, making it the least populous group.
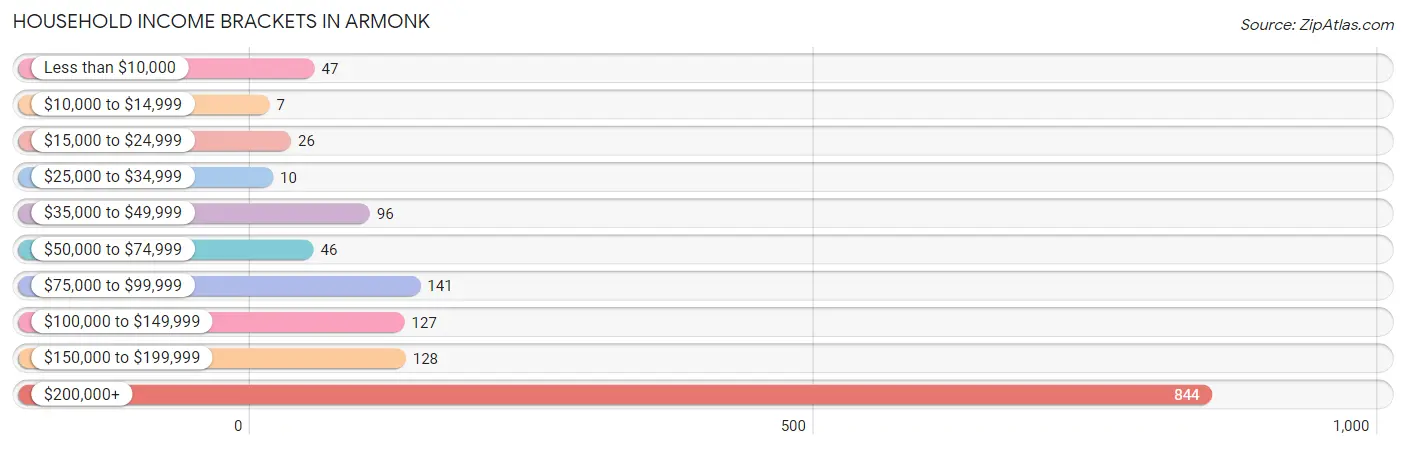
| Income Bracket | # Households | % Households |
| Less than $10,000 | 47 | 3.2% |
| $10,000 to $14,999 | 7 | 0.5% |
| $15,000 to $24,999 | 26 | 1.8% |
| $25,000 to $34,999 | 10 | 0.7% |
| $35,000 to $49,999 | 96 | 6.5% |
| $50,000 to $74,999 | 46 | 3.1% |
| $75,000 to $99,999 | 141 | 9.6% |
| $100,000 to $149,999 | 127 | 8.6% |
| $150,000 to $199,999 | 128 | 8.7% |
| $200,000+ | 844 | 57.4% |
Household Income by Householder Age in Armonk
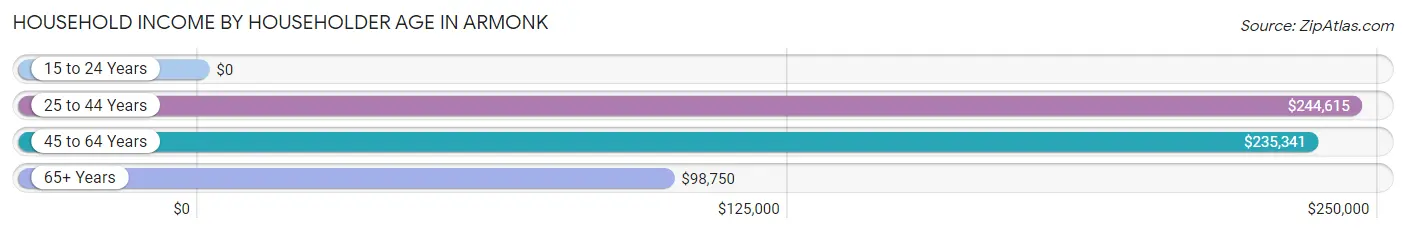
The median household income in Armonk is $234,688, with the highest median household income of $244,615 found in the 25 to 44 years age bracket for the primary householder. A total of 386 households (26.2%) fall into this category.
| Income Bracket | # Households | Median Income |
| 15 to 24 Years | 0 (0.0%) | $0 |
| 25 to 44 Years | 386 (26.2%) | $244,615 |
| 45 to 64 Years | 751 (51.0%) | $235,341 |
| 65+ Years | 334 (22.7%) | $98,750 |
| Total | 1,471 (100.0%) | $234,688 |
Poverty in Armonk
Income Below Poverty by Sex and Age in Armonk
With 2.3% poverty level for males and 4.3% for females among the residents of Armonk, 16 and 17 year old males and 5 year old females are the most vulnerable to poverty, with 13 males (17.3%) and 8 females (25.0%) in their respective age groups living below the poverty level.
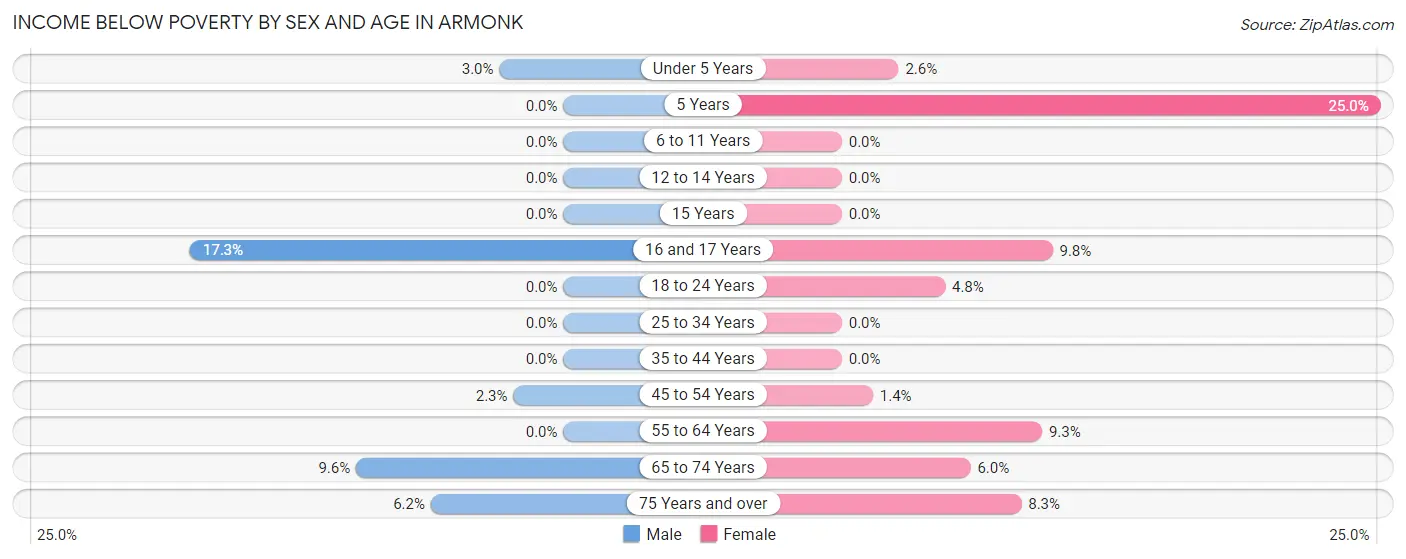
| Age Bracket | Male | Female |
| Under 5 Years | 7 (3.0%) | 3 (2.6%) |
| 5 Years | 0 (0.0%) | 8 (25.0%) |
| 6 to 11 Years | 0 (0.0%) | 0 (0.0%) |
| 12 to 14 Years | 0 (0.0%) | 0 (0.0%) |
| 15 Years | 0 (0.0%) | 0 (0.0%) |
| 16 and 17 Years | 13 (17.3%) | 9 (9.8%) |
| 18 to 24 Years | 0 (0.0%) | 9 (4.8%) |
| 25 to 34 Years | 0 (0.0%) | 0 (0.0%) |
| 35 to 44 Years | 0 (0.0%) | 0 (0.0%) |
| 45 to 54 Years | 8 (2.3%) | 4 (1.4%) |
| 55 to 64 Years | 0 (0.0%) | 38 (9.3%) |
| 65 to 74 Years | 15 (9.6%) | 8 (6.0%) |
| 75 Years and over | 8 (6.1%) | 10 (8.3%) |
| Total | 51 (2.3%) | 89 (4.3%) |
Income Above Poverty by Sex and Age in Armonk
According to the poverty statistics in Armonk, males aged 5 years and females aged 6 to 11 years are the age groups that are most secure financially, with 100.0% of males and 100.0% of females in these age groups living above the poverty line.
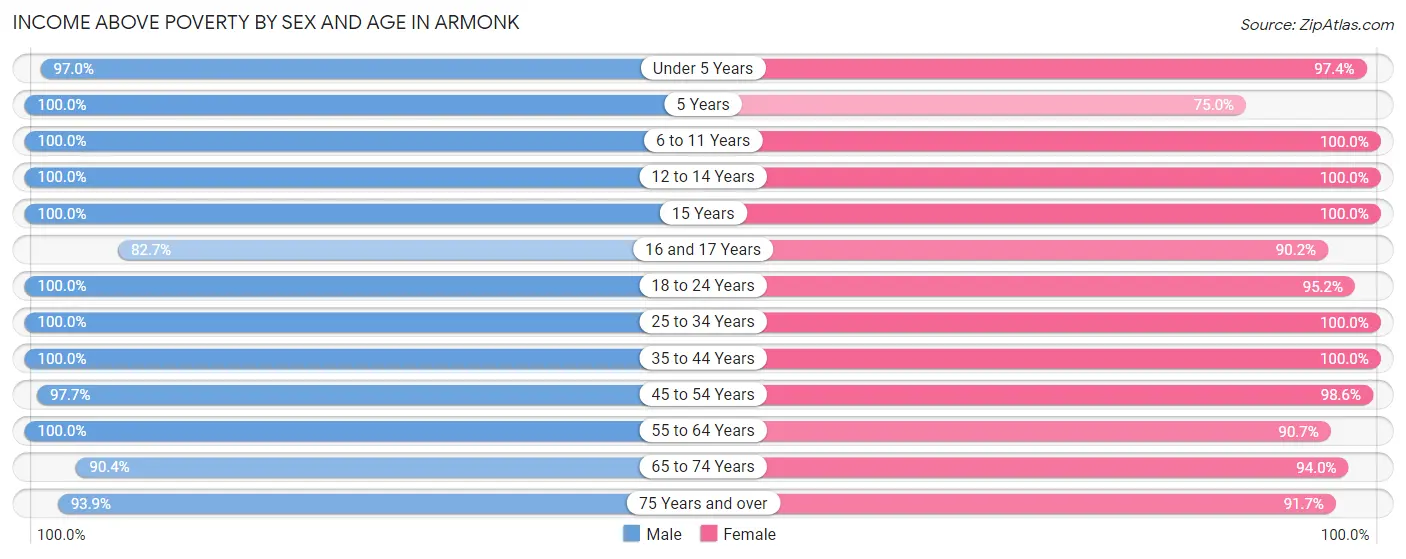
| Age Bracket | Male | Female |
| Under 5 Years | 229 (97.0%) | 111 (97.4%) |
| 5 Years | 50 (100.0%) | 24 (75.0%) |
| 6 to 11 Years | 141 (100.0%) | 141 (100.0%) |
| 12 to 14 Years | 81 (100.0%) | 88 (100.0%) |
| 15 Years | 19 (100.0%) | 22 (100.0%) |
| 16 and 17 Years | 62 (82.7%) | 83 (90.2%) |
| 18 to 24 Years | 83 (100.0%) | 179 (95.2%) |
| 25 to 34 Years | 261 (100.0%) | 159 (100.0%) |
| 35 to 44 Years | 295 (100.0%) | 305 (100.0%) |
| 45 to 54 Years | 337 (97.7%) | 274 (98.6%) |
| 55 to 64 Years | 376 (100.0%) | 371 (90.7%) |
| 65 to 74 Years | 141 (90.4%) | 126 (94.0%) |
| 75 Years and over | 122 (93.9%) | 110 (91.7%) |
| Total | 2,197 (97.7%) | 1,993 (95.7%) |
Income Below Poverty Among Married-Couple Families in Armonk
The poverty statistics for married-couple families in Armonk show that 2.1% or 23 of the total 1,087 families live below the poverty line. Families with no children have the highest poverty rate of 4.5%, comprising of 23 families. On the other hand, families with 1 or 2 children have the lowest poverty rate of 0.0%, which includes 0 families.
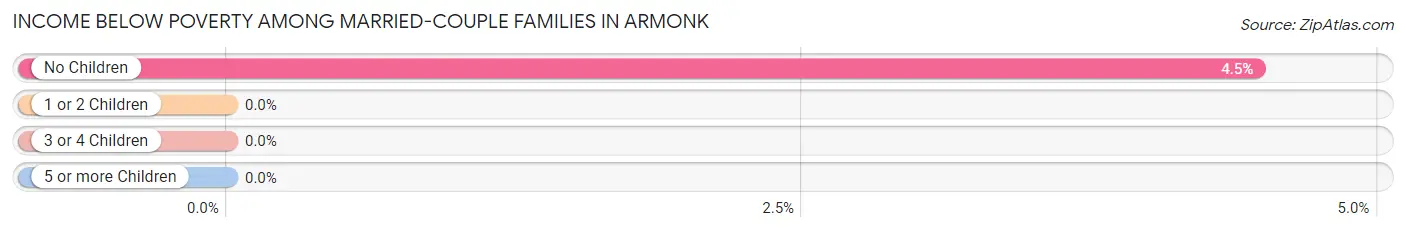
| Children | Above Poverty | Below Poverty |
| No Children | 492 (95.5%) | 23 (4.5%) |
| 1 or 2 Children | 515 (100.0%) | 0 (0.0%) |
| 3 or 4 Children | 57 (100.0%) | 0 (0.0%) |
| 5 or more Children | 0 (0.0%) | 0 (0.0%) |
| Total | 1,064 (97.9%) | 23 (2.1%) |
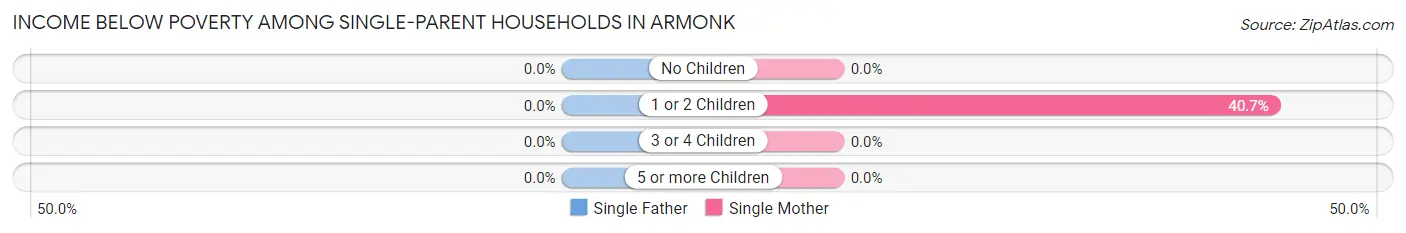
Income Below Poverty Among Single-Parent Households in Armonk
| Children | Single Father | Single Mother |
| No Children | 0 (0.0%) | 0 (0.0%) |
| 1 or 2 Children | 0 (0.0%) | 24 (40.7%) |
| 3 or 4 Children | 0 (0.0%) | 0 (0.0%) |
| 5 or more Children | 0 (0.0%) | 0 (0.0%) |
| Total | 0 (0.0%) | 24 (24.0%) |
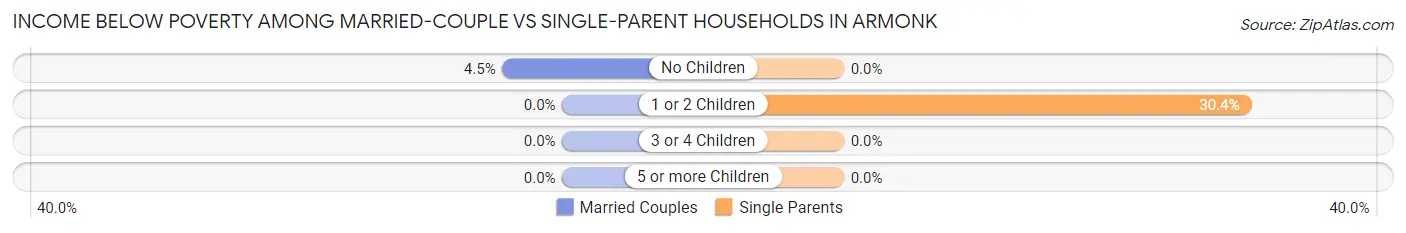
Income Below Poverty Among Married-Couple vs Single-Parent Households in Armonk
The poverty data for Armonk shows that 23 of the married-couple family households (2.1%) and 24 of the single-parent households (13.5%) are living below the poverty level. Within the married-couple family households, those with no children have the highest poverty rate, with 23 households (4.5%) falling below the poverty line. Among the single-parent households, those with 1 or 2 children have the highest poverty rate, with 24 household (30.4%) living below poverty.
| Children | Married-Couple Families | Single-Parent Households |
| No Children | 23 (4.5%) | 0 (0.0%) |
| 1 or 2 Children | 0 (0.0%) | 24 (30.4%) |
| 3 or 4 Children | 0 (0.0%) | 0 (0.0%) |
| 5 or more Children | 0 (0.0%) | 0 (0.0%) |
| Total | 23 (2.1%) | 24 (13.5%) |
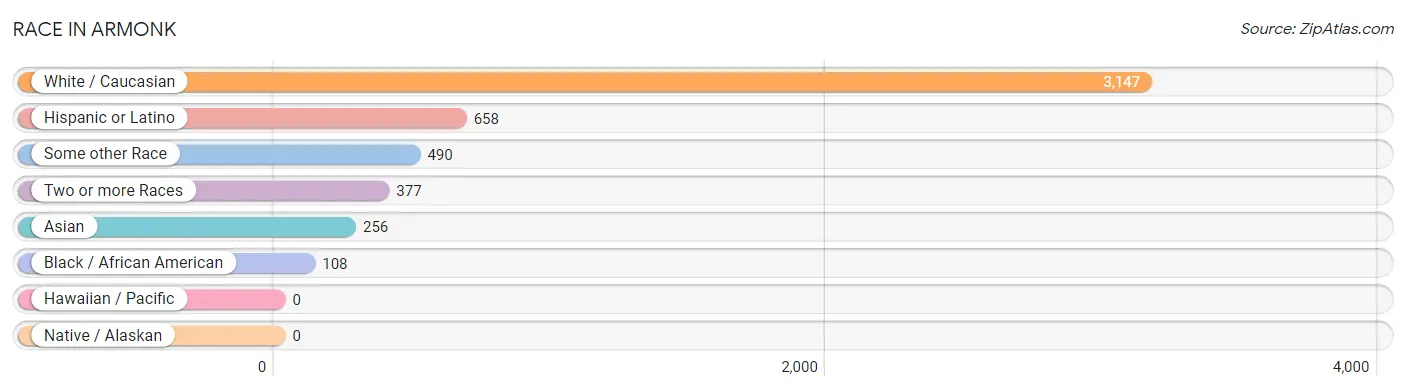
Race in Armonk
The most populous races in Armonk are White / Caucasian (3,147 | 71.9%), Hispanic or Latino (658 | 15.0%), and Some other Race (490 | 11.2%).
| Race | # Population | % Population |
| Asian | 256 | 5.9% |
| Black / African American | 108 | 2.5% |
| Hawaiian / Pacific | 0 | 0.0% |
| Hispanic or Latino | 658 | 15.0% |
| Native / Alaskan | 0 | 0.0% |
| White / Caucasian | 3,147 | 71.9% |
| Two or more Races | 377 | 8.6% |
| Some other Race | 490 | 11.2% |
| Total | 4,378 | 100.0% |
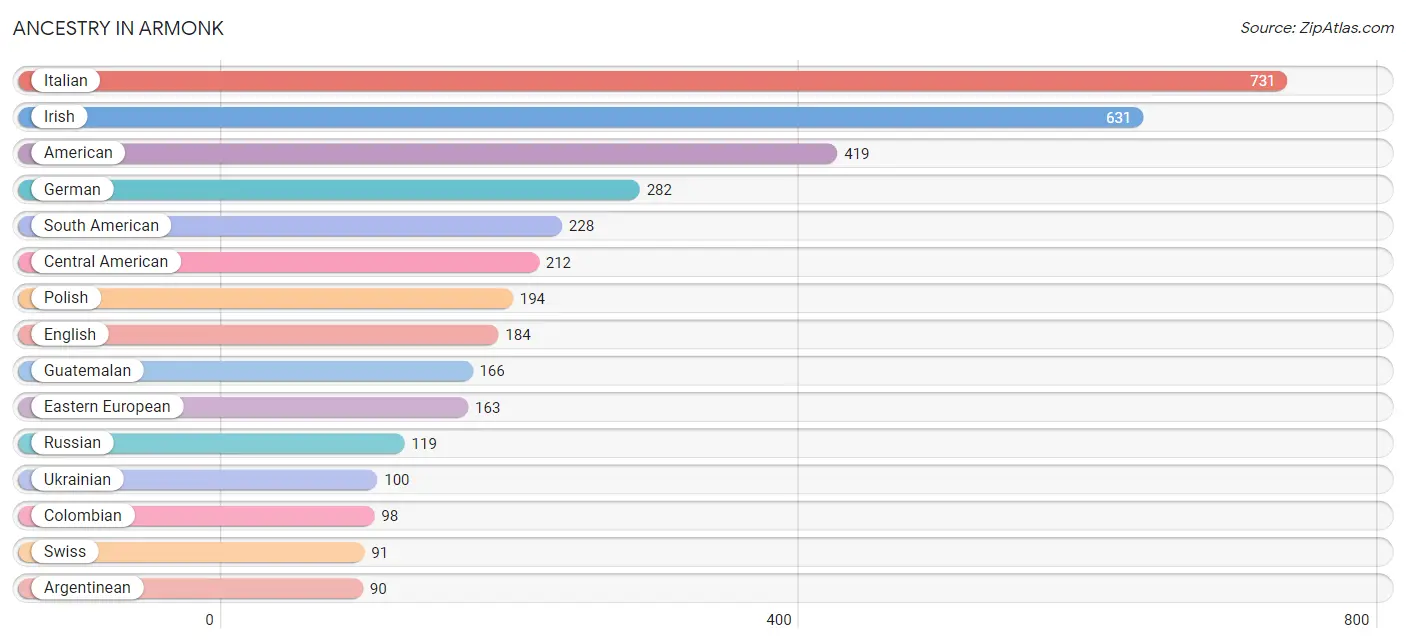
Ancestry in Armonk
The most populous ancestries reported in Armonk are Italian (731 | 16.7%), Irish (631 | 14.4%), American (419 | 9.6%), German (282 | 6.4%), and South American (228 | 5.2%), together accounting for 52.3% of all Armonk residents.
| Ancestry | # Population | % Population |
| American | 419 | 9.6% |
| Arab | 46 | 1.1% |
| Argentinean | 90 | 2.1% |
| Austrian | 47 | 1.1% |
| Barbadian | 15 | 0.3% |
| Belgian | 8 | 0.2% |
| Bhutanese | 32 | 0.7% |
| Brazilian | 69 | 1.6% |
| British | 31 | 0.7% |
| Bulgarian | 20 | 0.5% |
| Burmese | 31 | 0.7% |
| Canadian | 8 | 0.2% |
| Central American | 212 | 4.8% |
| Central American Indian | 54 | 1.2% |
| Colombian | 98 | 2.2% |
| Czech | 9 | 0.2% |
| Dominican | 36 | 0.8% |
| Eastern European | 163 | 3.7% |
| English | 184 | 4.2% |
| European | 52 | 1.2% |
| Filipino | 25 | 0.6% |
| Finnish | 8 | 0.2% |
| French | 76 | 1.7% |
| French Canadian | 44 | 1.0% |
| German | 282 | 6.4% |
| Ghanaian | 40 | 0.9% |
| Guatemalan | 166 | 3.8% |
| Hungarian | 12 | 0.3% |
| Indian (Asian) | 86 | 2.0% |
| Irish | 631 | 14.4% |
| Israeli | 10 | 0.2% |
| Italian | 731 | 16.7% |
| Korean | 40 | 0.9% |
| Lebanese | 46 | 1.1% |
| Liberian | 14 | 0.3% |
| Mexican | 20 | 0.5% |
| Nicaraguan | 46 | 1.1% |
| Pakistani | 24 | 0.5% |
| Paraguayan | 40 | 0.9% |
| Polish | 194 | 4.4% |
| Portuguese | 79 | 1.8% |
| Puerto Rican | 15 | 0.3% |
| Romanian | 10 | 0.2% |
| Russian | 119 | 2.7% |
| Scotch-Irish | 12 | 0.3% |
| Scottish | 19 | 0.4% |
| Slovak | 19 | 0.4% |
| South American | 228 | 5.2% |
| Spaniard | 21 | 0.5% |
| Subsaharan African | 68 | 1.5% |
| Swiss | 91 | 2.1% |
| Thai | 32 | 0.7% |
| Ukrainian | 100 | 2.3% |
| Welsh | 21 | 0.5% | View All 54 Rows |
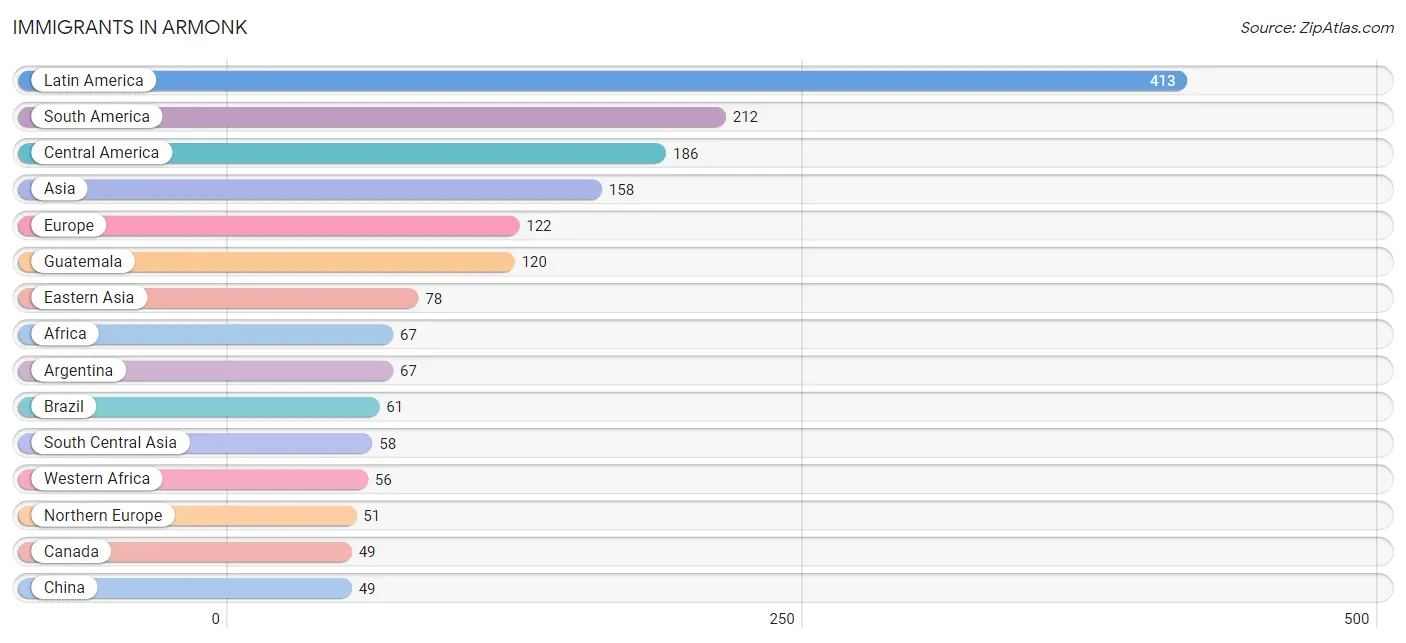
Immigrants in Armonk
The most numerous immigrant groups reported in Armonk came from Latin America (413 | 9.4%), South America (212 | 4.8%), Central America (186 | 4.3%), Asia (158 | 3.6%), and Europe (122 | 2.8%), together accounting for 24.9% of all Armonk residents.
| Immigration Origin | # Population | % Population |
| Africa | 67 | 1.5% |
| Argentina | 67 | 1.5% |
| Asia | 158 | 3.6% |
| Barbados | 15 | 0.3% |
| Brazil | 61 | 1.4% |
| Canada | 49 | 1.1% |
| Caribbean | 15 | 0.3% |
| Central America | 186 | 4.3% |
| China | 49 | 1.1% |
| Colombia | 44 | 1.0% |
| Eastern Asia | 78 | 1.8% |
| Eastern Europe | 41 | 0.9% |
| England | 35 | 0.8% |
| Europe | 122 | 2.8% |
| Germany | 9 | 0.2% |
| Ghana | 28 | 0.6% |
| Guatemala | 120 | 2.7% |
| India | 26 | 0.6% |
| Israel | 10 | 0.2% |
| Japan | 17 | 0.4% |
| Korea | 12 | 0.3% |
| Latin America | 413 | 9.4% |
| Lebanon | 12 | 0.3% |
| Liberia | 14 | 0.3% |
| Mexico | 20 | 0.5% |
| Middle Africa | 11 | 0.3% |
| Nicaragua | 46 | 1.1% |
| Northern Europe | 51 | 1.2% |
| Oceania | 13 | 0.3% |
| Pakistan | 32 | 0.7% |
| Poland | 9 | 0.2% |
| South America | 212 | 4.8% |
| South Central Asia | 58 | 1.3% |
| Switzerland | 21 | 0.5% |
| Taiwan | 4 | 0.1% |
| Ukraine | 10 | 0.2% |
| Western Africa | 56 | 1.3% |
| Western Asia | 22 | 0.5% |
| Western Europe | 30 | 0.7% | View All 39 Rows |
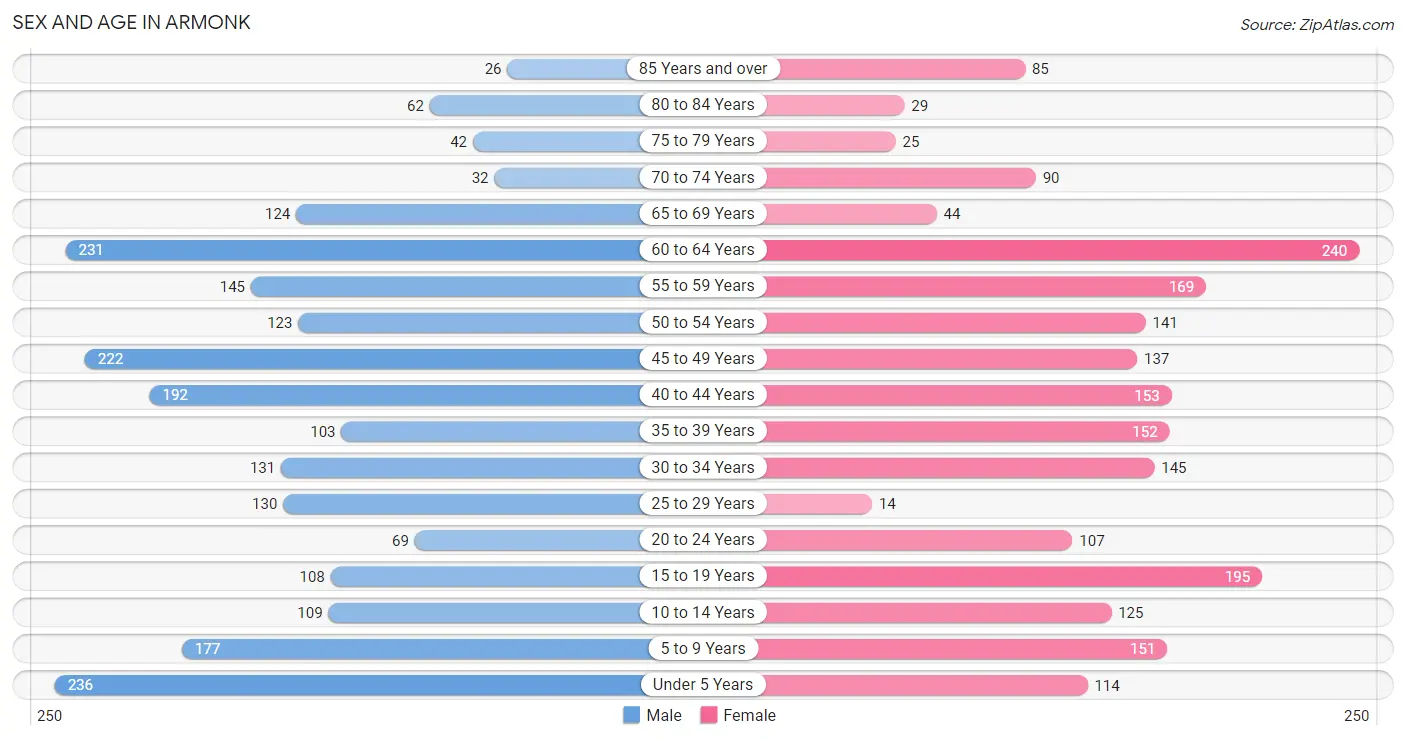
Sex and Age in Armonk
Sex and Age in Armonk
The most populous age groups in Armonk are Under 5 Years (236 | 10.4%) for men and 60 to 64 Years (240 | 11.3%) for women.
| Age Bracket | Male | Female |
| Under 5 Years | 236 (10.4%) | 114 (5.4%) |
| 5 to 9 Years | 177 (7.8%) | 151 (7.1%) |
| 10 to 14 Years | 109 (4.8%) | 125 (5.9%) |
| 15 to 19 Years | 108 (4.8%) | 195 (9.2%) |
| 20 to 24 Years | 69 (3.0%) | 107 (5.1%) |
| 25 to 29 Years | 130 (5.8%) | 14 (0.7%) |
| 30 to 34 Years | 131 (5.8%) | 145 (6.9%) |
| 35 to 39 Years | 103 (4.5%) | 152 (7.2%) |
| 40 to 44 Years | 192 (8.5%) | 153 (7.2%) |
| 45 to 49 Years | 222 (9.8%) | 137 (6.5%) |
| 50 to 54 Years | 123 (5.4%) | 141 (6.7%) |
| 55 to 59 Years | 145 (6.4%) | 169 (8.0%) |
| 60 to 64 Years | 231 (10.2%) | 240 (11.3%) |
| 65 to 69 Years | 124 (5.5%) | 44 (2.1%) |
| 70 to 74 Years | 32 (1.4%) | 90 (4.3%) |
| 75 to 79 Years | 42 (1.9%) | 25 (1.2%) |
| 80 to 84 Years | 62 (2.7%) | 29 (1.4%) |
| 85 Years and over | 26 (1.1%) | 85 (4.0%) |
| Total | 2,262 (100.0%) | 2,116 (100.0%) |
Families and Households in Armonk
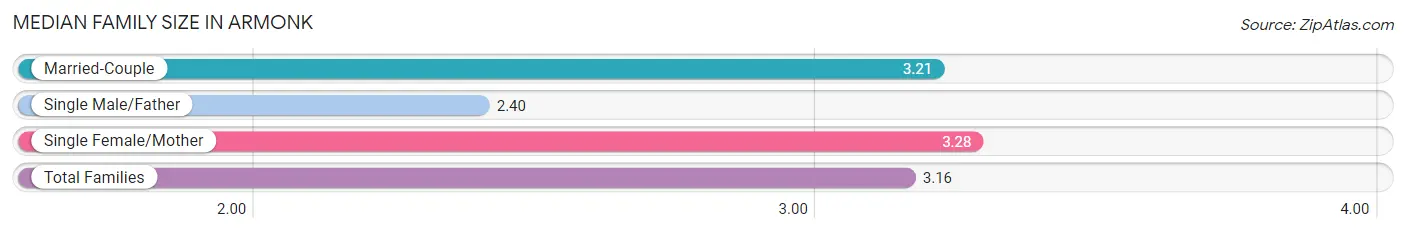
Median Family Size in Armonk
The median family size in Armonk is 3.16 persons per family, with single female/mother families (100 | 7.9%) accounting for the largest median family size of 3.28 persons per family. On the other hand, single male/father families (78 | 6.2%) represent the smallest median family size with 2.40 persons per family.
| Family Type | # Families | Family Size |
| Married-Couple | 1,087 (85.9%) | 3.21 |
| Single Male/Father | 78 (6.2%) | 2.40 |
| Single Female/Mother | 100 (7.9%) | 3.28 |
| Total Families | 1,265 (100.0%) | 3.16 |
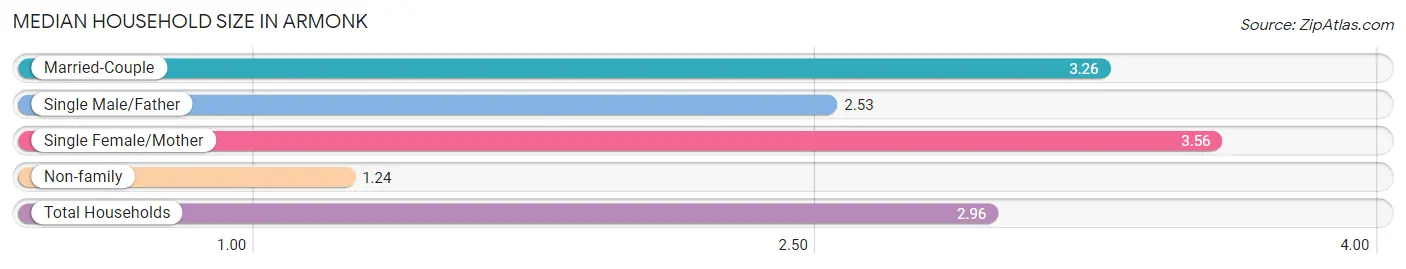
Median Household Size in Armonk
The median household size in Armonk is 2.96 persons per household, with single female/mother households (100 | 6.8%) accounting for the largest median household size of 3.56 persons per household. non-family households (206 | 14.0%) represent the smallest median household size with 1.24 persons per household.
| Household Type | # Households | Household Size |
| Married-Couple | 1,087 (73.9%) | 3.26 |
| Single Male/Father | 78 (5.3%) | 2.53 |
| Single Female/Mother | 100 (6.8%) | 3.56 |
| Non-family | 206 (14.0%) | 1.24 |
| Total Households | 1,471 (100.0%) | 2.96 |
Household Size by Marriage Status in Armonk
Out of a total of 1,471 households in Armonk, 1,265 (86.0%) are family households, while 206 (14.0%) are nonfamily households. The most numerous type of family households are 2-person households, comprising 435, and the most common type of nonfamily households are 1-person households, comprising 161.
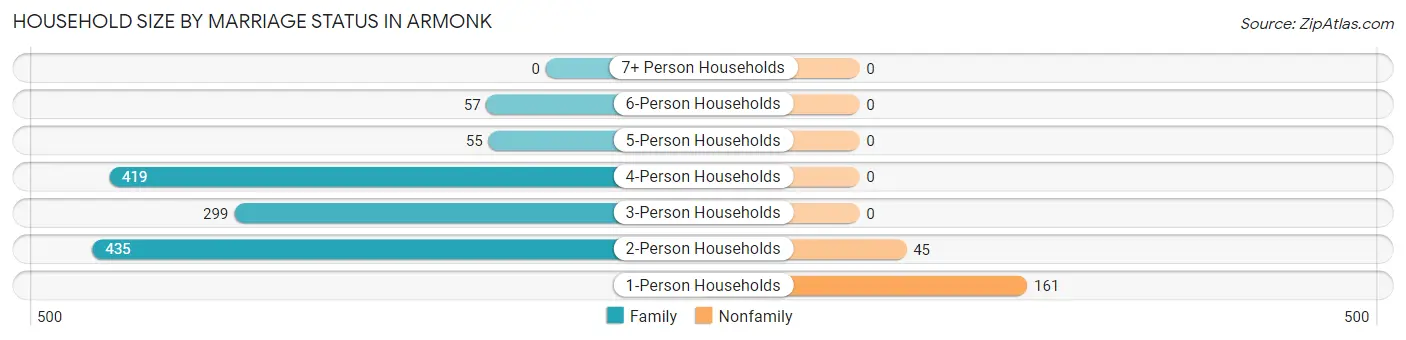
| Household Size | Family Households | Nonfamily Households |
| 1-Person Households | - | 161 (10.9%) |
| 2-Person Households | 435 (29.6%) | 45 (3.1%) |
| 3-Person Households | 299 (20.3%) | 0 (0.0%) |
| 4-Person Households | 419 (28.5%) | 0 (0.0%) |
| 5-Person Households | 55 (3.7%) | 0 (0.0%) |
| 6-Person Households | 57 (3.9%) | 0 (0.0%) |
| 7+ Person Households | 0 (0.0%) | 0 (0.0%) |
| Total | 1,265 (86.0%) | 206 (14.0%) |
Female Fertility in Armonk
Fertility by Age in Armonk
Average fertility rate in Armonk is 67.0 births per 1,000 women. Women in the age bracket of 35 to 50 years have the highest fertility rate with 108.0 births per 1,000 women. Women in the age bracket of 35 to 50 years acount for 80.9% of all women with births.
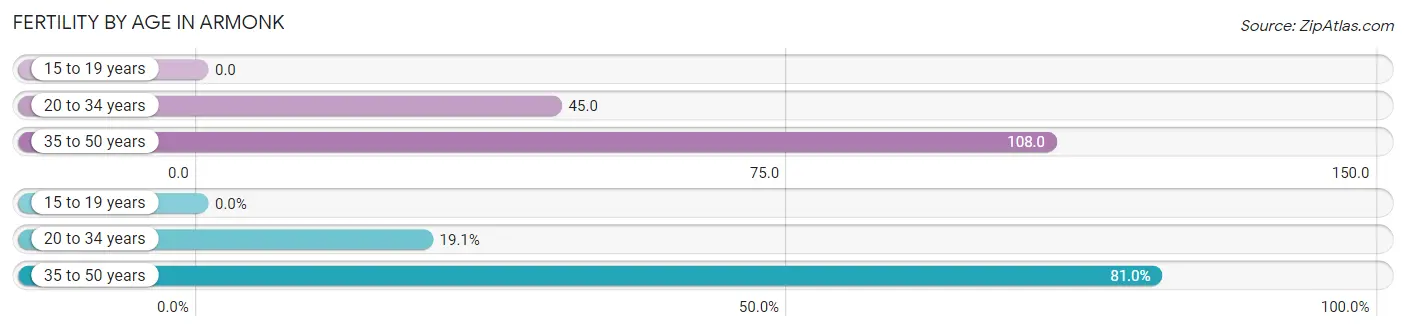
| Age Bracket | Women with Births | Births / 1,000 Women |
| 15 to 19 years | 0 (0.0%) | 0.0 |
| 20 to 34 years | 12 (19.1%) | 45.0 |
| 35 to 50 years | 51 (80.9%) | 108.0 |
| Total | 63 (100.0%) | 67.0 |
Fertility by Age by Marriage Status in Armonk
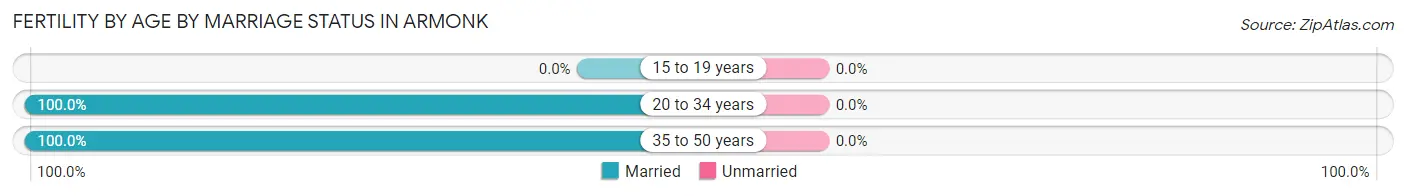
| Age Bracket | Married | Unmarried |
| 15 to 19 years | 0 (0.0%) | 0 (0.0%) |
| 20 to 34 years | 12 (100.0%) | 0 (0.0%) |
| 35 to 50 years | 51 (100.0%) | 0 (0.0%) |
| Total | 63 (100.0%) | 0 (0.0%) |
Fertility by Education in Armonk
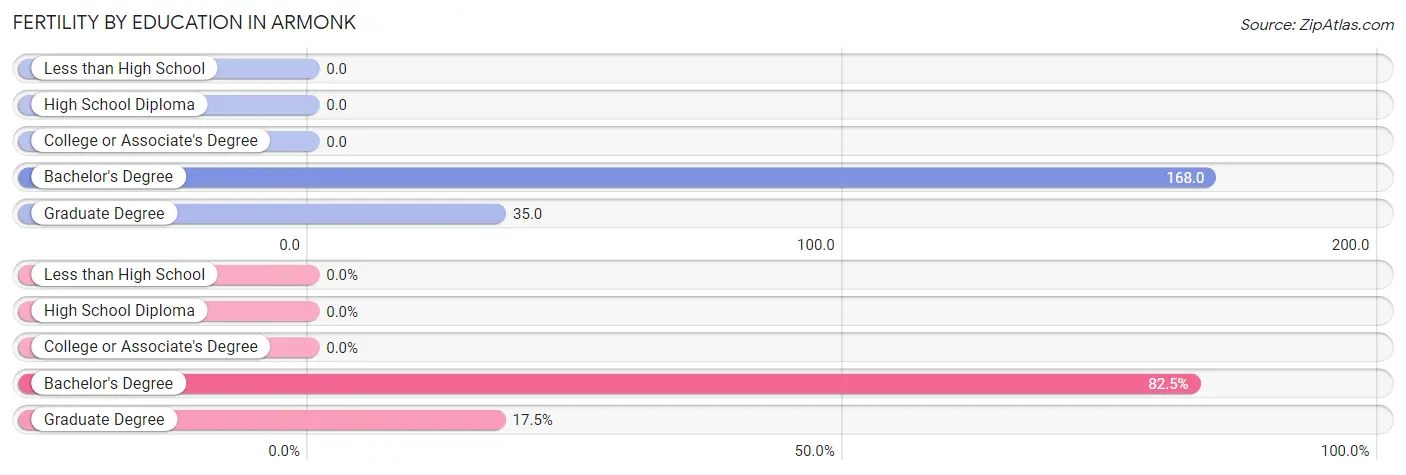
| Educational Attainment | Women with Births | Births / 1,000 Women |
| Less than High School | 0 (0.0%) | 0.0 |
| High School Diploma | 0 (0.0%) | 0.0 |
| College or Associate's Degree | 0 (0.0%) | 0.0 |
| Bachelor's Degree | 52 (82.5%) | 168.0 |
| Graduate Degree | 11 (17.5%) | 35.0 |
| Total | 63 (100.0%) | 67.0 |
Fertility by Education by Marriage Status in Armonk
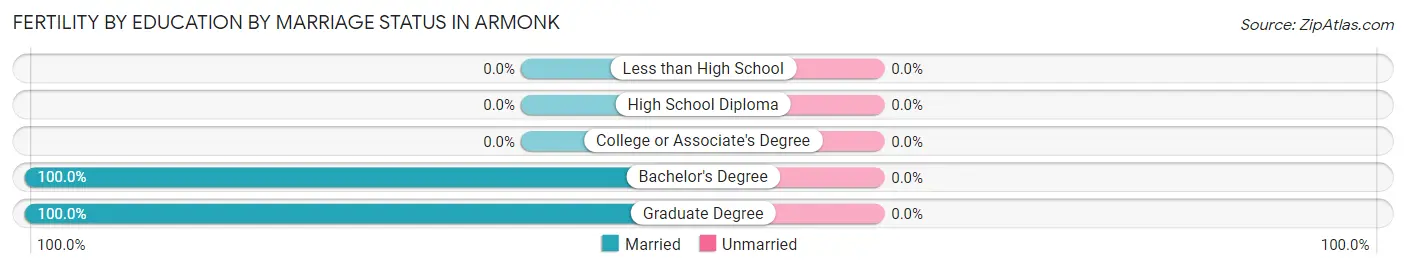
| Educational Attainment | Married | Unmarried |
| Less than High School | 0 (0.0%) | 0 (0.0%) |
| High School Diploma | 0 (0.0%) | 0 (0.0%) |
| College or Associate's Degree | 0 (0.0%) | 0 (0.0%) |
| Bachelor's Degree | 52 (100.0%) | 0 (0.0%) |
| Graduate Degree | 11 (100.0%) | 0 (0.0%) |
| Total | 63 (100.0%) | 0 (0.0%) |
Employment Characteristics in Armonk
Employment by Class of Employer in Armonk
Among the 2,030 employed individuals in Armonk, private company employees (1,309 | 64.5%), local government employees (256 | 12.6%), and not-for-profit organizations (176 | 8.7%) make up the most common classes of employment.
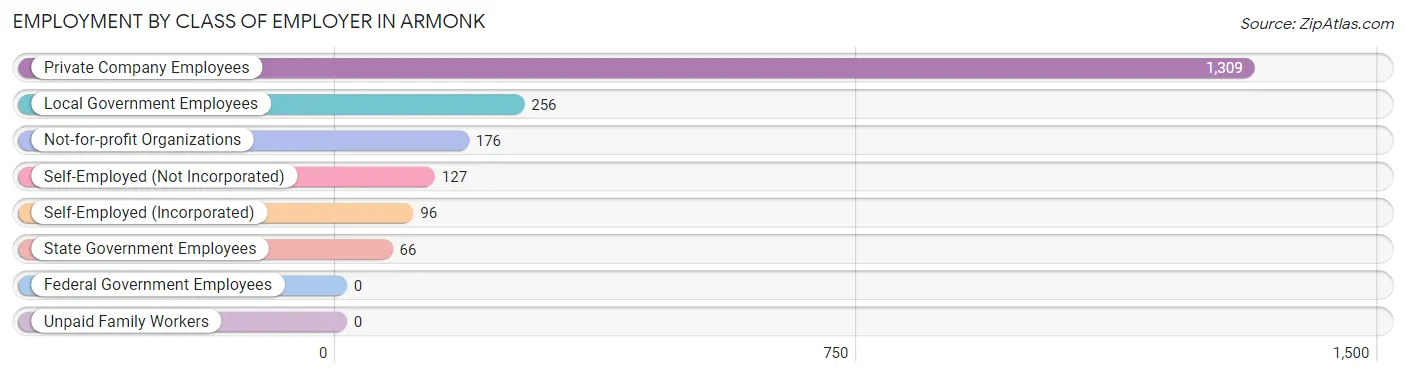
| Employer Class | # Employees | % Employees |
| Private Company Employees | 1,309 | 64.5% |
| Self-Employed (Incorporated) | 96 | 4.7% |
| Self-Employed (Not Incorporated) | 127 | 6.3% |
| Not-for-profit Organizations | 176 | 8.7% |
| Local Government Employees | 256 | 12.6% |
| State Government Employees | 66 | 3.3% |
| Federal Government Employees | 0 | 0.0% |
| Unpaid Family Workers | 0 | 0.0% |
| Total | 2,030 | 100.0% |
Employment Status by Age in Armonk
According to the labor force statistics for Armonk, out of the total population over 16 years of age (3,425), 62.0% or 2,124 individuals are in the labor force, with 1.3% or 28 of them unemployed. The age group with the highest labor force participation rate is 25 to 29 years, with 100.0% or 144 individuals in the labor force. Within the labor force, the 20 to 24 years age range has the highest percentage of unemployed individuals, with 19.6% or 19 of them being unemployed.
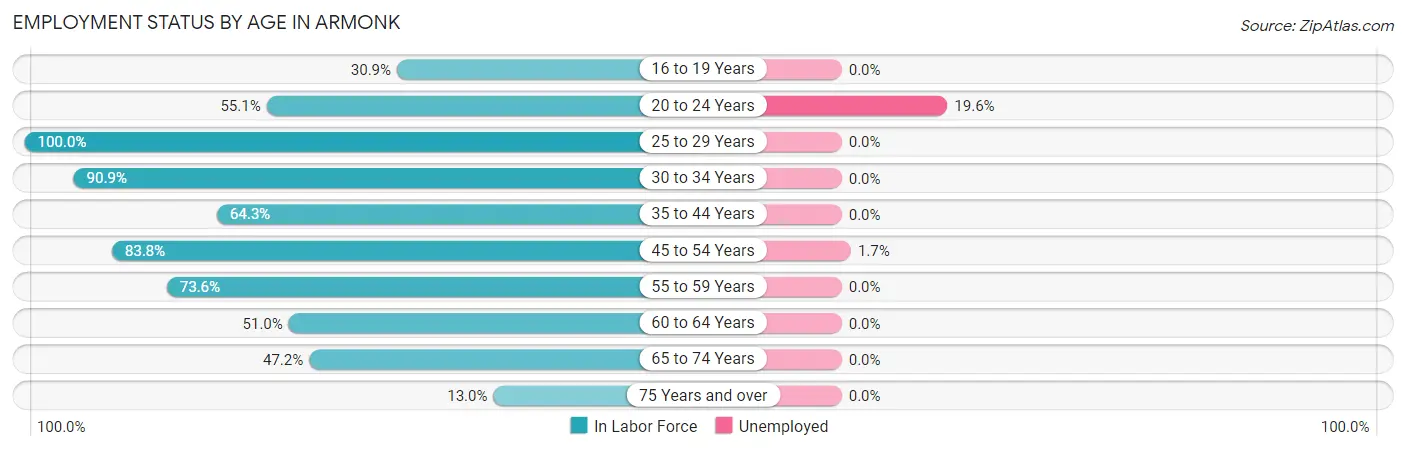
| Age Bracket | In Labor Force | Unemployed |
| 16 to 19 Years | 81 (30.9%) | 0 (0.0%) |
| 20 to 24 Years | 97 (55.1%) | 19 (19.6%) |
| 25 to 29 Years | 144 (100.0%) | 0 (0.0%) |
| 30 to 34 Years | 251 (90.9%) | 0 (0.0%) |
| 35 to 44 Years | 386 (64.3%) | 0 (0.0%) |
| 45 to 54 Years | 522 (83.8%) | 9 (1.7%) |
| 55 to 59 Years | 231 (73.6%) | 0 (0.0%) |
| 60 to 64 Years | 240 (51.0%) | 0 (0.0%) |
| 65 to 74 Years | 137 (47.2%) | 0 (0.0%) |
| 75 Years and over | 35 (13.0%) | 0 (0.0%) |
| Total | 2,124 (62.0%) | 28 (1.3%) |
Employment Status by Educational Attainment in Armonk
According to labor force statistics for Armonk, 73.1% of individuals (1,775) out of the total population between 25 and 64 years of age (2,428) are in the labor force, with 0.5% or 9 of them being unemployed. The group with the highest labor force participation rate are those with the educational attainment of bachelor's degree or higher, with 78.2% or 1,530 individuals in the labor force. Within the labor force, individuals with bachelor's degree or higher education have the highest percentage of unemployment, with 0.6% or 9 of them being unemployed.
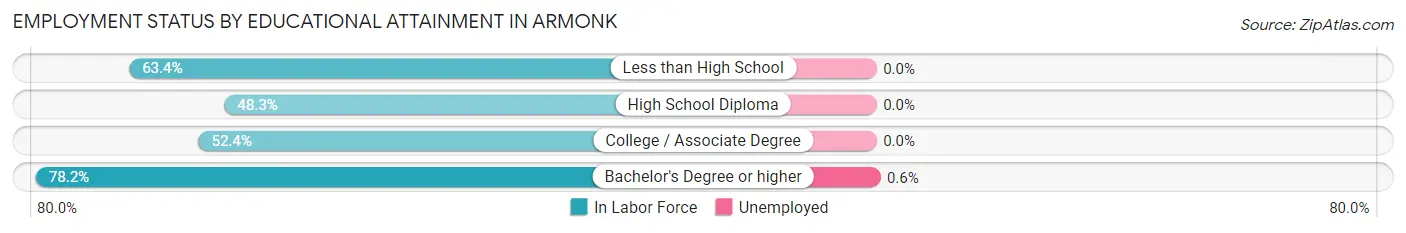
| Educational Attainment | In Labor Force | Unemployed |
| Less than High School | 26 (63.4%) | 0 (0.0%) |
| High School Diploma | 87 (48.3%) | 0 (0.0%) |
| College / Associate Degree | 131 (52.4%) | 0 (0.0%) |
| Bachelor's Degree or higher | 1,530 (78.2%) | 12 (0.6%) |
| Total | 1,775 (73.1%) | 12 (0.5%) |
Employment Occupations by Sex in Armonk
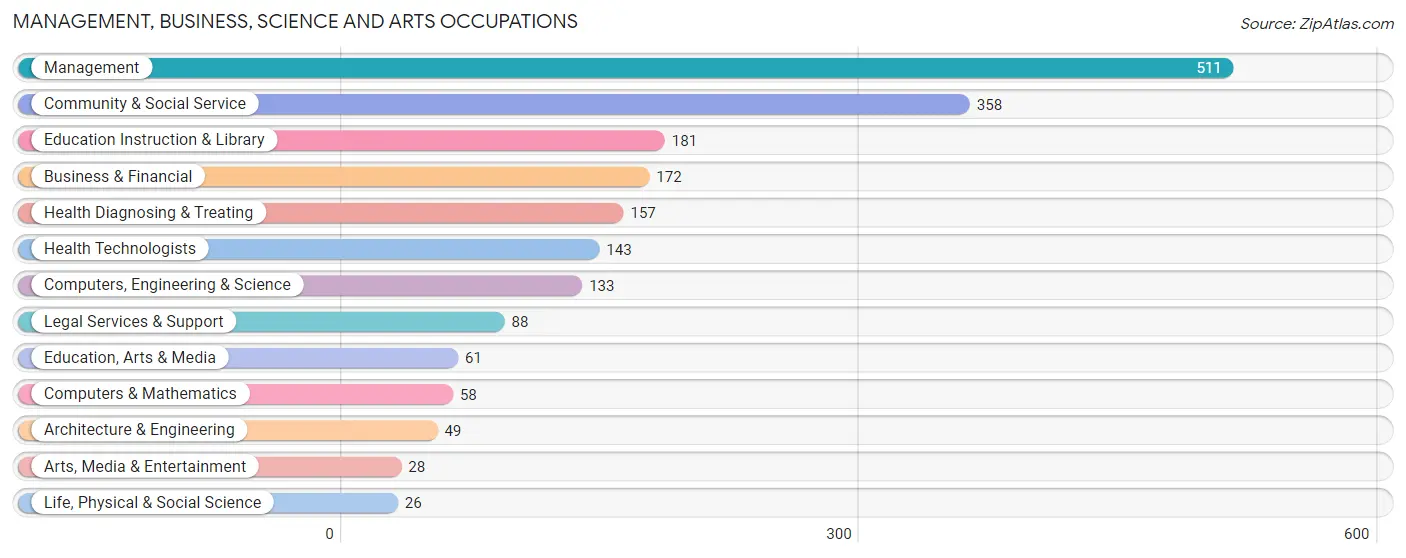
Management, Business, Science and Arts Occupations
The most common Management, Business, Science and Arts occupations in Armonk are Management (511 | 24.4%), Community & Social Service (358 | 17.1%), Education Instruction & Library (181 | 8.6%), Business & Financial (172 | 8.2%), and Health Diagnosing & Treating (157 | 7.5%).
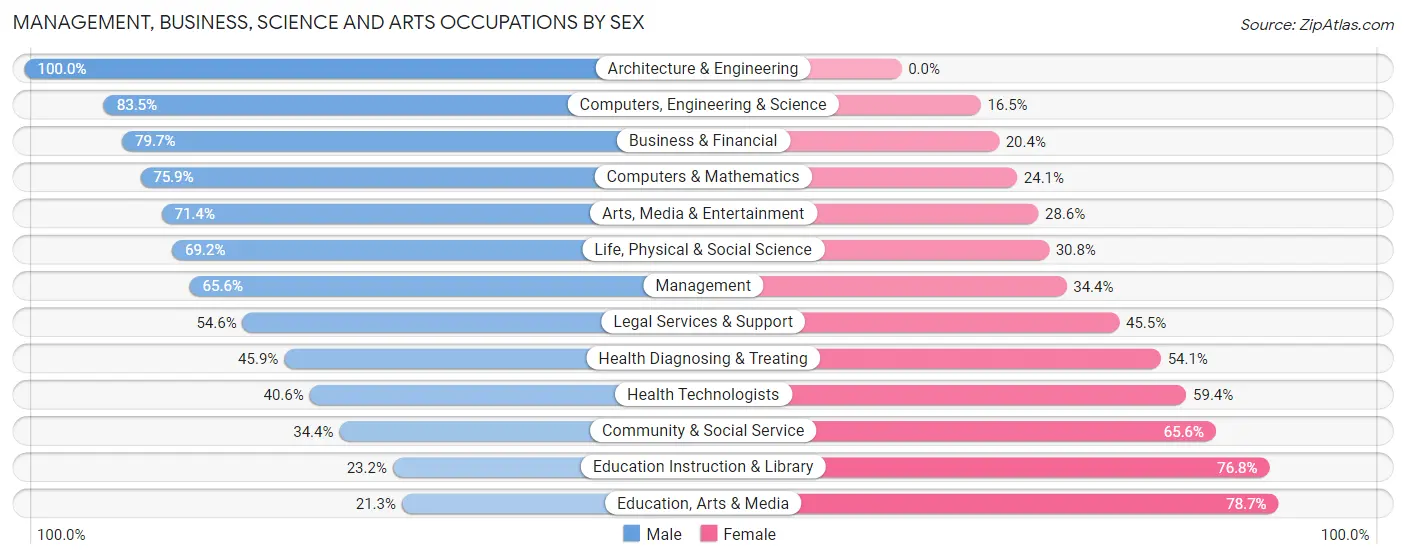
Management, Business, Science and Arts Occupations by Sex
Within the Management, Business, Science and Arts occupations in Armonk, the most male-oriented occupations are Architecture & Engineering (100.0%), Computers, Engineering & Science (83.5%), and Business & Financial (79.6%), while the most female-oriented occupations are Education, Arts & Media (78.7%), Education Instruction & Library (76.8%), and Community & Social Service (65.6%).
| Occupation | Male | Female |
| Management | 335 (65.6%) | 176 (34.4%) |
| Business & Financial | 137 (79.6%) | 35 (20.3%) |
| Computers, Engineering & Science | 111 (83.5%) | 22 (16.5%) |
| Computers & Mathematics | 44 (75.9%) | 14 (24.1%) |
| Architecture & Engineering | 49 (100.0%) | 0 (0.0%) |
| Life, Physical & Social Science | 18 (69.2%) | 8 (30.8%) |
| Community & Social Service | 123 (34.4%) | 235 (65.6%) |
| Education, Arts & Media | 13 (21.3%) | 48 (78.7%) |
| Legal Services & Support | 48 (54.5%) | 40 (45.5%) |
| Education Instruction & Library | 42 (23.2%) | 139 (76.8%) |
| Arts, Media & Entertainment | 20 (71.4%) | 8 (28.6%) |
| Health Diagnosing & Treating | 72 (45.9%) | 85 (54.1%) |
| Health Technologists | 58 (40.6%) | 85 (59.4%) |
| Total (Category) | 778 (58.5%) | 553 (41.5%) |
| Total (Overall) | 1,270 (60.6%) | 826 (39.4%) |
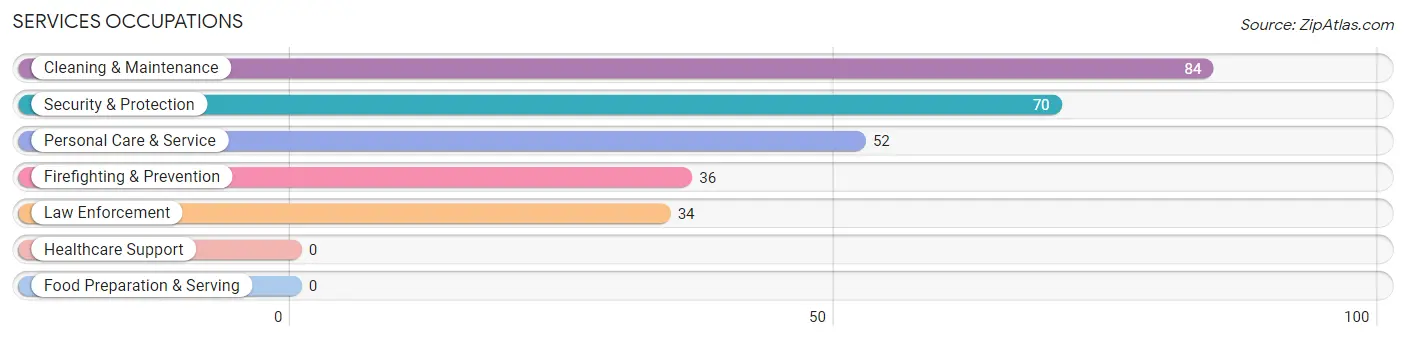
Services Occupations
The most common Services occupations in Armonk are Cleaning & Maintenance (84 | 4.0%), Security & Protection (70 | 3.3%), Personal Care & Service (52 | 2.5%), Firefighting & Prevention (36 | 1.7%), and Law Enforcement (34 | 1.6%).
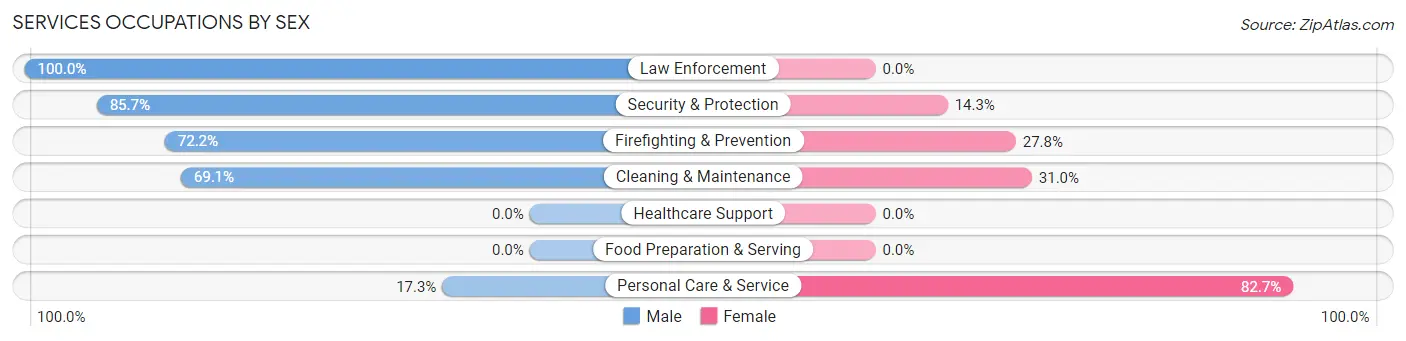
Services Occupations by Sex
Within the Services occupations in Armonk, the most male-oriented occupations are Law Enforcement (100.0%), Security & Protection (85.7%), and Firefighting & Prevention (72.2%), while the most female-oriented occupations are Personal Care & Service (82.7%), Cleaning & Maintenance (30.9%), and Firefighting & Prevention (27.8%).
| Occupation | Male | Female |
| Healthcare Support | 0 (0.0%) | 0 (0.0%) |
| Security & Protection | 60 (85.7%) | 10 (14.3%) |
| Firefighting & Prevention | 26 (72.2%) | 10 (27.8%) |
| Law Enforcement | 34 (100.0%) | 0 (0.0%) |
| Food Preparation & Serving | 0 (0.0%) | 0 (0.0%) |
| Cleaning & Maintenance | 58 (69.1%) | 26 (30.9%) |
| Personal Care & Service | 9 (17.3%) | 43 (82.7%) |
| Total (Category) | 127 (61.7%) | 79 (38.4%) |
| Total (Overall) | 1,270 (60.6%) | 826 (39.4%) |
Sales and Office Occupations
The most common Sales and Office occupations in Armonk are Sales & Related (243 | 11.6%), and Office & Administration (140 | 6.7%).
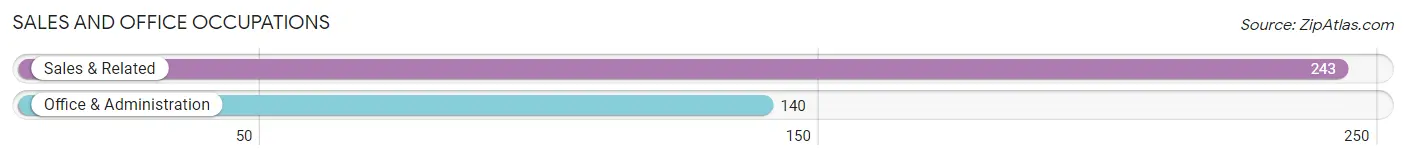
Sales and Office Occupations by Sex
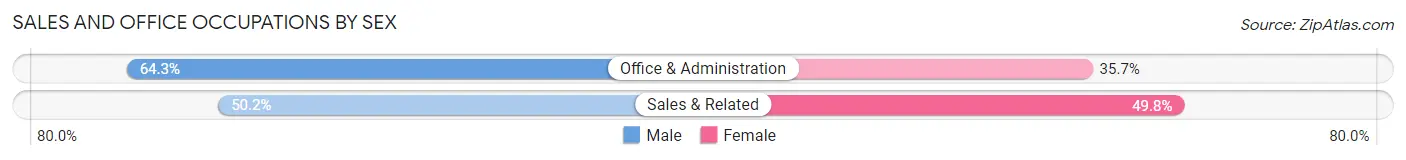
| Occupation | Male | Female |
| Sales & Related | 122 (50.2%) | 121 (49.8%) |
| Office & Administration | 90 (64.3%) | 50 (35.7%) |
| Total (Category) | 212 (55.3%) | 171 (44.7%) |
| Total (Overall) | 1,270 (60.6%) | 826 (39.4%) |
Natural Resources, Construction and Maintenance Occupations
The most common Natural Resources, Construction and Maintenance occupations in Armonk are Construction & Extraction (81 | 3.9%), and Installation, Maintenance & Repair (11 | 0.5%).
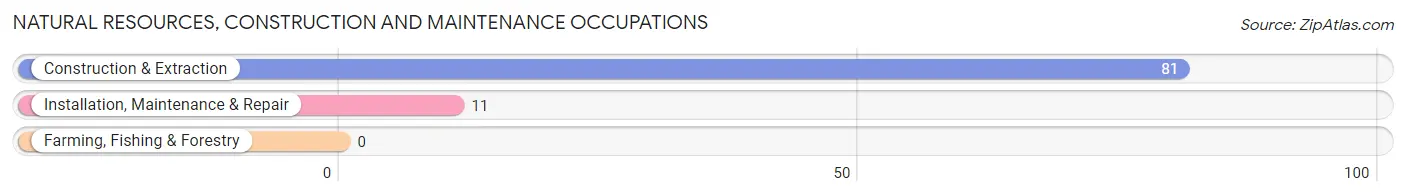
Natural Resources, Construction and Maintenance Occupations by Sex
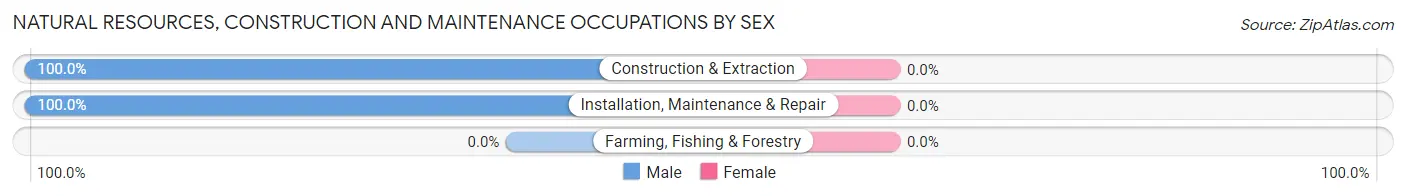
| Occupation | Male | Female |
| Farming, Fishing & Forestry | 0 (0.0%) | 0 (0.0%) |
| Construction & Extraction | 81 (100.0%) | 0 (0.0%) |
| Installation, Maintenance & Repair | 11 (100.0%) | 0 (0.0%) |
| Total (Category) | 92 (100.0%) | 0 (0.0%) |
| Total (Overall) | 1,270 (60.6%) | 826 (39.4%) |
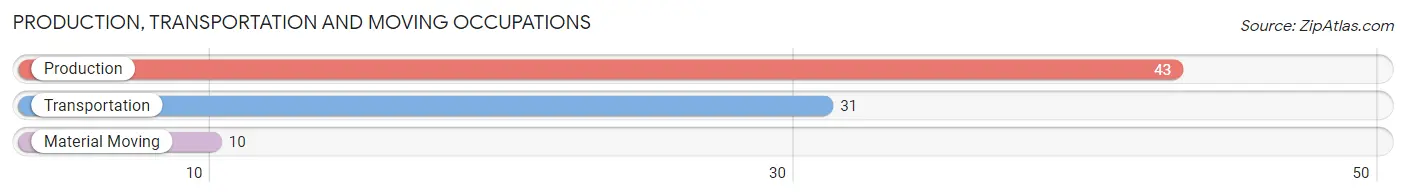
Production, Transportation and Moving Occupations
The most common Production, Transportation and Moving occupations in Armonk are Production (43 | 2.1%), Transportation (31 | 1.5%), and Material Moving (10 | 0.5%).
Production, Transportation and Moving Occupations by Sex
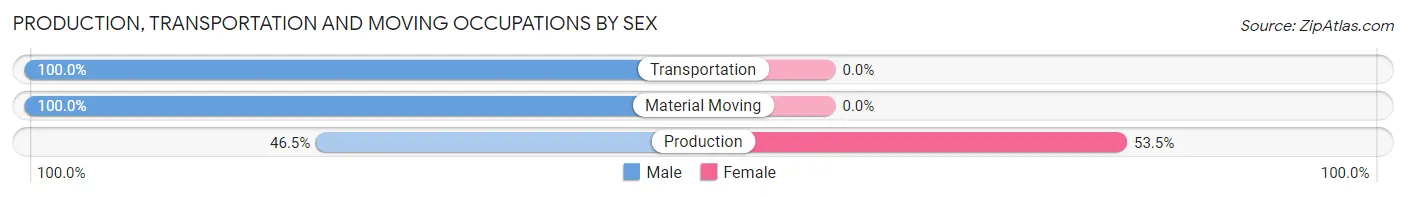
| Occupation | Male | Female |
| Production | 20 (46.5%) | 23 (53.5%) |
| Transportation | 31 (100.0%) | 0 (0.0%) |
| Material Moving | 10 (100.0%) | 0 (0.0%) |
| Total (Category) | 61 (72.6%) | 23 (27.4%) |
| Total (Overall) | 1,270 (60.6%) | 826 (39.4%) |
Employment Industries by Sex in Armonk
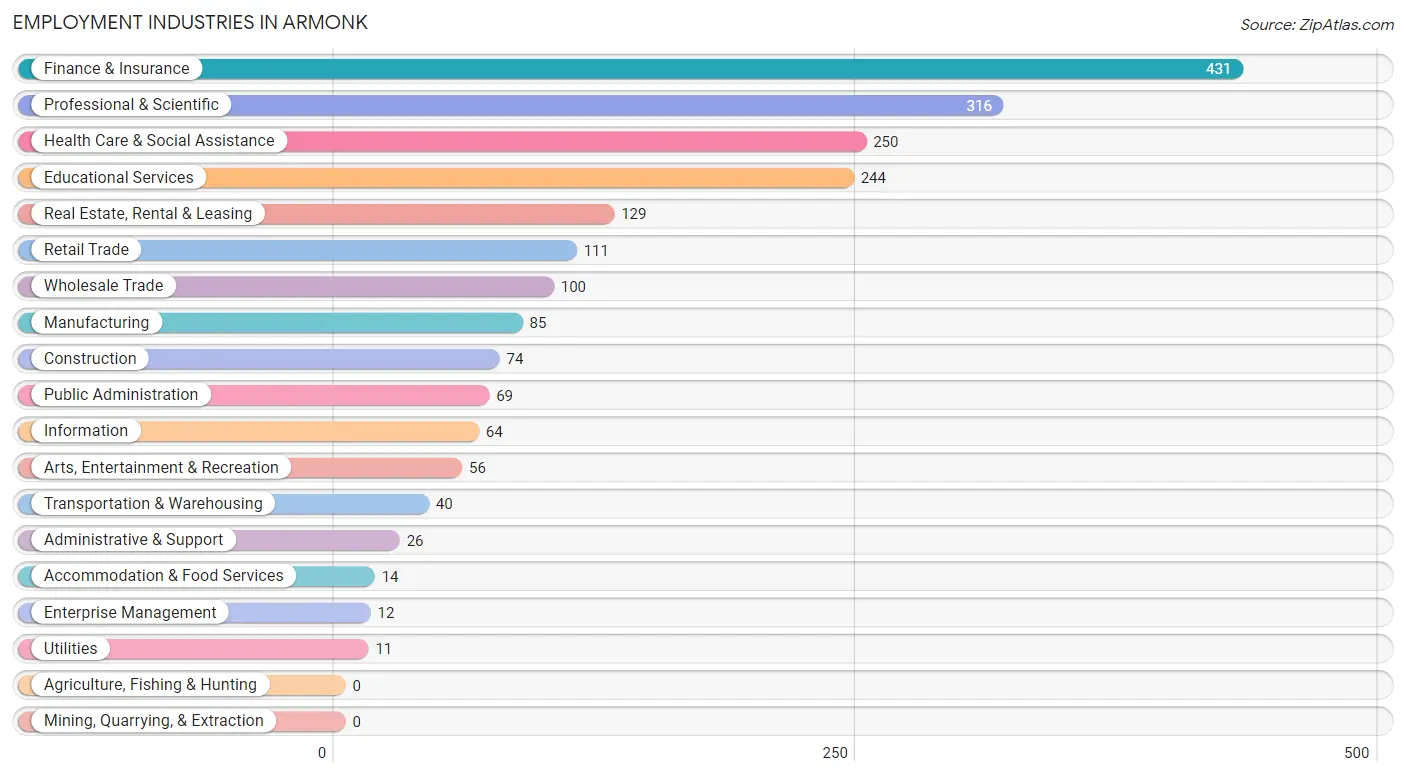
Employment Industries in Armonk
The major employment industries in Armonk include Finance & Insurance (431 | 20.6%), Professional & Scientific (316 | 15.1%), Health Care & Social Assistance (250 | 11.9%), Educational Services (244 | 11.6%), and Real Estate, Rental & Leasing (129 | 6.1%).
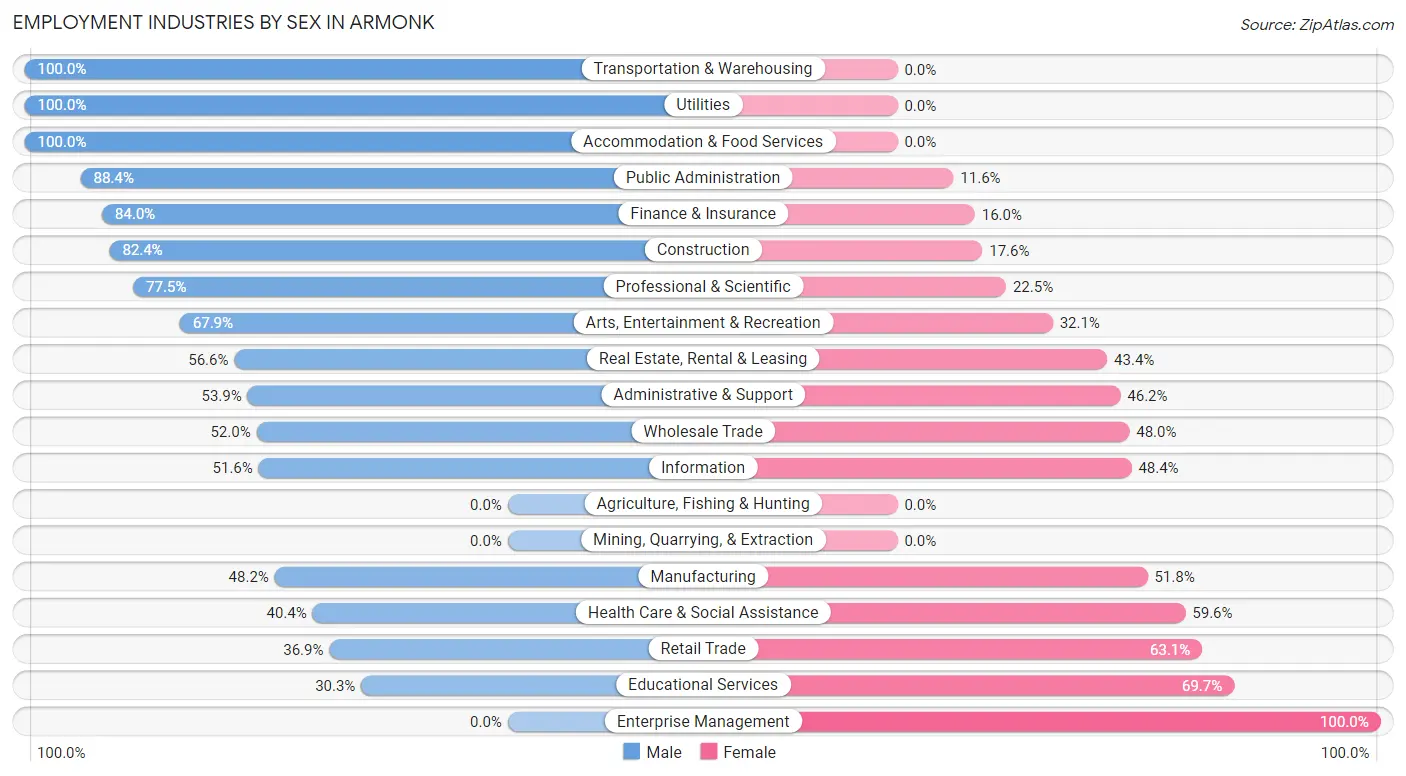
Employment Industries by Sex in Armonk
The Armonk industries that see more men than women are Transportation & Warehousing (100.0%), Utilities (100.0%), and Accommodation & Food Services (100.0%), whereas the industries that tend to have a higher number of women are Enterprise Management (100.0%), Educational Services (69.7%), and Retail Trade (63.1%).
| Industry | Male | Female |
| Agriculture, Fishing & Hunting | 0 (0.0%) | 0 (0.0%) |
| Mining, Quarrying, & Extraction | 0 (0.0%) | 0 (0.0%) |
| Construction | 61 (82.4%) | 13 (17.6%) |
| Manufacturing | 41 (48.2%) | 44 (51.8%) |
| Wholesale Trade | 52 (52.0%) | 48 (48.0%) |
| Retail Trade | 41 (36.9%) | 70 (63.1%) |
| Transportation & Warehousing | 40 (100.0%) | 0 (0.0%) |
| Utilities | 11 (100.0%) | 0 (0.0%) |
| Information | 33 (51.6%) | 31 (48.4%) |
| Finance & Insurance | 362 (84.0%) | 69 (16.0%) |
| Real Estate, Rental & Leasing | 73 (56.6%) | 56 (43.4%) |
| Professional & Scientific | 245 (77.5%) | 71 (22.5%) |
| Enterprise Management | 0 (0.0%) | 12 (100.0%) |
| Administrative & Support | 14 (53.8%) | 12 (46.2%) |
| Educational Services | 74 (30.3%) | 170 (69.7%) |
| Health Care & Social Assistance | 101 (40.4%) | 149 (59.6%) |
| Arts, Entertainment & Recreation | 38 (67.9%) | 18 (32.1%) |
| Accommodation & Food Services | 14 (100.0%) | 0 (0.0%) |
| Public Administration | 61 (88.4%) | 8 (11.6%) |
| Total | 1,270 (60.6%) | 826 (39.4%) |
Education in Armonk
School Enrollment in Armonk
The most common levels of schooling among the 1,113 students in Armonk are high school (263 | 23.6%), elementary school (225 | 20.2%), and middle school (224 | 20.1%).
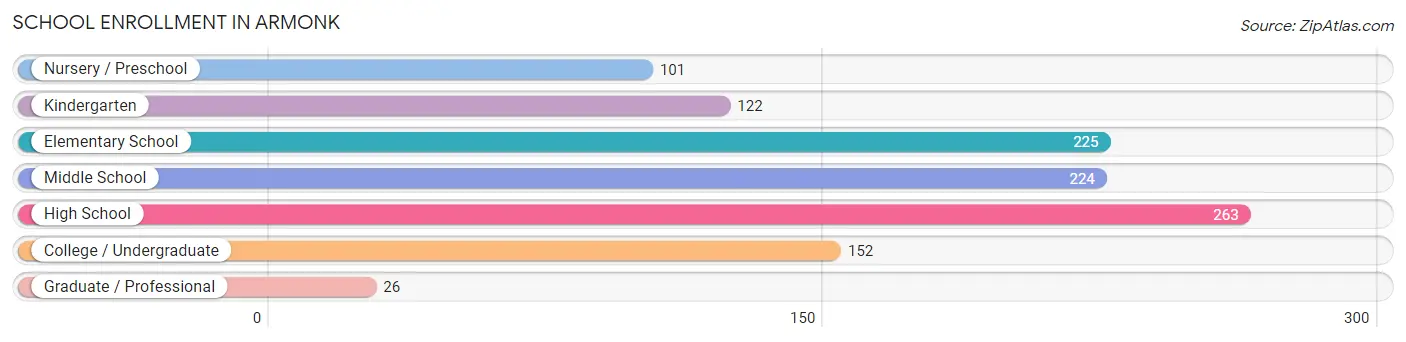
| School Level | # Students | % Students |
| Nursery / Preschool | 101 | 9.1% |
| Kindergarten | 122 | 11.0% |
| Elementary School | 225 | 20.2% |
| Middle School | 224 | 20.1% |
| High School | 263 | 23.6% |
| College / Undergraduate | 152 | 13.7% |
| Graduate / Professional | 26 | 2.3% |
| Total | 1,113 | 100.0% |
School Enrollment by Age by Funding Source in Armonk
Out of a total of 1,113 students who are enrolled in schools in Armonk, 137 (12.3%) attend a private institution, while the remaining 976 (87.7%) are enrolled in public schools. The age group of 20 to 24 year olds has the highest likelihood of being enrolled in private schools, with 39 (50.0% in the age bracket) enrolled. Conversely, the age group of 10 to 14 year olds has the lowest likelihood of being enrolled in a private school, with 234 (100.0% in the age bracket) attending a public institution.
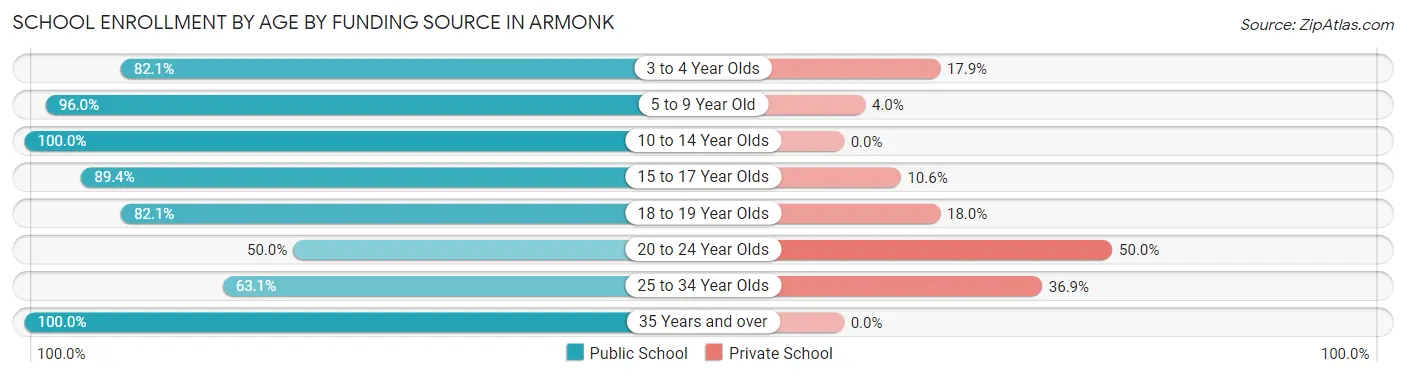
| Age Bracket | Public School | Private School |
| 3 to 4 Year Olds | 119 (82.1%) | 26 (17.9%) |
| 5 to 9 Year Old | 291 (96.0%) | 12 (4.0%) |
| 10 to 14 Year Olds | 234 (100.0%) | 0 (0.0%) |
| 15 to 17 Year Olds | 186 (89.4%) | 22 (10.6%) |
| 18 to 19 Year Olds | 64 (82.1%) | 14 (17.9%) |
| 20 to 24 Year Olds | 39 (50.0%) | 39 (50.0%) |
| 25 to 34 Year Olds | 41 (63.1%) | 24 (36.9%) |
| 35 Years and over | 2 (100.0%) | 0 (0.0%) |
| Total | 976 (87.7%) | 137 (12.3%) |
Educational Attainment by Field of Study in Armonk
Business (637 | 25.4%), social sciences (337 | 13.4%), education (254 | 10.1%), engineering (174 | 6.9%), and psychology (160 | 6.4%) are the most common fields of study among 2,509 individuals in Armonk who have obtained a bachelor's degree or higher.
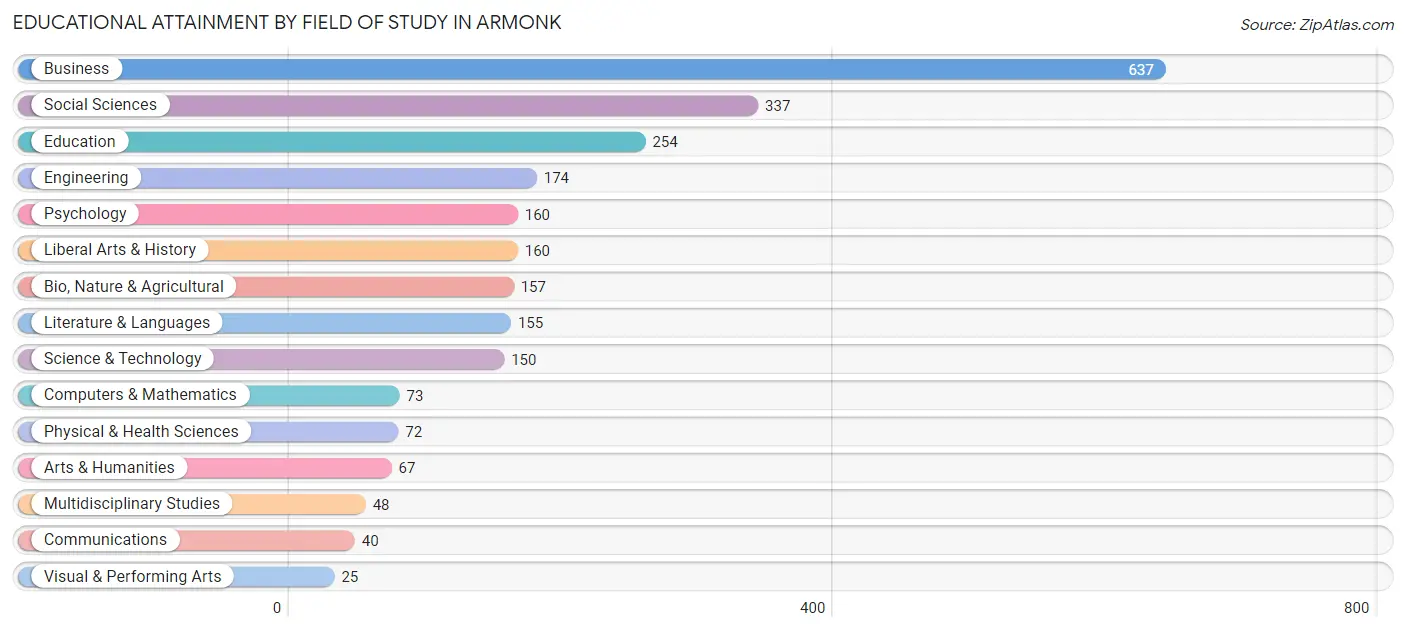
| Field of Study | # Graduates | % Graduates |
| Computers & Mathematics | 73 | 2.9% |
| Bio, Nature & Agricultural | 157 | 6.3% |
| Physical & Health Sciences | 72 | 2.9% |
| Psychology | 160 | 6.4% |
| Social Sciences | 337 | 13.4% |
| Engineering | 174 | 6.9% |
| Multidisciplinary Studies | 48 | 1.9% |
| Science & Technology | 150 | 6.0% |
| Business | 637 | 25.4% |
| Education | 254 | 10.1% |
| Literature & Languages | 155 | 6.2% |
| Liberal Arts & History | 160 | 6.4% |
| Visual & Performing Arts | 25 | 1.0% |
| Communications | 40 | 1.6% |
| Arts & Humanities | 67 | 2.7% |
| Total | 2,509 | 100.0% |
Transportation & Commute in Armonk
Vehicle Availability by Sex in Armonk
The most prevalent vehicle ownership categories in Armonk are males with 2 vehicles (660, accounting for 53.2%) and females with 2 vehicles (362, making up 83.7%).
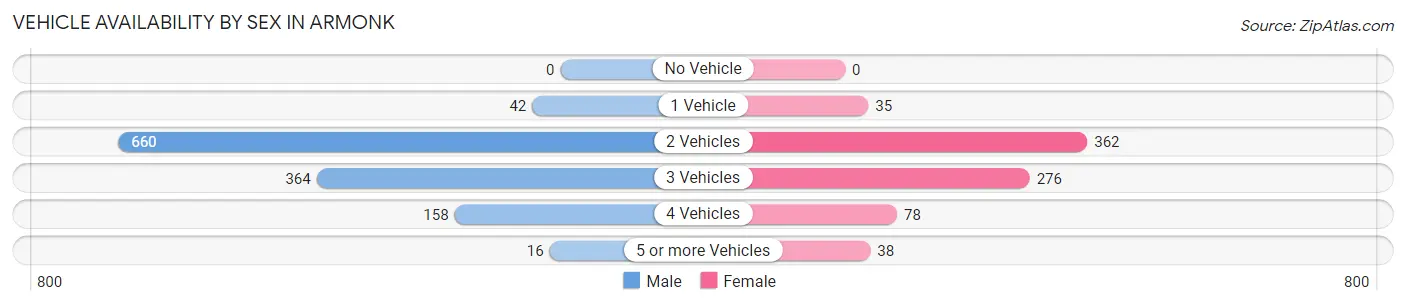
| Vehicles Available | Male | Female |
| No Vehicle | 0 (0.0%) | 0 (0.0%) |
| 1 Vehicle | 42 (3.4%) | 35 (4.4%) |
| 2 Vehicles | 660 (53.2%) | 362 (45.9%) |
| 3 Vehicles | 364 (29.3%) | 276 (35.0%) |
| 4 Vehicles | 158 (12.7%) | 78 (9.9%) |
| 5 or more Vehicles | 16 (1.3%) | 38 (4.8%) |
| Total | 1,240 (100.0%) | 789 (100.0%) |
Commute Time in Armonk
The most frequently occuring commute durations in Armonk are 60 to 89 minutes (306 commuters, 19.9%), 45 to 59 minutes (228 commuters, 14.8%), and 10 to 14 minutes (178 commuters, 11.6%).
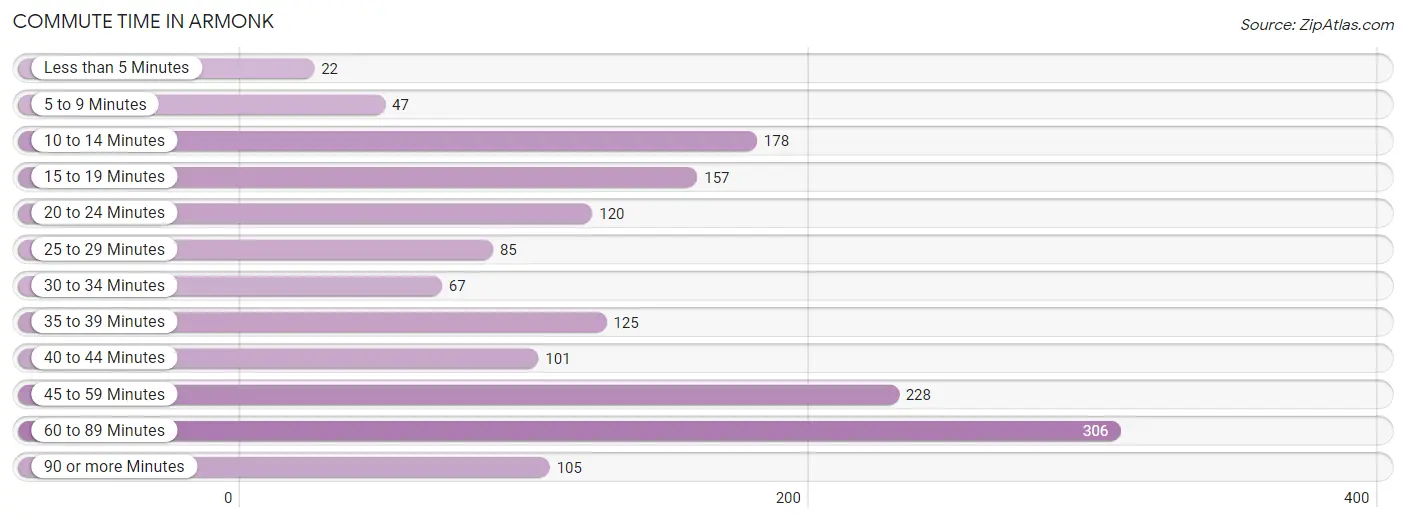
| Commute Time | # Commuters | % Commuters |
| Less than 5 Minutes | 22 | 1.4% |
| 5 to 9 Minutes | 47 | 3.0% |
| 10 to 14 Minutes | 178 | 11.6% |
| 15 to 19 Minutes | 157 | 10.2% |
| 20 to 24 Minutes | 120 | 7.8% |
| 25 to 29 Minutes | 85 | 5.5% |
| 30 to 34 Minutes | 67 | 4.3% |
| 35 to 39 Minutes | 125 | 8.1% |
| 40 to 44 Minutes | 101 | 6.6% |
| 45 to 59 Minutes | 228 | 14.8% |
| 60 to 89 Minutes | 306 | 19.9% |
| 90 or more Minutes | 105 | 6.8% |
Commute Time by Sex in Armonk
The most common commute times in Armonk are 60 to 89 minutes (227 commuters, 24.9%) for males and 60 to 89 minutes (79 commuters, 12.6%) for females.
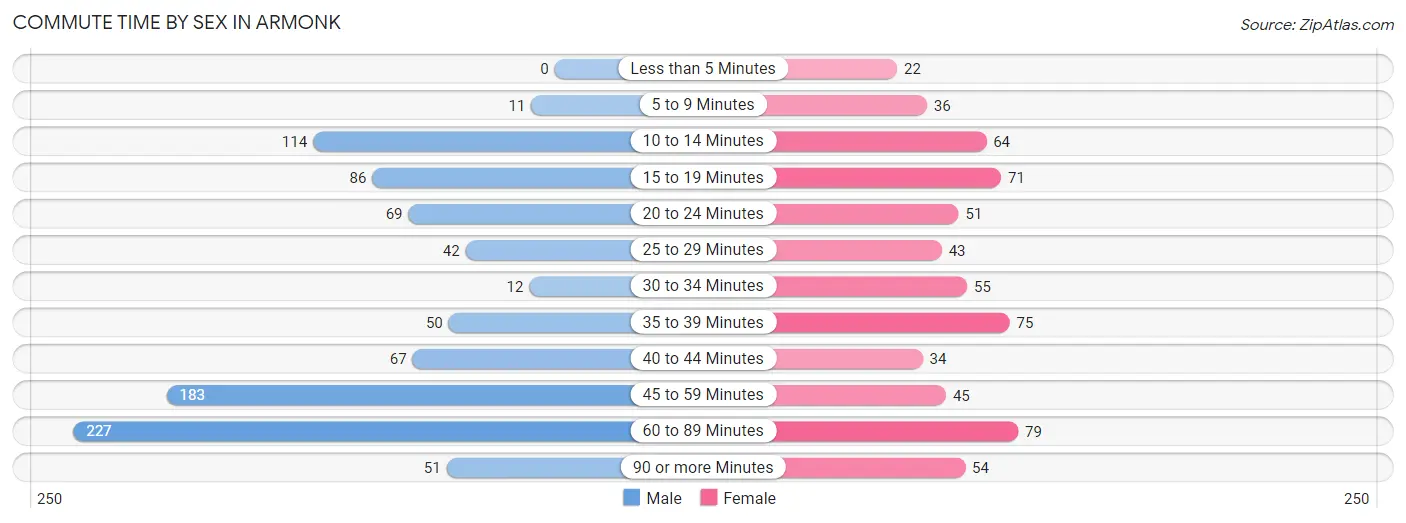
| Commute Time | Male | Female |
| Less than 5 Minutes | 0 (0.0%) | 22 (3.5%) |
| 5 to 9 Minutes | 11 (1.2%) | 36 (5.7%) |
| 10 to 14 Minutes | 114 (12.5%) | 64 (10.2%) |
| 15 to 19 Minutes | 86 (9.4%) | 71 (11.3%) |
| 20 to 24 Minutes | 69 (7.6%) | 51 (8.1%) |
| 25 to 29 Minutes | 42 (4.6%) | 43 (6.8%) |
| 30 to 34 Minutes | 12 (1.3%) | 55 (8.7%) |
| 35 to 39 Minutes | 50 (5.5%) | 75 (11.9%) |
| 40 to 44 Minutes | 67 (7.3%) | 34 (5.4%) |
| 45 to 59 Minutes | 183 (20.1%) | 45 (7.1%) |
| 60 to 89 Minutes | 227 (24.9%) | 79 (12.6%) |
| 90 or more Minutes | 51 (5.6%) | 54 (8.6%) |
Time of Departure to Work by Sex in Armonk
The most frequent times of departure to work in Armonk are 7:00 AM to 7:29 AM (144, 15.8%) for males and 7:00 AM to 7:29 AM (176, 28.0%) for females.
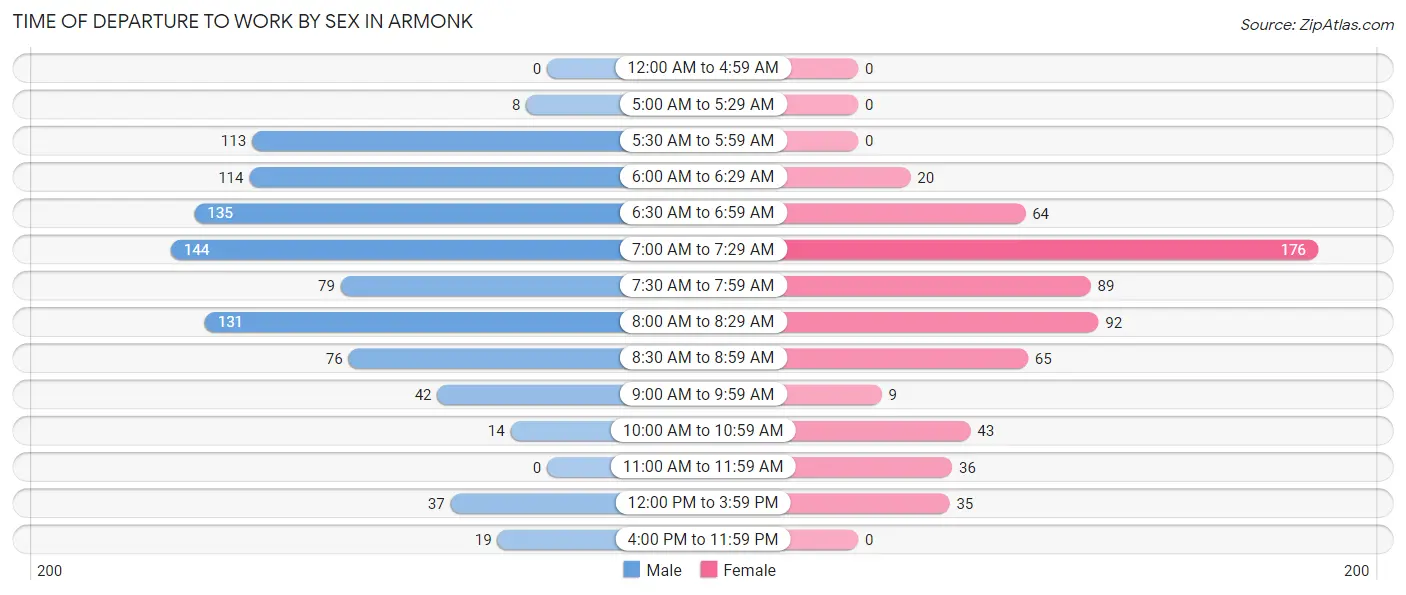
| Time of Departure | Male | Female |
| 12:00 AM to 4:59 AM | 0 (0.0%) | 0 (0.0%) |
| 5:00 AM to 5:29 AM | 8 (0.9%) | 0 (0.0%) |
| 5:30 AM to 5:59 AM | 113 (12.4%) | 0 (0.0%) |
| 6:00 AM to 6:29 AM | 114 (12.5%) | 20 (3.2%) |
| 6:30 AM to 6:59 AM | 135 (14.8%) | 64 (10.2%) |
| 7:00 AM to 7:29 AM | 144 (15.8%) | 176 (28.0%) |
| 7:30 AM to 7:59 AM | 79 (8.7%) | 89 (14.1%) |
| 8:00 AM to 8:29 AM | 131 (14.4%) | 92 (14.6%) |
| 8:30 AM to 8:59 AM | 76 (8.3%) | 65 (10.3%) |
| 9:00 AM to 9:59 AM | 42 (4.6%) | 9 (1.4%) |
| 10:00 AM to 10:59 AM | 14 (1.5%) | 43 (6.8%) |
| 11:00 AM to 11:59 AM | 0 (0.0%) | 36 (5.7%) |
| 12:00 PM to 3:59 PM | 37 (4.1%) | 35 (5.6%) |
| 4:00 PM to 11:59 PM | 19 (2.1%) | 0 (0.0%) |
| Total | 912 (100.0%) | 629 (100.0%) |
Housing Occupancy in Armonk
Occupancy by Ownership in Armonk
Of the total 1,471 dwellings in Armonk, owner-occupied units account for 1,290 (87.7%), while renter-occupied units make up 181 (12.3%).
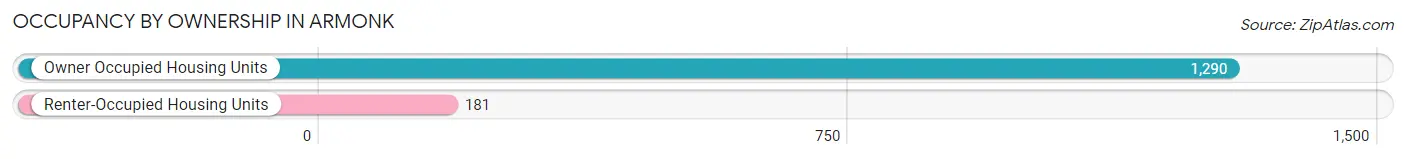
| Occupancy | # Housing Units | % Housing Units |
| Owner Occupied Housing Units | 1,290 | 87.7% |
| Renter-Occupied Housing Units | 181 | 12.3% |
| Total Occupied Housing Units | 1,471 | 100.0% |
Occupancy by Household Size in Armonk
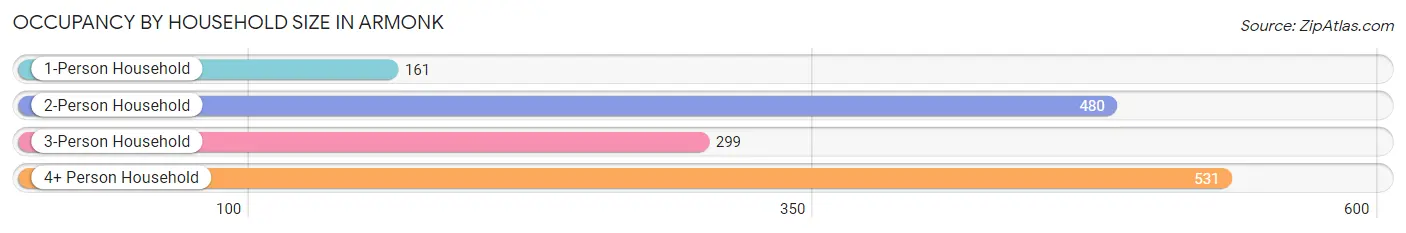
| Household Size | # Housing Units | % Housing Units |
| 1-Person Household | 161 | 10.9% |
| 2-Person Household | 480 | 32.6% |
| 3-Person Household | 299 | 20.3% |
| 4+ Person Household | 531 | 36.1% |
| Total Housing Units | 1,471 | 100.0% |
Occupancy by Ownership by Household Size in Armonk
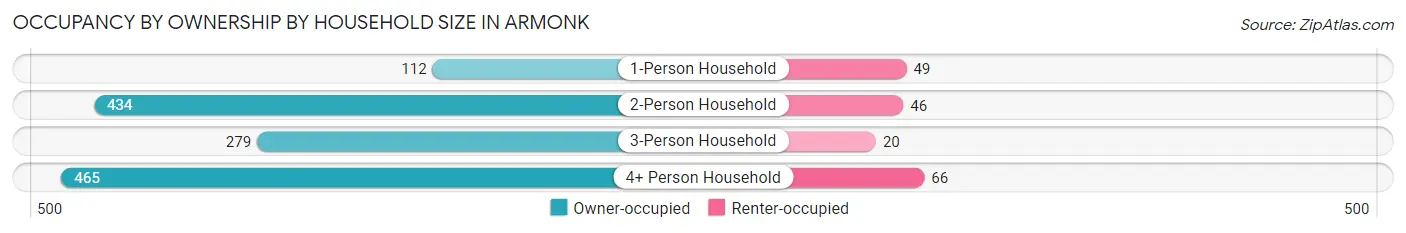
| Household Size | Owner-occupied | Renter-occupied |
| 1-Person Household | 112 (69.6%) | 49 (30.4%) |
| 2-Person Household | 434 (90.4%) | 46 (9.6%) |
| 3-Person Household | 279 (93.3%) | 20 (6.7%) |
| 4+ Person Household | 465 (87.6%) | 66 (12.4%) |
| Total Housing Units | 1,290 (87.7%) | 181 (12.3%) |
Occupancy by Educational Attainment in Armonk
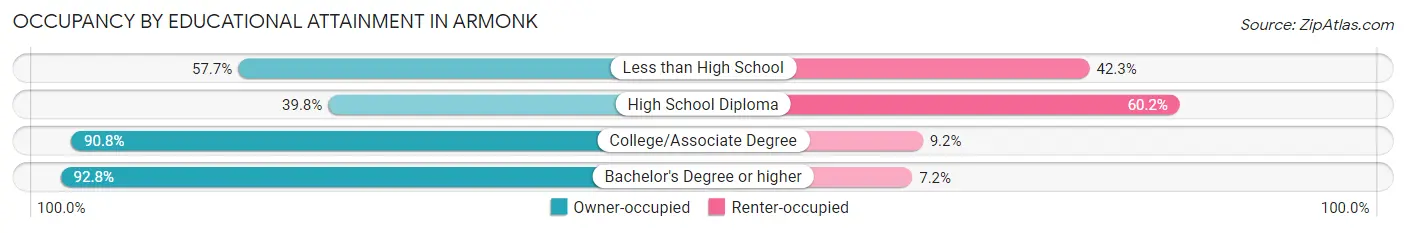
| Household Size | Owner-occupied | Renter-occupied |
| Less than High School | 15 (57.7%) | 11 (42.3%) |
| High School Diploma | 47 (39.8%) | 71 (60.2%) |
| College/Associate Degree | 177 (90.8%) | 18 (9.2%) |
| Bachelor's Degree or higher | 1,051 (92.8%) | 81 (7.2%) |
Occupancy by Age of Householder in Armonk
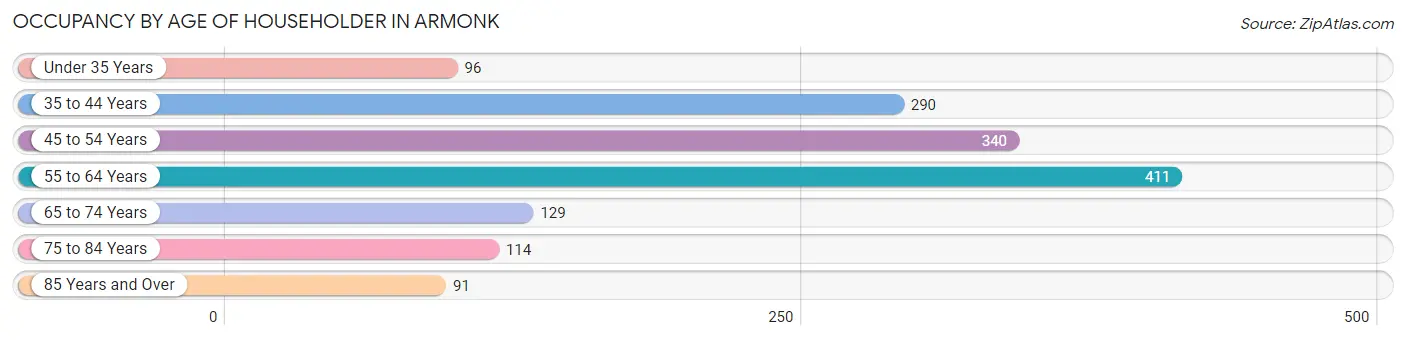
| Age Bracket | # Households | % Households |
| Under 35 Years | 96 | 6.5% |
| 35 to 44 Years | 290 | 19.7% |
| 45 to 54 Years | 340 | 23.1% |
| 55 to 64 Years | 411 | 27.9% |
| 65 to 74 Years | 129 | 8.8% |
| 75 to 84 Years | 114 | 7.7% |
| 85 Years and Over | 91 | 6.2% |
| Total | 1,471 | 100.0% |
Housing Finances in Armonk
Median Income by Occupancy in Armonk
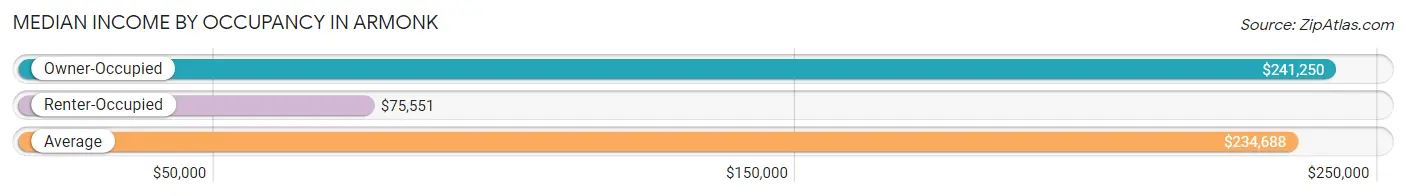
| Occupancy Type | # Households | Median Income |
| Owner-Occupied | 1,290 (87.7%) | $241,250 |
| Renter-Occupied | 181 (12.3%) | $75,551 |
| Average | 1,471 (100.0%) | $234,688 |
Occupancy by Householder Income Bracket in Armonk
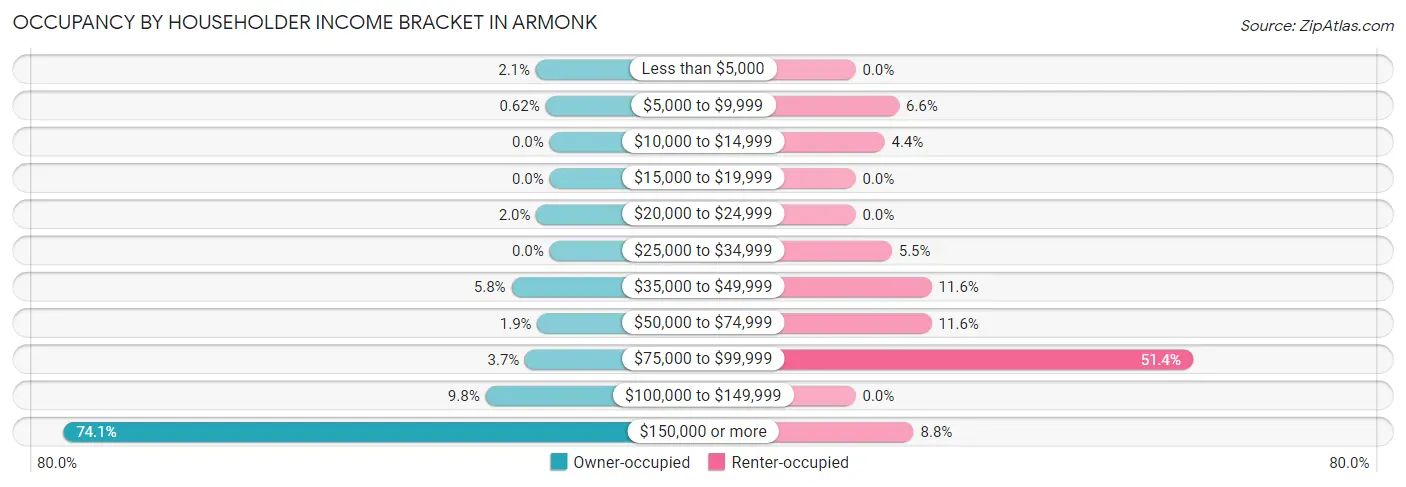
| Income Bracket | Owner-occupied | Renter-occupied |
| Less than $5,000 | 27 (2.1%) | 0 (0.0%) |
| $5,000 to $9,999 | 8 (0.6%) | 12 (6.6%) |
| $10,000 to $14,999 | 0 (0.0%) | 8 (4.4%) |
| $15,000 to $19,999 | 0 (0.0%) | 0 (0.0%) |
| $20,000 to $24,999 | 26 (2.0%) | 0 (0.0%) |
| $25,000 to $34,999 | 0 (0.0%) | 10 (5.5%) |
| $35,000 to $49,999 | 75 (5.8%) | 21 (11.6%) |
| $50,000 to $74,999 | 24 (1.9%) | 21 (11.6%) |
| $75,000 to $99,999 | 48 (3.7%) | 93 (51.4%) |
| $100,000 to $149,999 | 126 (9.8%) | 0 (0.0%) |
| $150,000 or more | 956 (74.1%) | 16 (8.8%) |
| Total | 1,290 (100.0%) | 181 (100.0%) |
Monthly Housing Cost Tiers in Armonk
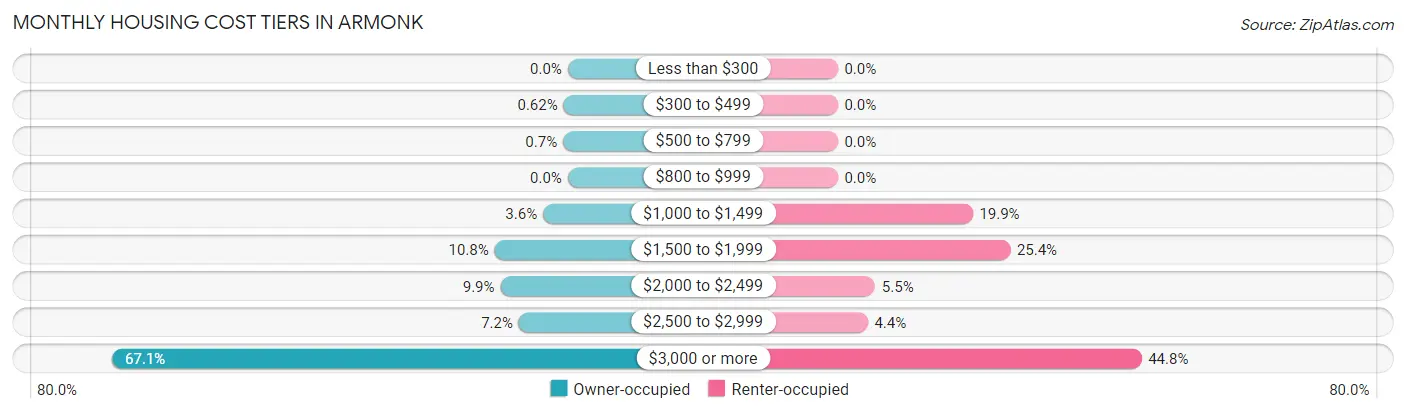
| Monthly Cost | Owner-occupied | Renter-occupied |
| Less than $300 | 0 (0.0%) | 0 (0.0%) |
| $300 to $499 | 8 (0.6%) | 0 (0.0%) |
| $500 to $799 | 9 (0.7%) | 0 (0.0%) |
| $800 to $999 | 0 (0.0%) | 0 (0.0%) |
| $1,000 to $1,499 | 47 (3.6%) | 36 (19.9%) |
| $1,500 to $1,999 | 139 (10.8%) | 46 (25.4%) |
| $2,000 to $2,499 | 128 (9.9%) | 10 (5.5%) |
| $2,500 to $2,999 | 93 (7.2%) | 8 (4.4%) |
| $3,000 or more | 866 (67.1%) | 81 (44.8%) |
| Total | 1,290 (100.0%) | 181 (100.0%) |
Physical Housing Characteristics in Armonk
Housing Structures in Armonk
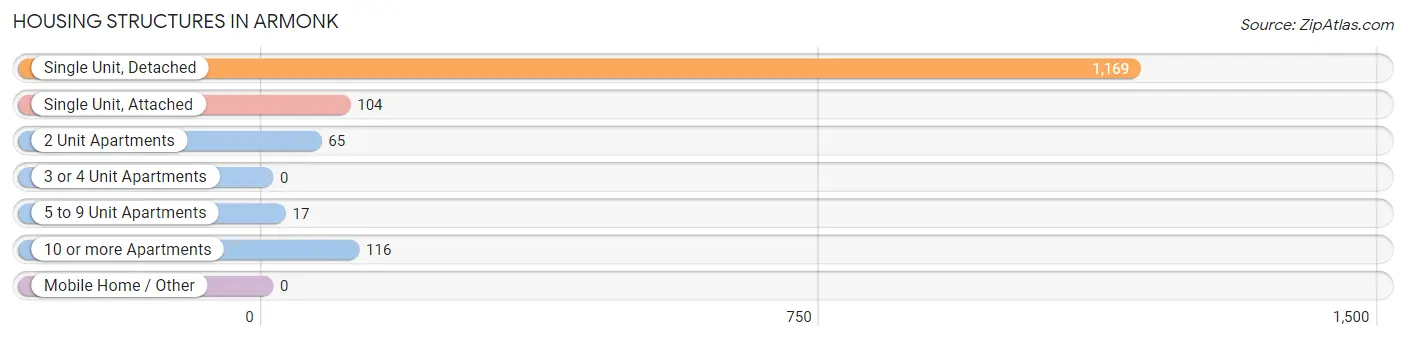
| Structure Type | # Housing Units | % Housing Units |
| Single Unit, Detached | 1,169 | 79.5% |
| Single Unit, Attached | 104 | 7.1% |
| 2 Unit Apartments | 65 | 4.4% |
| 3 or 4 Unit Apartments | 0 | 0.0% |
| 5 to 9 Unit Apartments | 17 | 1.2% |
| 10 or more Apartments | 116 | 7.9% |
| Mobile Home / Other | 0 | 0.0% |
| Total | 1,471 | 100.0% |
Housing Structures by Occupancy in Armonk
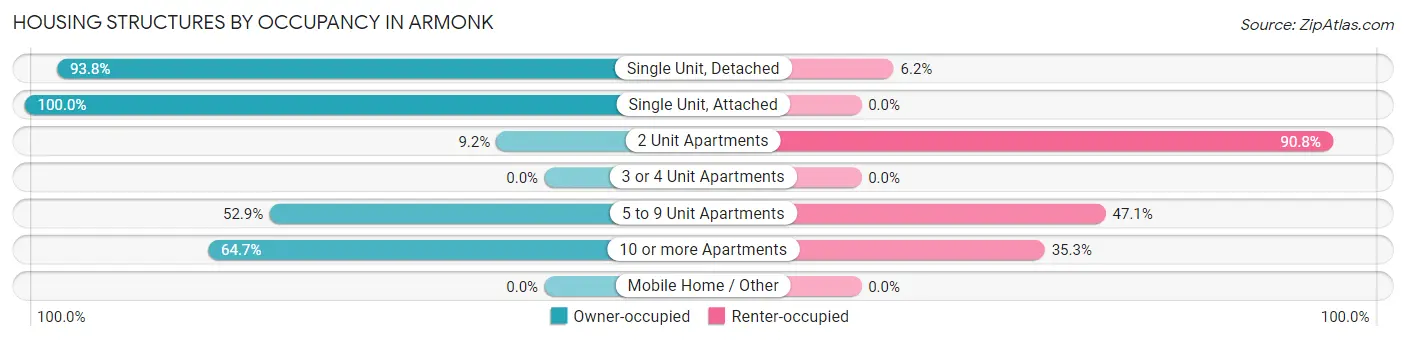
| Structure Type | Owner-occupied | Renter-occupied |
| Single Unit, Detached | 1,096 (93.8%) | 73 (6.2%) |
| Single Unit, Attached | 104 (100.0%) | 0 (0.0%) |
| 2 Unit Apartments | 6 (9.2%) | 59 (90.8%) |
| 3 or 4 Unit Apartments | 0 (0.0%) | 0 (0.0%) |
| 5 to 9 Unit Apartments | 9 (52.9%) | 8 (47.1%) |
| 10 or more Apartments | 75 (64.7%) | 41 (35.3%) |
| Mobile Home / Other | 0 (0.0%) | 0 (0.0%) |
| Total | 1,290 (87.7%) | 181 (12.3%) |
Housing Structures by Number of Rooms in Armonk
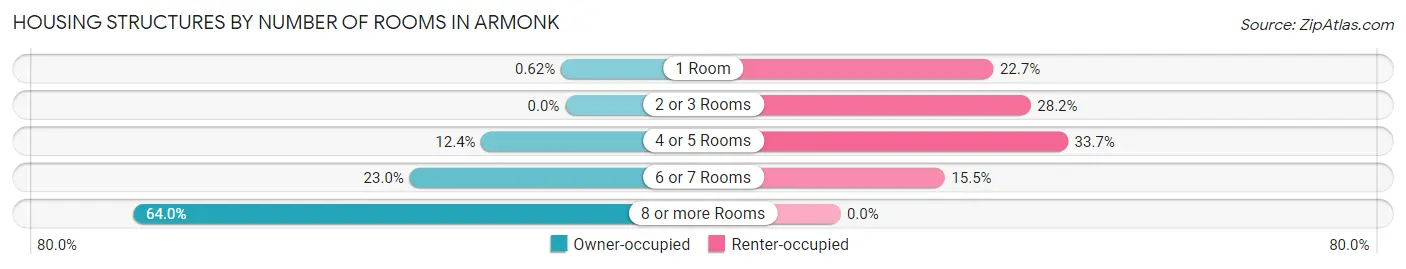
| Number of Rooms | Owner-occupied | Renter-occupied |
| 1 Room | 8 (0.6%) | 41 (22.7%) |
| 2 or 3 Rooms | 0 (0.0%) | 51 (28.2%) |
| 4 or 5 Rooms | 160 (12.4%) | 61 (33.7%) |
| 6 or 7 Rooms | 297 (23.0%) | 28 (15.5%) |
| 8 or more Rooms | 825 (63.9%) | 0 (0.0%) |
| Total | 1,290 (100.0%) | 181 (100.0%) |
Housing Structure by Heating Type in Armonk
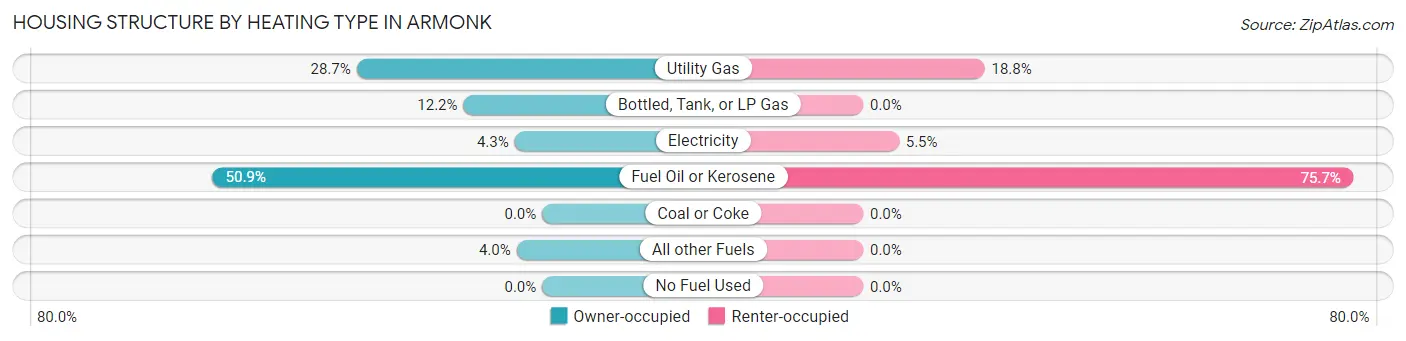
| Heating Type | Owner-occupied | Renter-occupied |
| Utility Gas | 370 (28.7%) | 34 (18.8%) |
| Bottled, Tank, or LP Gas | 157 (12.2%) | 0 (0.0%) |
| Electricity | 55 (4.3%) | 10 (5.5%) |
| Fuel Oil or Kerosene | 657 (50.9%) | 137 (75.7%) |
| Coal or Coke | 0 (0.0%) | 0 (0.0%) |
| All other Fuels | 51 (4.0%) | 0 (0.0%) |
| No Fuel Used | 0 (0.0%) | 0 (0.0%) |
| Total | 1,290 (100.0%) | 181 (100.0%) |
Household Vehicle Usage in Armonk
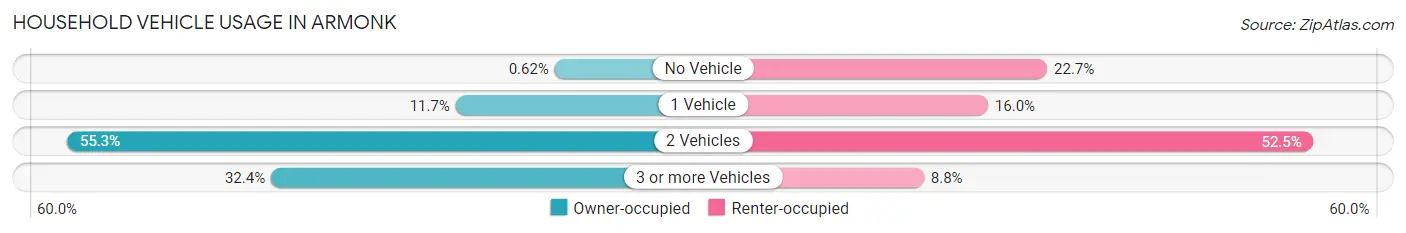
| Vehicles per Household | Owner-occupied | Renter-occupied |
| No Vehicle | 8 (0.6%) | 41 (22.7%) |
| 1 Vehicle | 151 (11.7%) | 29 (16.0%) |
| 2 Vehicles | 713 (55.3%) | 95 (52.5%) |
| 3 or more Vehicles | 418 (32.4%) | 16 (8.8%) |
| Total | 1,290 (100.0%) | 181 (100.0%) |
Real Estate & Mortgages in Armonk
Real Estate and Mortgage Overview in Armonk
| Characteristic | Without Mortgage | With Mortgage |
| Housing Units | 362 | 928 |
| Median Property Value | $1,004,400 | $1,008,500 |
| Median Household Income | $198,889 | $730 |
| Monthly Housing Costs | $1,501 | $759 |
| Real Estate Taxes | $10,001 | $0 |
Property Value by Mortgage Status in Armonk
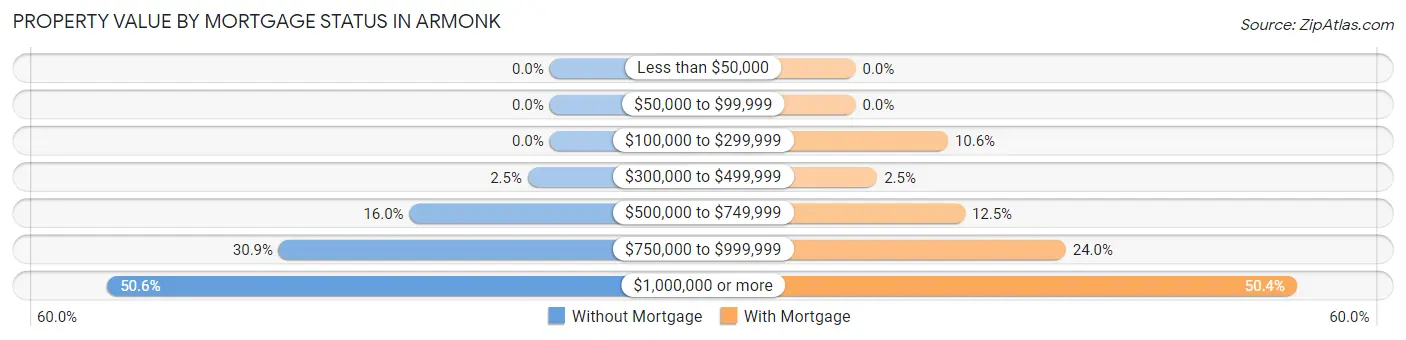
| Property Value | Without Mortgage | With Mortgage |
| Less than $50,000 | 0 (0.0%) | 0 (0.0%) |
| $50,000 to $99,999 | 0 (0.0%) | 0 (0.0%) |
| $100,000 to $299,999 | 0 (0.0%) | 98 (10.6%) |
| $300,000 to $499,999 | 9 (2.5%) | 23 (2.5%) |
| $500,000 to $749,999 | 58 (16.0%) | 116 (12.5%) |
| $750,000 to $999,999 | 112 (30.9%) | 223 (24.0%) |
| $1,000,000 or more | 183 (50.5%) | 468 (50.4%) |
| Total | 362 (100.0%) | 928 (100.0%) |
Household Income by Mortgage Status in Armonk
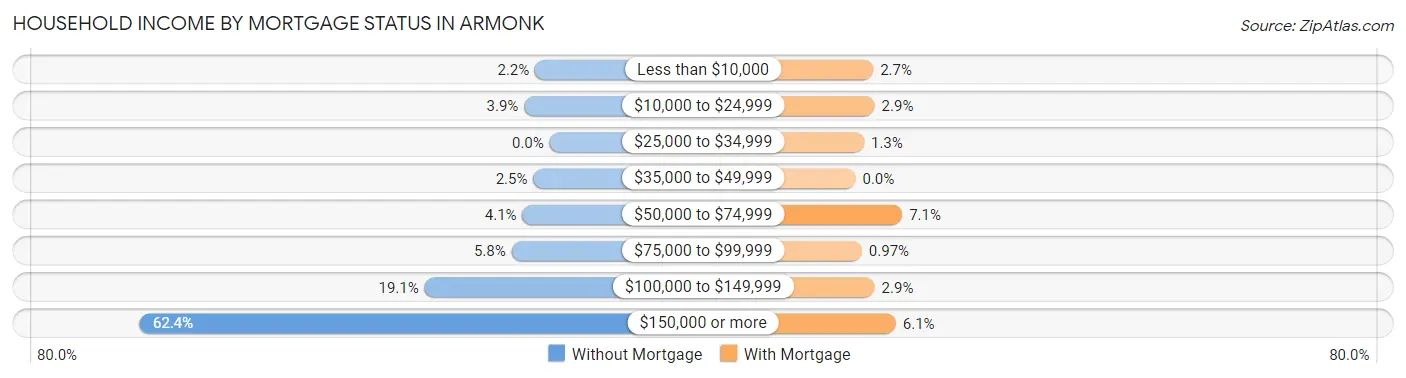
| Household Income | Without Mortgage | With Mortgage |
| Less than $10,000 | 8 (2.2%) | 25 (2.7%) |
| $10,000 to $24,999 | 14 (3.9%) | 27 (2.9%) |
| $25,000 to $34,999 | 0 (0.0%) | 12 (1.3%) |
| $35,000 to $49,999 | 9 (2.5%) | 0 (0.0%) |
| $50,000 to $74,999 | 15 (4.1%) | 66 (7.1%) |
| $75,000 to $99,999 | 21 (5.8%) | 9 (1.0%) |
| $100,000 to $149,999 | 69 (19.1%) | 27 (2.9%) |
| $150,000 or more | 226 (62.4%) | 57 (6.1%) |
| Total | 362 (100.0%) | 928 (100.0%) |
Property Value to Household Income Ratio in Armonk
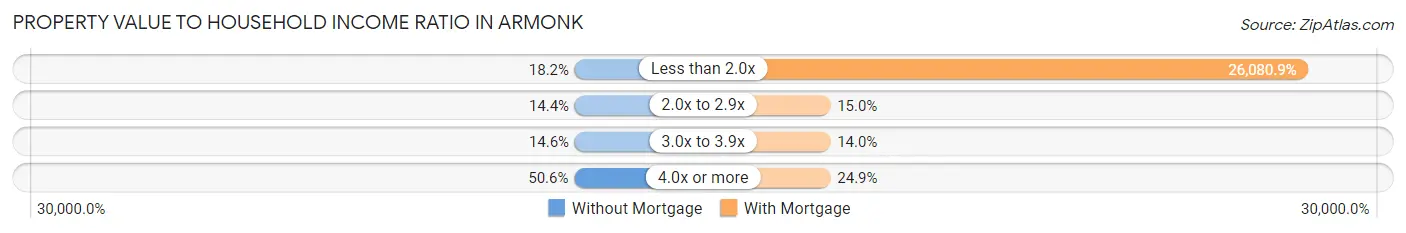
| Value-to-Income Ratio | Without Mortgage | With Mortgage |
| Less than 2.0x | 66 (18.2%) | 242,031 (26,080.9%) |
| 2.0x to 2.9x | 52 (14.4%) | 139 (15.0%) |
| 3.0x to 3.9x | 53 (14.6%) | 130 (14.0%) |
| 4.0x or more | 183 (50.5%) | 231 (24.9%) |
| Total | 362 (100.0%) | 928 (100.0%) |
Real Estate Taxes by Mortgage Status in Armonk
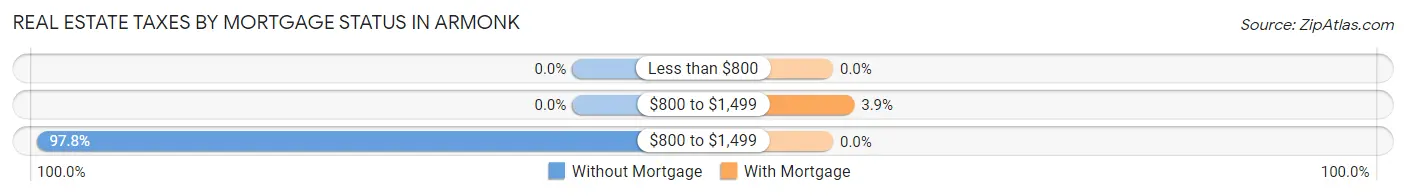
| Property Taxes | Without Mortgage | With Mortgage |
| Less than $800 | 0 (0.0%) | 0 (0.0%) |
| $800 to $1,499 | 0 (0.0%) | 36 (3.9%) |
| $800 to $1,499 | 354 (97.8%) | 0 (0.0%) |
| Total | 362 (100.0%) | 928 (100.0%) |
Health & Disability in Armonk
Health Insurance Coverage by Age in Armonk
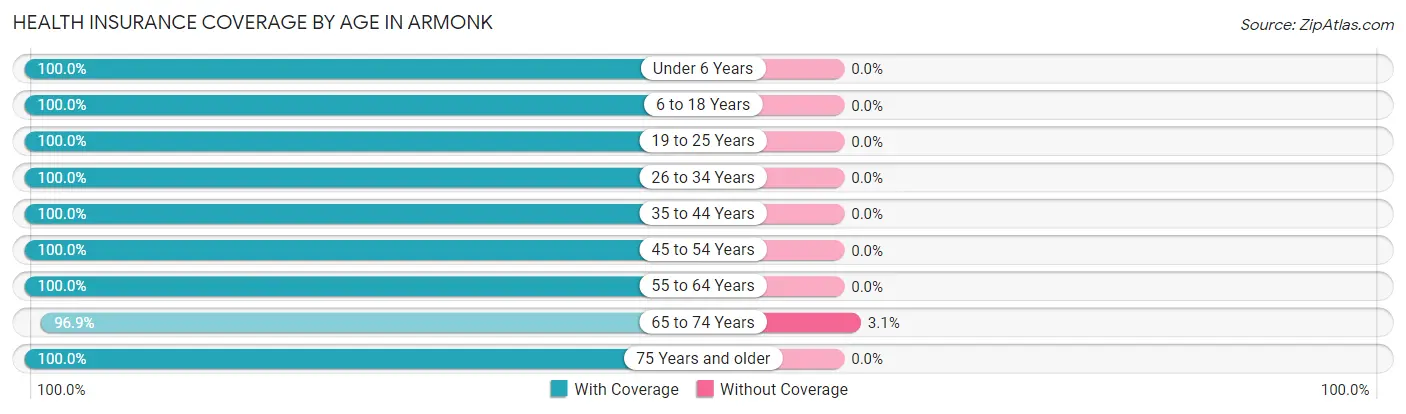
| Age Bracket | With Coverage | Without Coverage |
| Under 6 Years | 432 (100.0%) | 0 (0.0%) |
| 6 to 18 Years | 719 (100.0%) | 0 (0.0%) |
| 19 to 25 Years | 276 (100.0%) | 0 (0.0%) |
| 26 to 34 Years | 384 (100.0%) | 0 (0.0%) |
| 35 to 44 Years | 600 (100.0%) | 0 (0.0%) |
| 45 to 54 Years | 623 (100.0%) | 0 (0.0%) |
| 55 to 64 Years | 785 (100.0%) | 0 (0.0%) |
| 65 to 74 Years | 281 (96.9%) | 9 (3.1%) |
| 75 Years and older | 250 (100.0%) | 0 (0.0%) |
| Total | 4,350 (99.8%) | 9 (0.2%) |
Health Insurance Coverage by Citizenship Status in Armonk
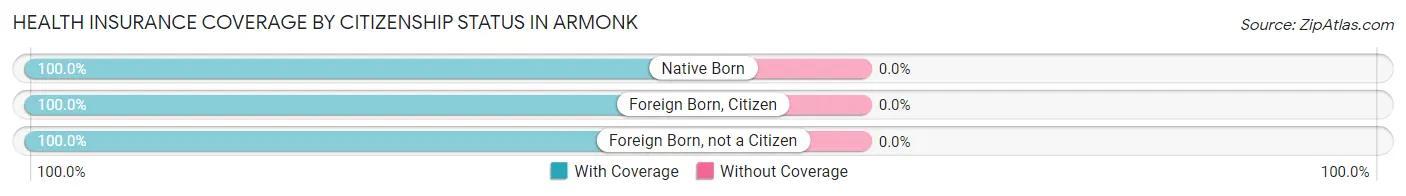
| Citizenship Status | With Coverage | Without Coverage |
| Native Born | 432 (100.0%) | 0 (0.0%) |
| Foreign Born, Citizen | 719 (100.0%) | 0 (0.0%) |
| Foreign Born, not a Citizen | 276 (100.0%) | 0 (0.0%) |
Health Insurance Coverage by Household Income in Armonk
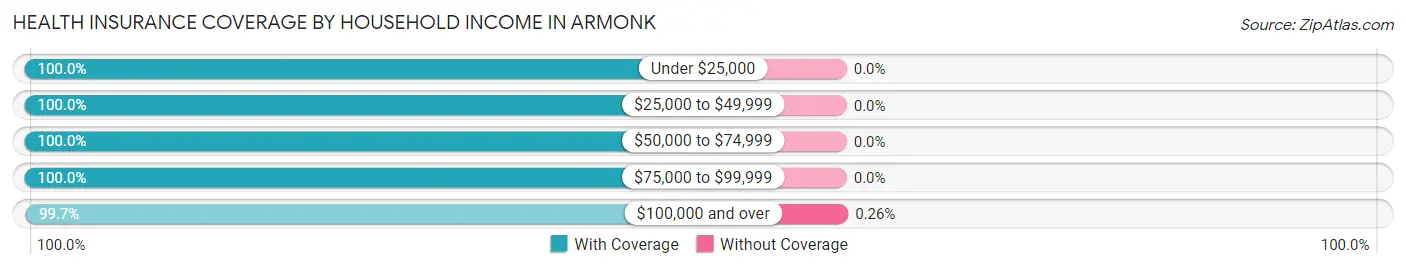
| Household Income | With Coverage | Without Coverage |
| Under $25,000 | 172 (100.0%) | 0 (0.0%) |
| $25,000 to $49,999 | 206 (100.0%) | 0 (0.0%) |
| $50,000 to $74,999 | 96 (100.0%) | 0 (0.0%) |
| $75,000 to $99,999 | 388 (100.0%) | 0 (0.0%) |
| $100,000 and over | 3,485 (99.7%) | 9 (0.3%) |
Public vs Private Health Insurance Coverage by Age in Armonk
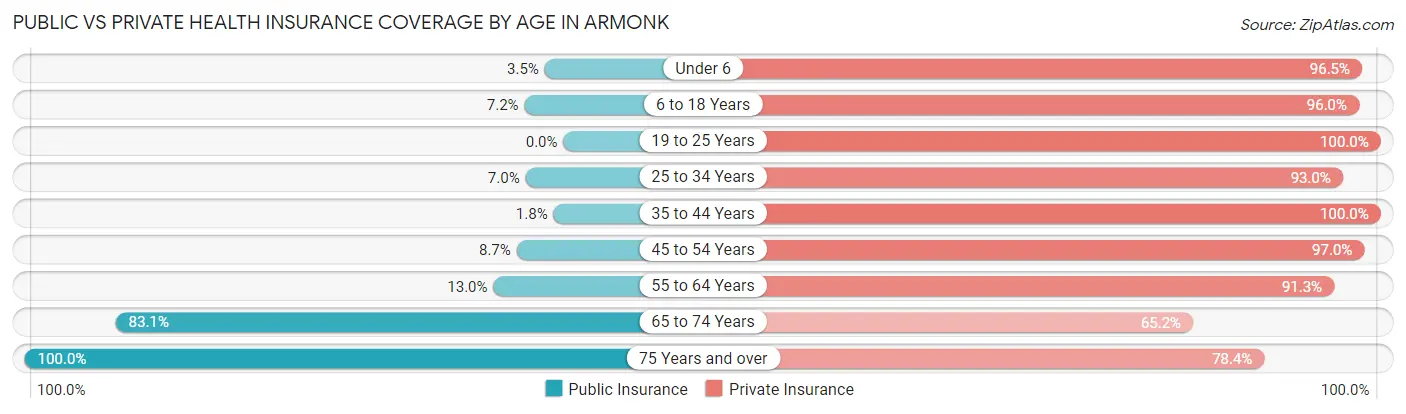
| Age Bracket | Public Insurance | Private Insurance |
| Under 6 | 15 (3.5%) | 417 (96.5%) |
| 6 to 18 Years | 52 (7.2%) | 690 (96.0%) |
| 19 to 25 Years | 0 (0.0%) | 276 (100.0%) |
| 25 to 34 Years | 27 (7.0%) | 357 (93.0%) |
| 35 to 44 Years | 11 (1.8%) | 600 (100.0%) |
| 45 to 54 Years | 54 (8.7%) | 604 (97.0%) |
| 55 to 64 Years | 102 (13.0%) | 717 (91.3%) |
| 65 to 74 Years | 241 (83.1%) | 189 (65.2%) |
| 75 Years and over | 250 (100.0%) | 196 (78.4%) |
| Total | 752 (17.2%) | 4,046 (92.8%) |
Disability Status by Sex by Age in Armonk
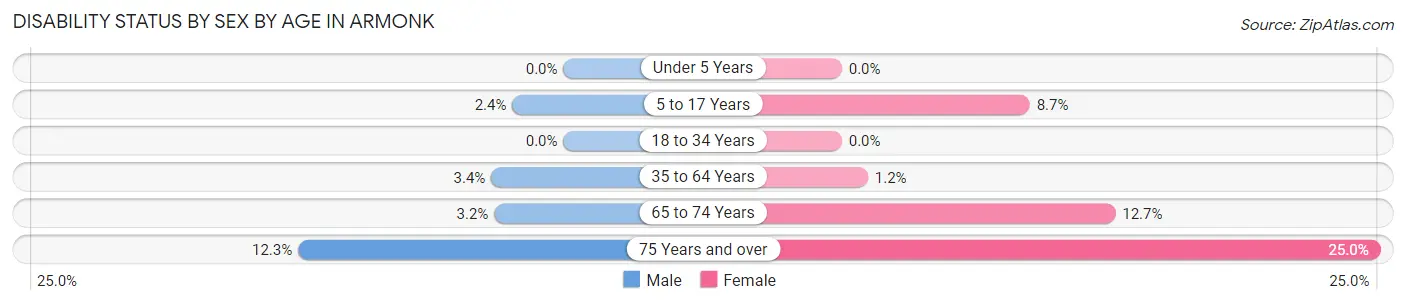
| Age Bracket | Male | Female |
| Under 5 Years | 0 (0.0%) | 0 (0.0%) |
| 5 to 17 Years | 9 (2.4%) | 34 (8.7%) |
| 18 to 34 Years | 0 (0.0%) | 0 (0.0%) |
| 35 to 64 Years | 34 (3.4%) | 12 (1.2%) |
| 65 to 74 Years | 5 (3.2%) | 17 (12.7%) |
| 75 Years and over | 16 (12.3%) | 30 (25.0%) |
Disability Class by Sex by Age in Armonk
Disability Class: Hearing Difficulty
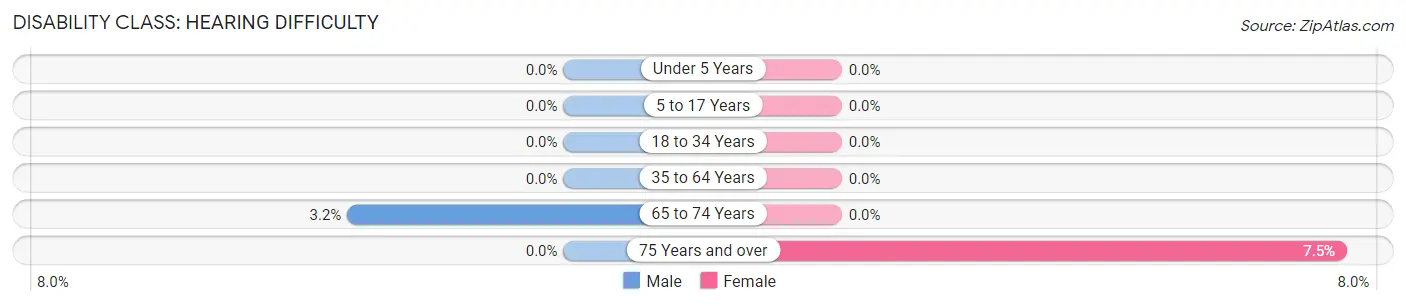
| Age Bracket | Male | Female |
| Under 5 Years | 0 (0.0%) | 0 (0.0%) |
| 5 to 17 Years | 0 (0.0%) | 0 (0.0%) |
| 18 to 34 Years | 0 (0.0%) | 0 (0.0%) |
| 35 to 64 Years | 0 (0.0%) | 0 (0.0%) |
| 65 to 74 Years | 5 (3.2%) | 0 (0.0%) |
| 75 Years and over | 0 (0.0%) | 9 (7.5%) |
Disability Class: Vision Difficulty
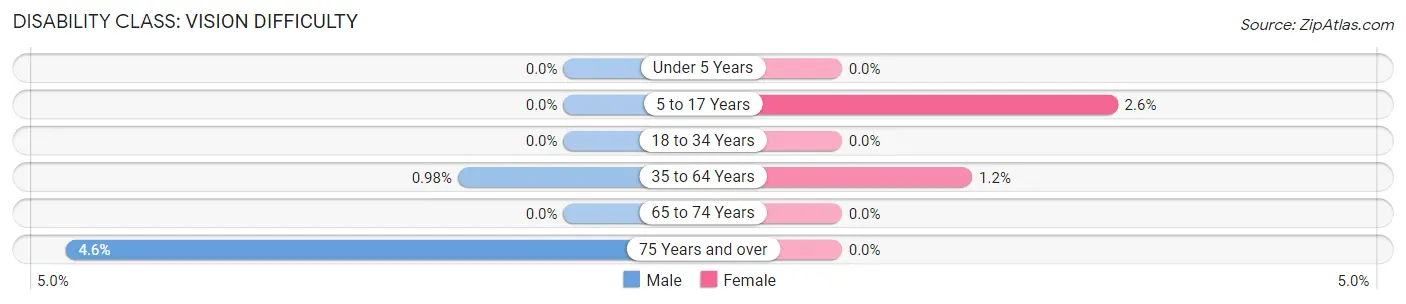
| Age Bracket | Male | Female |
| Under 5 Years | 0 (0.0%) | 0 (0.0%) |
| 5 to 17 Years | 0 (0.0%) | 10 (2.6%) |
| 18 to 34 Years | 0 (0.0%) | 0 (0.0%) |
| 35 to 64 Years | 10 (1.0%) | 12 (1.2%) |
| 65 to 74 Years | 0 (0.0%) | 0 (0.0%) |
| 75 Years and over | 6 (4.6%) | 0 (0.0%) |
Disability Class: Cognitive Difficulty
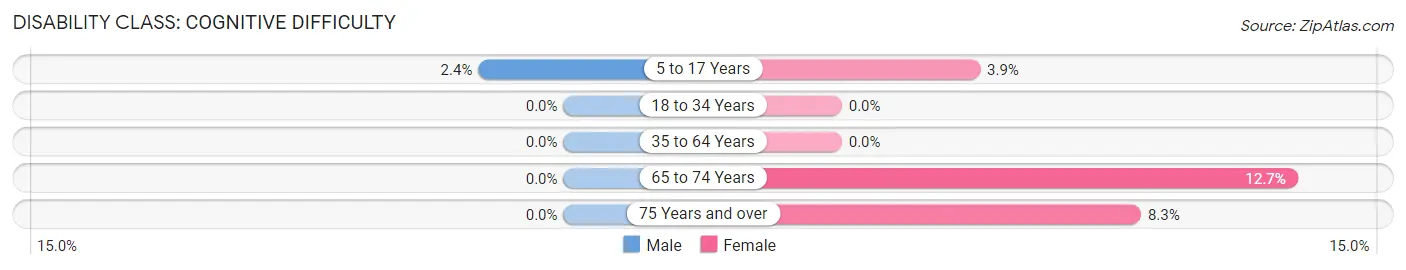
| Age Bracket | Male | Female |
| 5 to 17 Years | 9 (2.4%) | 15 (3.8%) |
| 18 to 34 Years | 0 (0.0%) | 0 (0.0%) |
| 35 to 64 Years | 0 (0.0%) | 0 (0.0%) |
| 65 to 74 Years | 0 (0.0%) | 17 (12.7%) |
| 75 Years and over | 0 (0.0%) | 10 (8.3%) |
Disability Class: Ambulatory Difficulty
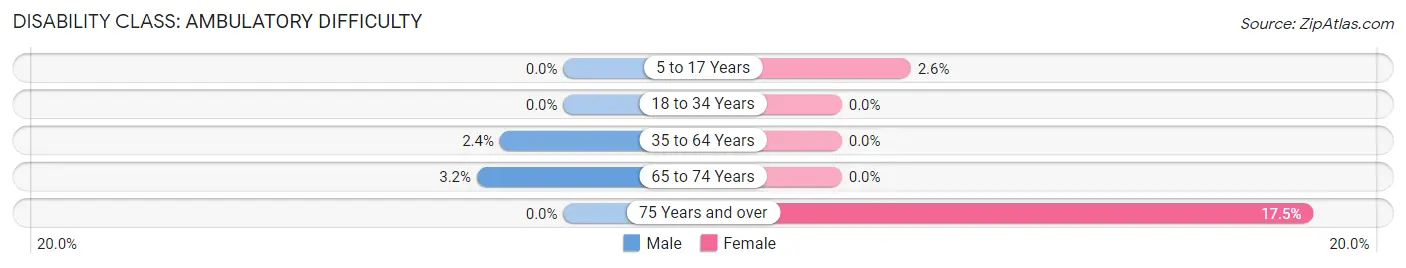
| Age Bracket | Male | Female |
| 5 to 17 Years | 0 (0.0%) | 10 (2.6%) |
| 18 to 34 Years | 0 (0.0%) | 0 (0.0%) |
| 35 to 64 Years | 24 (2.4%) | 0 (0.0%) |
| 65 to 74 Years | 5 (3.2%) | 0 (0.0%) |
| 75 Years and over | 0 (0.0%) | 21 (17.5%) |
Disability Class: Self-Care Difficulty
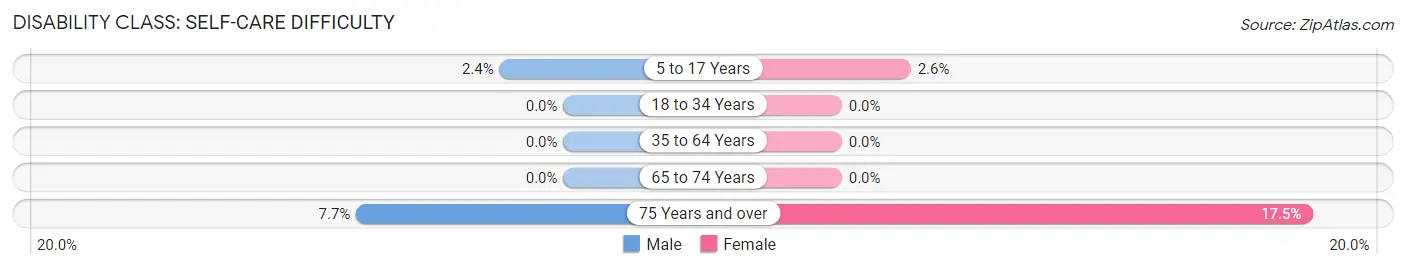
| Age Bracket | Male | Female |
| 5 to 17 Years | 9 (2.4%) | 10 (2.6%) |
| 18 to 34 Years | 0 (0.0%) | 0 (0.0%) |
| 35 to 64 Years | 0 (0.0%) | 0 (0.0%) |
| 65 to 74 Years | 0 (0.0%) | 0 (0.0%) |
| 75 Years and over | 10 (7.7%) | 21 (17.5%) |
Technology Access in Armonk
Computing Device Access in Armonk
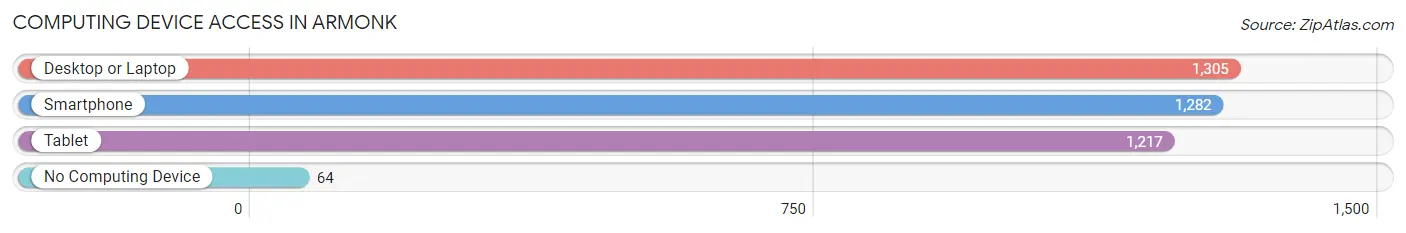
| Device Type | # Households | % Households |
| Desktop or Laptop | 1,305 | 88.7% |
| Smartphone | 1,282 | 87.2% |
| Tablet | 1,217 | 82.7% |
| No Computing Device | 64 | 4.3% |
| Total | 1,471 | 100.0% |
Internet Access in Armonk
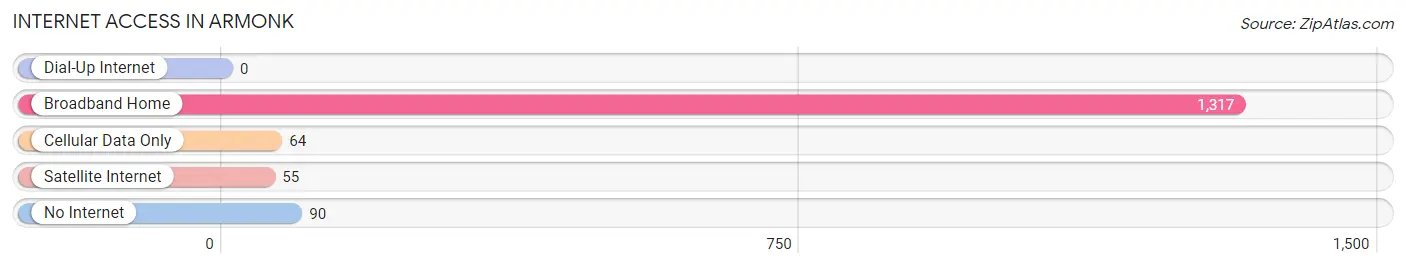
| Internet Type | # Households | % Households |
| Dial-Up Internet | 0 | 0.0% |
| Broadband Home | 1,317 | 89.5% |
| Cellular Data Only | 64 | 4.3% |
| Satellite Internet | 55 | 3.7% |
| No Internet | 90 | 6.1% |
| Total | 1,471 | 100.0% |
Armonk Summary
Armonk is a hamlet located in the town of North Castle in Westchester County, New York. It is situated in the northern part of the county, about 25 miles north of New York City. The hamlet is bordered by the towns of Bedford, Mount Kisco, and Greenwich, Connecticut.
History
Armonk was originally inhabited by the Siwanoy Native American tribe. The first European settlers arrived in the area in the late 17th century. The hamlet was originally known as "North Castle," and was part of the town of North Castle. In 1846, the hamlet was renamed "Armonk" after the Native American word for "place of hickory nuts."
In the late 19th century, Armonk became a popular summer resort destination for wealthy New Yorkers. The hamlet was home to several large estates, including the estate of John Jacob Astor IV, which is now the site of the IBM headquarters.
Geography
Armonk is located in the northern part of Westchester County, about 25 miles north of New York City. The hamlet is bordered by the towns of Bedford, Mount Kisco, and Greenwich, Connecticut. The hamlet is situated on the Byram River, which flows through the town of North Castle.
The hamlet has a total area of 4.2 square miles, of which 4.1 square miles is land and 0.1 square miles is water. The terrain is mostly hilly, with elevations ranging from 200 to 500 feet above sea level.
Economy
Armonk is home to the headquarters of IBM, which is one of the largest employers in the area. Other major employers in the hamlet include PepsiCo, KPMG, and MasterCard.
The hamlet is also home to several small businesses, including restaurants, retail stores, and professional services.
Demographics
As of the 2010 census, Armonk had a population of 4,330. The racial makeup of the hamlet was 87.3% White, 4.2% African American, 0.2% Native American, 5.7% Asian, and 2.6% from other races.
The median household income in Armonk was $150,000, and the median family income was $170,000. The per capita income was $80,000. About 4.2% of the population was below the poverty line.
The majority of the population (90.2%) was over the age of 18, and the median age was 43. The population was evenly split between males and females.
Common Questions
What is Per Capita Income in Armonk?
Per Capita income in Armonk is $113,310.
What is the Median Family Income in Armonk?
Median Family Income in Armonk is $240,208.
What is the Median Household income in Armonk?
Median Household Income in Armonk is $234,688.
What is Income or Wage Gap in Armonk?
Income or Wage Gap in Armonk is 46.7%.
Women in Armonk earn 53.3 cents for every dollar earned by a man.
What is Inequality or Gini Index in Armonk?
Inequality or Gini Index in Armonk is 0.50.
What is the Total Population of Armonk?
Total Population of Armonk is 4,378.
What is the Total Male Population of Armonk?
Total Male Population of Armonk is 2,262.
What is the Total Female Population of Armonk?
Total Female Population of Armonk is 2,116.
What is the Ratio of Males per 100 Females in Armonk?
There are 106.90 Males per 100 Females in Armonk.
What is the Ratio of Females per 100 Males in Armonk?
There are 93.55 Females per 100 Males in Armonk.
What is the Median Population Age in Armonk?
Median Population Age in Armonk is 42.6 Years.
What is the Average Family Size in Armonk
Average Family Size in Armonk is 3.2 People.
What is the Average Household Size in Armonk
Average Household Size in Armonk is 3.0 People.
How Large is the Labor Force in Armonk?
There are 2,124 People in the Labor Forcein in Armonk.
What is the Percentage of People in the Labor Force in Armonk?
62.0% of People are in the Labor Force in Armonk.
What is the Unemployment Rate in Armonk?
Unemployment Rate in Armonk is 1.3%.