Port Jefferson Station, NY Map & Demographics
Port Jefferson Station Map
Port Jefferson Station Overview
$49,815
PER CAPITA INCOME
$128,977
AVG FAMILY INCOME
$118,713
AVG HOUSEHOLD INCOME
21.5%
WAGE / INCOME GAP [ % ]
78.5¢/ $1
WAGE / INCOME GAP [ $ ]
0.40
INEQUALITY / GINI INDEX
7,974
TOTAL POPULATION
3,898
MALE POPULATION
4,076
FEMALE POPULATION
95.63
MALES / 100 FEMALES
104.57
FEMALES / 100 MALES
39.5
MEDIAN AGE
3.4
AVG FAMILY SIZE
3.0
AVG HOUSEHOLD SIZE
4,145
LABOR FORCE [ PEOPLE ]
65.5%
PERCENT IN LABOR FORCE
7.1%
UNEMPLOYMENT RATE
Port Jefferson Station Zip Codes
Income in Port Jefferson Station
Income Overview in Port Jefferson Station
Per Capita Income in Port Jefferson Station is $49,815, while median incomes of families and households are $128,977 and $118,713 respectively.
| Characteristic | Number | Measure |
| Per Capita Income | 7,974 | $49,815 |
| Median Family Income | 2,005 | $128,977 |
| Mean Family Income | 2,005 | $157,813 |
| Median Household Income | 2,669 | $118,713 |
| Mean Household Income | 2,669 | $143,124 |
| Income Deficit | 2,005 | $0 |
| Wage / Income Gap (%) | 7,974 | 21.51% |
| Wage / Income Gap ($) | 7,974 | 78.49¢ per $1 |
| Gini / Inequality Index | 7,974 | 0.40 |
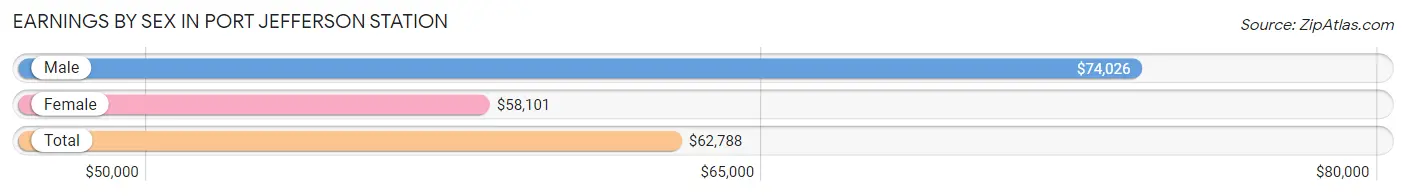
Earnings by Sex in Port Jefferson Station
Average Earnings in Port Jefferson Station are $62,788, $74,026 for men and $58,101 for women, a difference of 21.5%.
| Sex | Number | Average Earnings |
| Male | 2,090 (51.2%) | $74,026 |
| Female | 1,991 (48.8%) | $58,101 |
| Total | 4,081 (100.0%) | $62,788 |
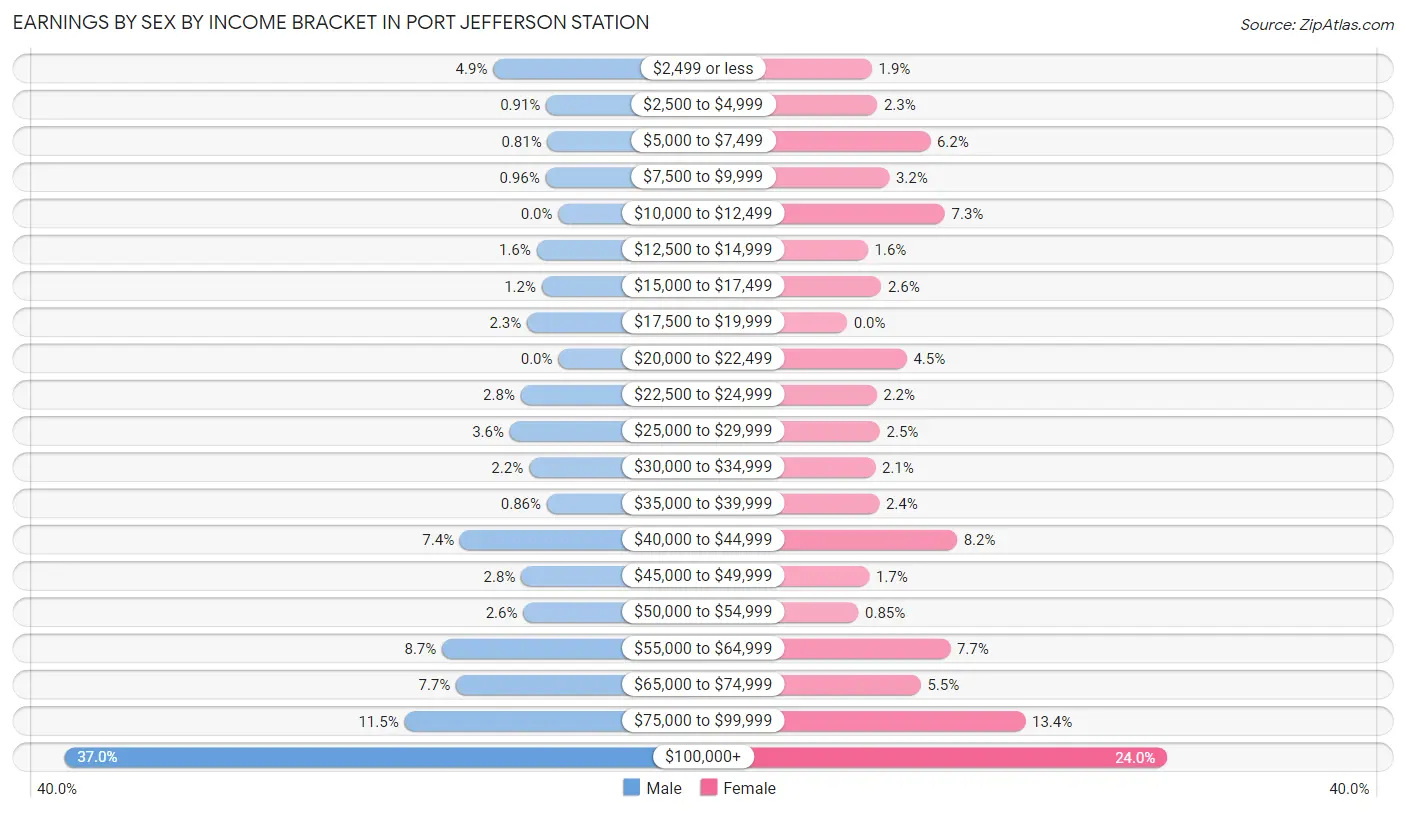
Earnings by Sex by Income Bracket in Port Jefferson Station
The most common earnings brackets in Port Jefferson Station are $100,000+ for men (774 | 37.0%) and $100,000+ for women (478 | 24.0%).
| Income | Male | Female |
| $2,499 or less | 102 (4.9%) | 37 (1.9%) |
| $2,500 to $4,999 | 19 (0.9%) | 45 (2.3%) |
| $5,000 to $7,499 | 17 (0.8%) | 124 (6.2%) |
| $7,500 to $9,999 | 20 (1.0%) | 63 (3.2%) |
| $10,000 to $12,499 | 0 (0.0%) | 146 (7.3%) |
| $12,500 to $14,999 | 34 (1.6%) | 31 (1.6%) |
| $15,000 to $17,499 | 26 (1.2%) | 51 (2.6%) |
| $17,500 to $19,999 | 49 (2.3%) | 0 (0.0%) |
| $20,000 to $22,499 | 0 (0.0%) | 89 (4.5%) |
| $22,500 to $24,999 | 59 (2.8%) | 44 (2.2%) |
| $25,000 to $29,999 | 76 (3.6%) | 49 (2.5%) |
| $30,000 to $34,999 | 46 (2.2%) | 42 (2.1%) |
| $35,000 to $39,999 | 18 (0.9%) | 48 (2.4%) |
| $40,000 to $44,999 | 154 (7.4%) | 164 (8.2%) |
| $45,000 to $49,999 | 58 (2.8%) | 33 (1.7%) |
| $50,000 to $54,999 | 55 (2.6%) | 17 (0.9%) |
| $55,000 to $64,999 | 182 (8.7%) | 154 (7.7%) |
| $65,000 to $74,999 | 160 (7.7%) | 110 (5.5%) |
| $75,000 to $99,999 | 241 (11.5%) | 266 (13.4%) |
| $100,000+ | 774 (37.0%) | 478 (24.0%) |
| Total | 2,090 (100.0%) | 1,991 (100.0%) |
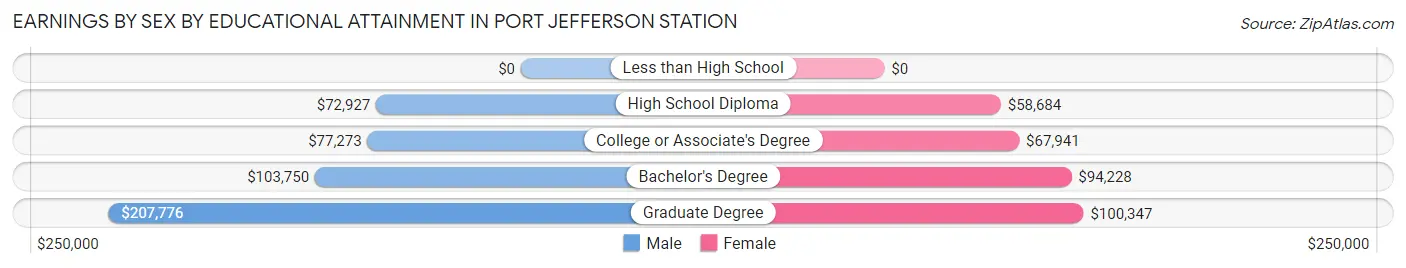
Earnings by Sex by Educational Attainment in Port Jefferson Station
Average earnings in Port Jefferson Station are $85,341 for men and $69,247 for women, a difference of 18.9%. Men with an educational attainment of graduate degree enjoy the highest average annual earnings of $207,776, while those with high school diploma education earn the least with $72,927. Women with an educational attainment of graduate degree earn the most with the average annual earnings of $100,347, while those with high school diploma education have the smallest earnings of $58,684.
| Educational Attainment | Male Income | Female Income |
| Less than High School | - | - |
| High School Diploma | $72,927 | $58,684 |
| College or Associate's Degree | $77,273 | $67,941 |
| Bachelor's Degree | $103,750 | $94,228 |
| Graduate Degree | $207,776 | $100,347 |
| Total | $85,341 | $69,247 |
Family Income in Port Jefferson Station
Family Income Brackets in Port Jefferson Station
According to the Port Jefferson Station family income data, there are 559 families falling into the $200,000+ income range, which is the most common income bracket and makes up 27.9% of all families.
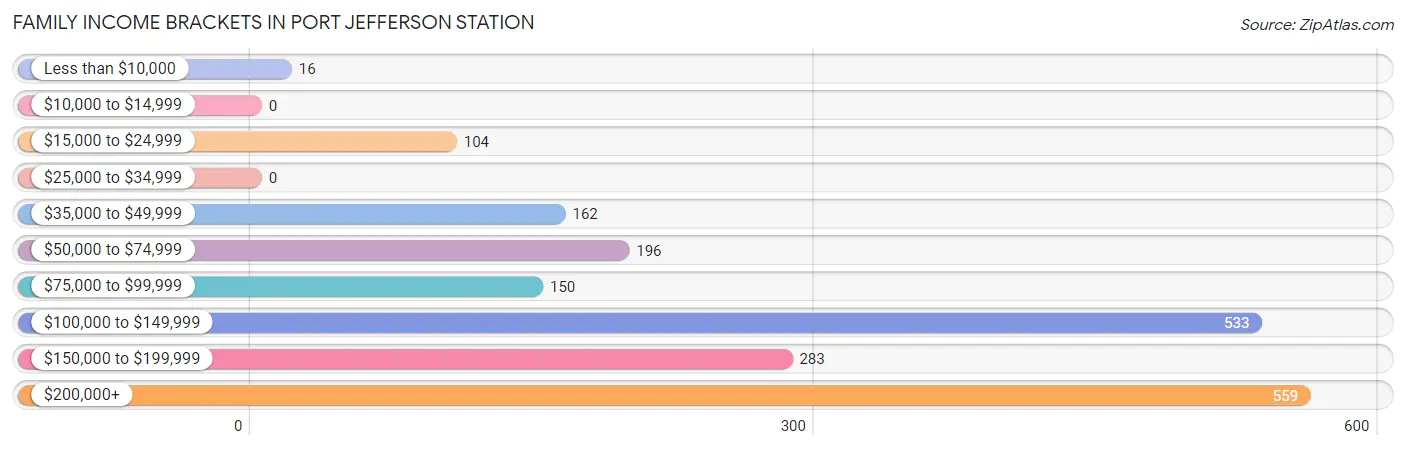
| Income Bracket | # Families | % Families |
| Less than $10,000 | 16 | 0.8% |
| $10,000 to $14,999 | 0 | 0.0% |
| $15,000 to $24,999 | 104 | 5.2% |
| $25,000 to $34,999 | 0 | 0.0% |
| $35,000 to $49,999 | 162 | 8.1% |
| $50,000 to $74,999 | 196 | 9.8% |
| $75,000 to $99,999 | 150 | 7.5% |
| $100,000 to $149,999 | 533 | 26.6% |
| $150,000 to $199,999 | 283 | 14.1% |
| $200,000+ | 559 | 27.9% |
Family Income by Famaliy Size in Port Jefferson Station
3-person families (389 | 19.4%) account for the highest median family income in Port Jefferson Station with $188,775 per family, while 3-person families (389 | 19.4%) have the highest median income of $62,925 per family member.
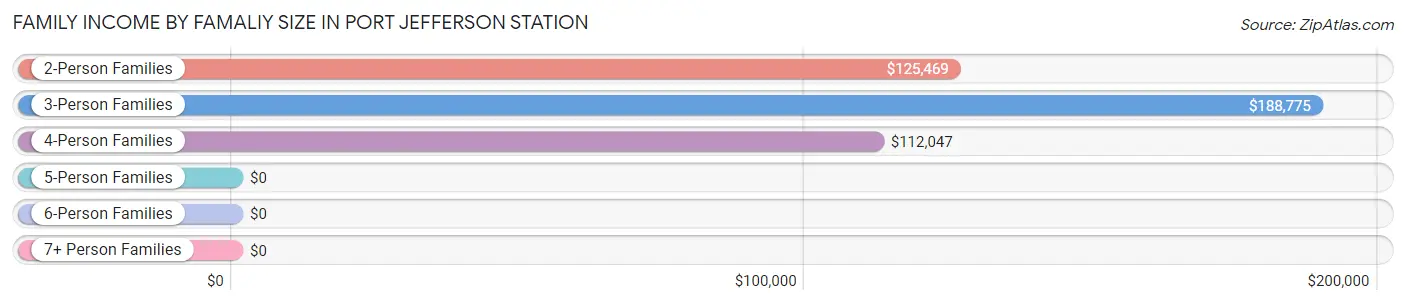
| Income Bracket | # Families | Median Income |
| 2-Person Families | 684 (34.1%) | $125,469 |
| 3-Person Families | 389 (19.4%) | $188,775 |
| 4-Person Families | 717 (35.8%) | $112,047 |
| 5-Person Families | 198 (9.9%) | $0 |
| 6-Person Families | 3 (0.2%) | $0 |
| 7+ Person Families | 14 (0.7%) | $0 |
| Total | 2,005 (100.0%) | $128,977 |
Family Income by Number of Earners in Port Jefferson Station
The median family income in Port Jefferson Station is $128,977, with families comprising 2 earners (948) having the highest median family income of $187,800, while families with no earners (277) have the lowest median family income of $43,713, accounting for 47.3% and 13.8% of families, respectively.
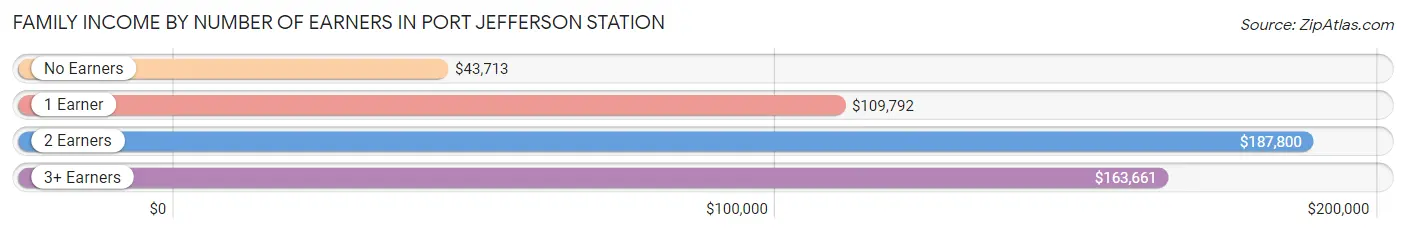
| Number of Earners | # Families | Median Income |
| No Earners | 277 (13.8%) | $43,713 |
| 1 Earner | 479 (23.9%) | $109,792 |
| 2 Earners | 948 (47.3%) | $187,800 |
| 3+ Earners | 301 (15.0%) | $163,661 |
| Total | 2,005 (100.0%) | $128,977 |
Household Income in Port Jefferson Station
Household Income Brackets in Port Jefferson Station
With 606 households falling in the category, the $200,000+ income range is the most frequent in Port Jefferson Station, accounting for 22.7% of all households. In contrast, only 27 households (1.0%) fall into the $10,000 to $14,999 income bracket, making it the least populous group.
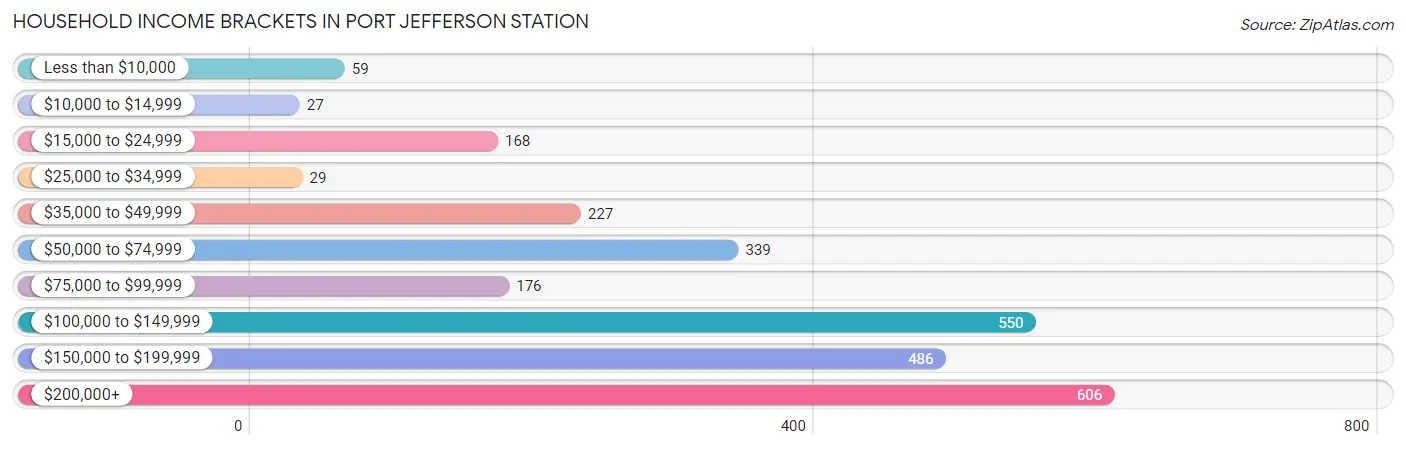
| Income Bracket | # Households | % Households |
| Less than $10,000 | 59 | 2.2% |
| $10,000 to $14,999 | 27 | 1.0% |
| $15,000 to $24,999 | 168 | 6.3% |
| $25,000 to $34,999 | 29 | 1.1% |
| $35,000 to $49,999 | 227 | 8.5% |
| $50,000 to $74,999 | 339 | 12.7% |
| $75,000 to $99,999 | 176 | 6.6% |
| $100,000 to $149,999 | 550 | 20.6% |
| $150,000 to $199,999 | 486 | 18.2% |
| $200,000+ | 606 | 22.7% |
Household Income by Householder Age in Port Jefferson Station
The median household income in Port Jefferson Station is $118,713, with the highest median household income of $162,375 found in the 45 to 64 years age bracket for the primary householder. A total of 1,089 households (40.8%) fall into this category. Meanwhile, the 65+ years age bracket for the primary householder has the lowest median household income of $65,598, with 543 households (20.3%) in this group.
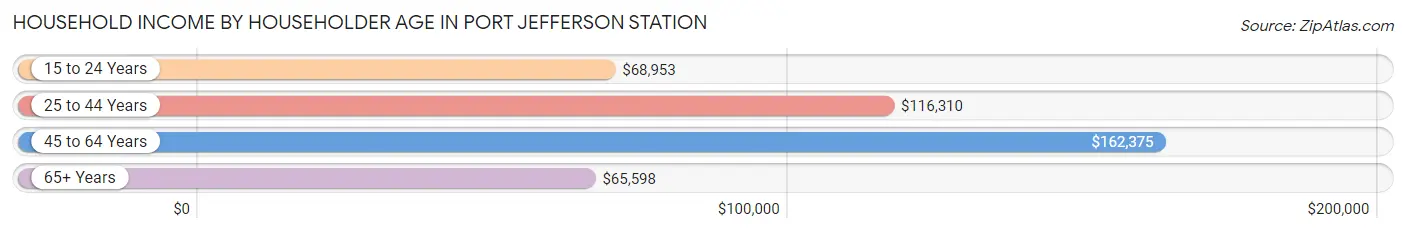
| Income Bracket | # Households | Median Income |
| 15 to 24 Years | 75 (2.8%) | $68,953 |
| 25 to 44 Years | 962 (36.0%) | $116,310 |
| 45 to 64 Years | 1,089 (40.8%) | $162,375 |
| 65+ Years | 543 (20.3%) | $65,598 |
| Total | 2,669 (100.0%) | $118,713 |
Poverty in Port Jefferson Station
Income Below Poverty by Sex and Age in Port Jefferson Station
With 8.9% poverty level for males and 7.6% for females among the residents of Port Jefferson Station, 12 to 14 year old males and 15 year old females are the most vulnerable to poverty, with 27 males (84.4%) and 30 females (54.5%) in their respective age groups living below the poverty level.
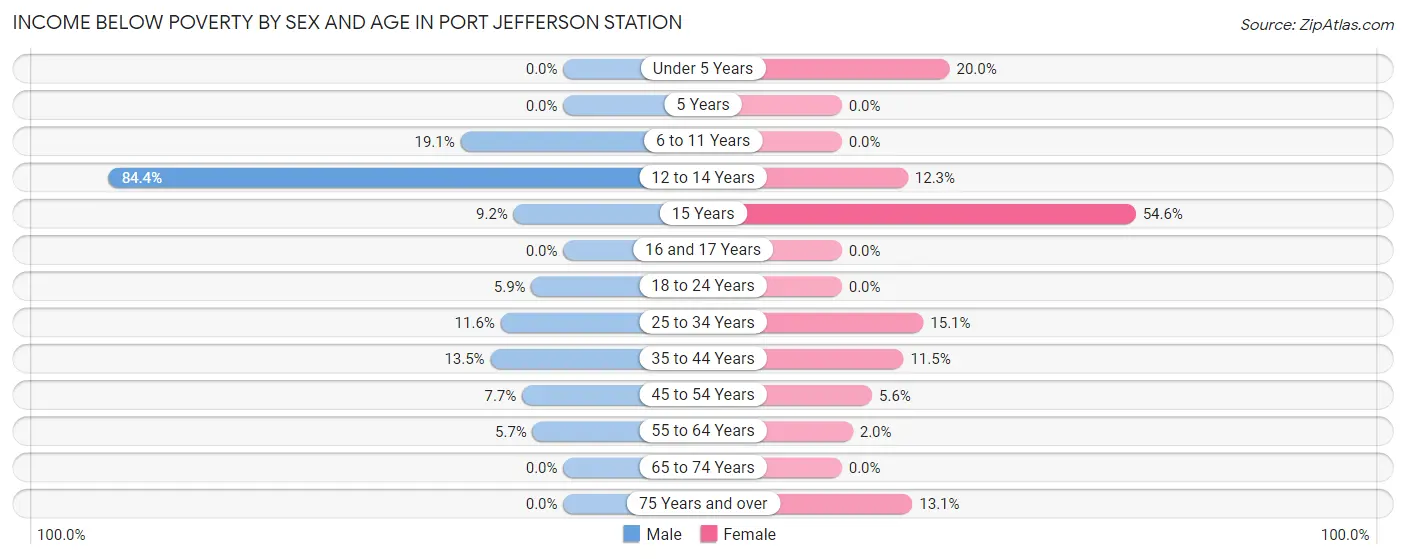
| Age Bracket | Male | Female |
| Under 5 Years | 0 (0.0%) | 56 (20.0%) |
| 5 Years | 0 (0.0%) | 0 (0.0%) |
| 6 to 11 Years | 97 (19.1%) | 0 (0.0%) |
| 12 to 14 Years | 27 (84.4%) | 13 (12.3%) |
| 15 Years | 13 (9.2%) | 30 (54.5%) |
| 16 and 17 Years | 0 (0.0%) | 0 (0.0%) |
| 18 to 24 Years | 16 (5.9%) | 0 (0.0%) |
| 25 to 34 Years | 44 (11.6%) | 89 (15.1%) |
| 35 to 44 Years | 72 (13.5%) | 53 (11.5%) |
| 45 to 54 Years | 38 (7.6%) | 24 (5.6%) |
| 55 to 64 Years | 41 (5.7%) | 13 (2.0%) |
| 65 to 74 Years | 0 (0.0%) | 0 (0.0%) |
| 75 Years and over | 0 (0.0%) | 33 (13.1%) |
| Total | 348 (8.9%) | 311 (7.6%) |
Income Above Poverty by Sex and Age in Port Jefferson Station
According to the poverty statistics in Port Jefferson Station, males aged under 5 years and females aged 5 years are the age groups that are most secure financially, with 100.0% of males and 100.0% of females in these age groups living above the poverty line.
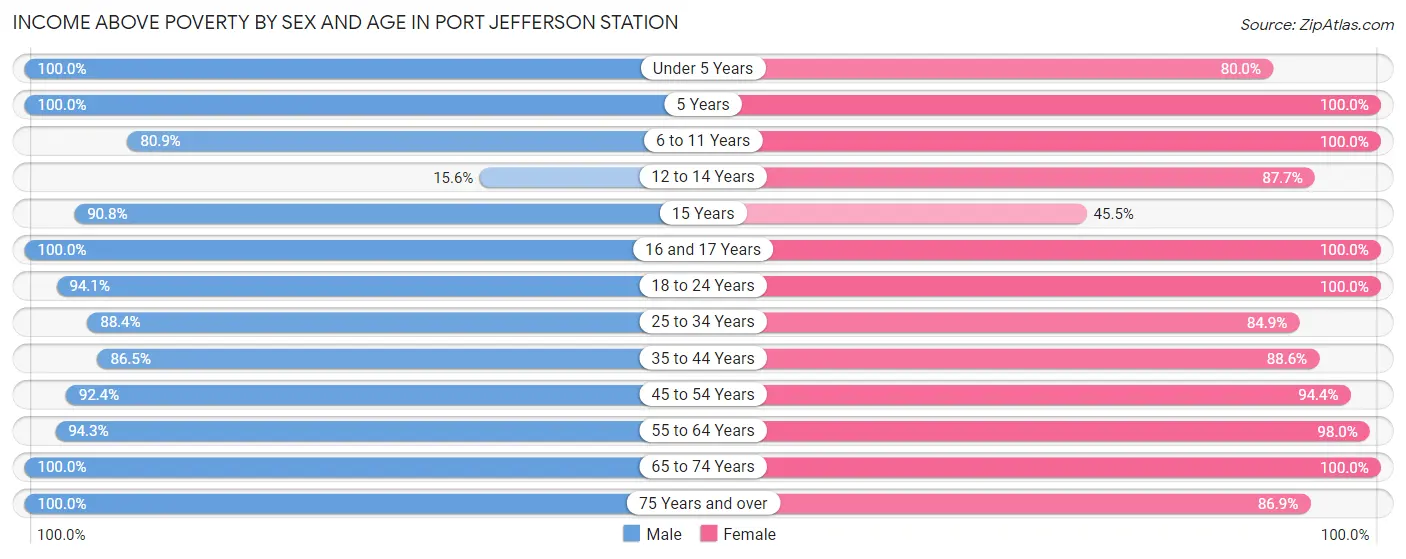
| Age Bracket | Male | Female |
| Under 5 Years | 280 (100.0%) | 224 (80.0%) |
| 5 Years | 7 (100.0%) | 18 (100.0%) |
| 6 to 11 Years | 411 (80.9%) | 219 (100.0%) |
| 12 to 14 Years | 5 (15.6%) | 93 (87.7%) |
| 15 Years | 128 (90.8%) | 25 (45.5%) |
| 16 and 17 Years | 33 (100.0%) | 109 (100.0%) |
| 18 to 24 Years | 254 (94.1%) | 600 (100.0%) |
| 25 to 34 Years | 334 (88.4%) | 499 (84.9%) |
| 35 to 44 Years | 460 (86.5%) | 410 (88.5%) |
| 45 to 54 Years | 459 (92.3%) | 403 (94.4%) |
| 55 to 64 Years | 679 (94.3%) | 625 (98.0%) |
| 65 to 74 Years | 194 (100.0%) | 321 (100.0%) |
| 75 Years and over | 300 (100.0%) | 219 (86.9%) |
| Total | 3,544 (91.1%) | 3,765 (92.4%) |
Income Below Poverty Among Married-Couple Families in Port Jefferson Station
The poverty statistics for married-couple families in Port Jefferson Station show that 4.1% or 70 of the total 1,729 families live below the poverty line. Families with 3 or 4 children have the highest poverty rate of 64.7%, comprising of 44 families. On the other hand, families with no children have the lowest poverty rate of 0.0%, which includes 0 families.
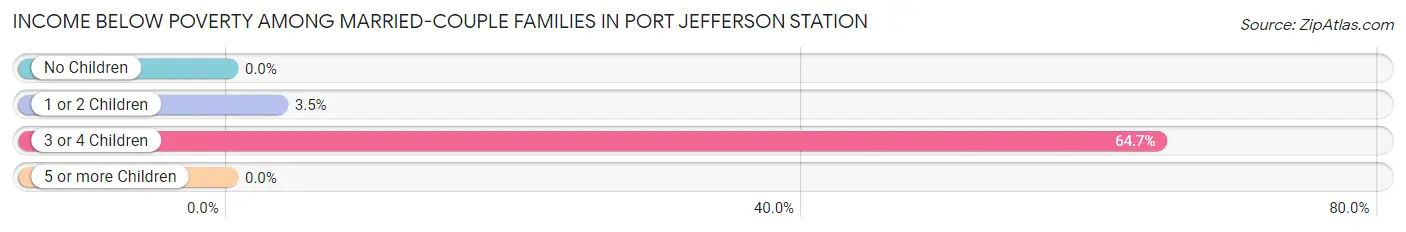
| Children | Above Poverty | Below Poverty |
| No Children | 912 (100.0%) | 0 (0.0%) |
| 1 or 2 Children | 723 (96.5%) | 26 (3.5%) |
| 3 or 4 Children | 24 (35.3%) | 44 (64.7%) |
| 5 or more Children | 0 (0.0%) | 0 (0.0%) |
| Total | 1,659 (96.0%) | 70 (4.1%) |
Income Below Poverty Among Single-Parent Households in Port Jefferson Station
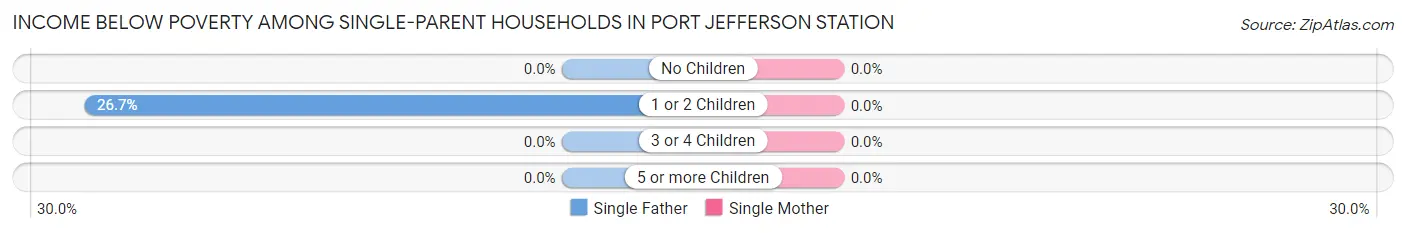
| Children | Single Father | Single Mother |
| No Children | 0 (0.0%) | 0 (0.0%) |
| 1 or 2 Children | 16 (26.7%) | 0 (0.0%) |
| 3 or 4 Children | 0 (0.0%) | 0 (0.0%) |
| 5 or more Children | 0 (0.0%) | 0 (0.0%) |
| Total | 16 (21.9%) | 0 (0.0%) |
Income Below Poverty Among Married-Couple vs Single-Parent Households in Port Jefferson Station
The poverty data for Port Jefferson Station shows that 70 of the married-couple family households (4.1%) and 16 of the single-parent households (5.8%) are living below the poverty level. Within the married-couple family households, those with 3 or 4 children have the highest poverty rate, with 44 households (64.7%) falling below the poverty line. Among the single-parent households, those with 1 or 2 children have the highest poverty rate, with 16 household (7.6%) living below poverty.
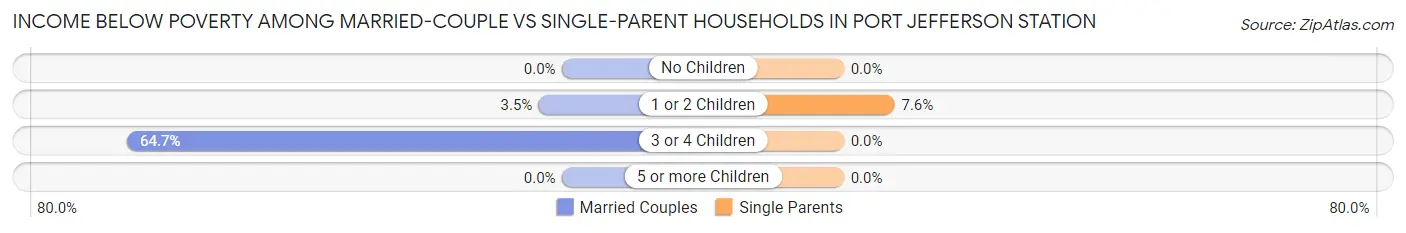
| Children | Married-Couple Families | Single-Parent Households |
| No Children | 0 (0.0%) | 0 (0.0%) |
| 1 or 2 Children | 26 (3.5%) | 16 (7.6%) |
| 3 or 4 Children | 44 (64.7%) | 0 (0.0%) |
| 5 or more Children | 0 (0.0%) | 0 (0.0%) |
| Total | 70 (4.1%) | 16 (5.8%) |
Race in Port Jefferson Station
The most populous races in Port Jefferson Station are White / Caucasian (5,823 | 73.0%), Hispanic or Latino (2,076 | 26.0%), and Two or more Races (1,348 | 16.9%).
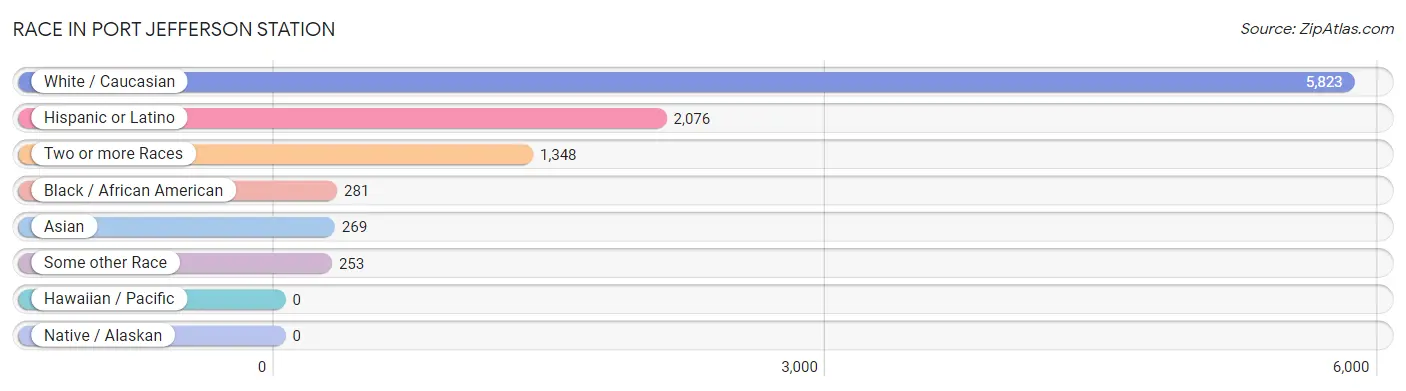
| Race | # Population | % Population |
| Asian | 269 | 3.4% |
| Black / African American | 281 | 3.5% |
| Hawaiian / Pacific | 0 | 0.0% |
| Hispanic or Latino | 2,076 | 26.0% |
| Native / Alaskan | 0 | 0.0% |
| White / Caucasian | 5,823 | 73.0% |
| Two or more Races | 1,348 | 16.9% |
| Some other Race | 253 | 3.2% |
| Total | 7,974 | 100.0% |
Ancestry in Port Jefferson Station
The most populous ancestries reported in Port Jefferson Station are Italian (2,190 | 27.5%), Irish (1,675 | 21.0%), German (851 | 10.7%), Central American (614 | 7.7%), and Salvadoran (541 | 6.8%), together accounting for 73.6% of all Port Jefferson Station residents.
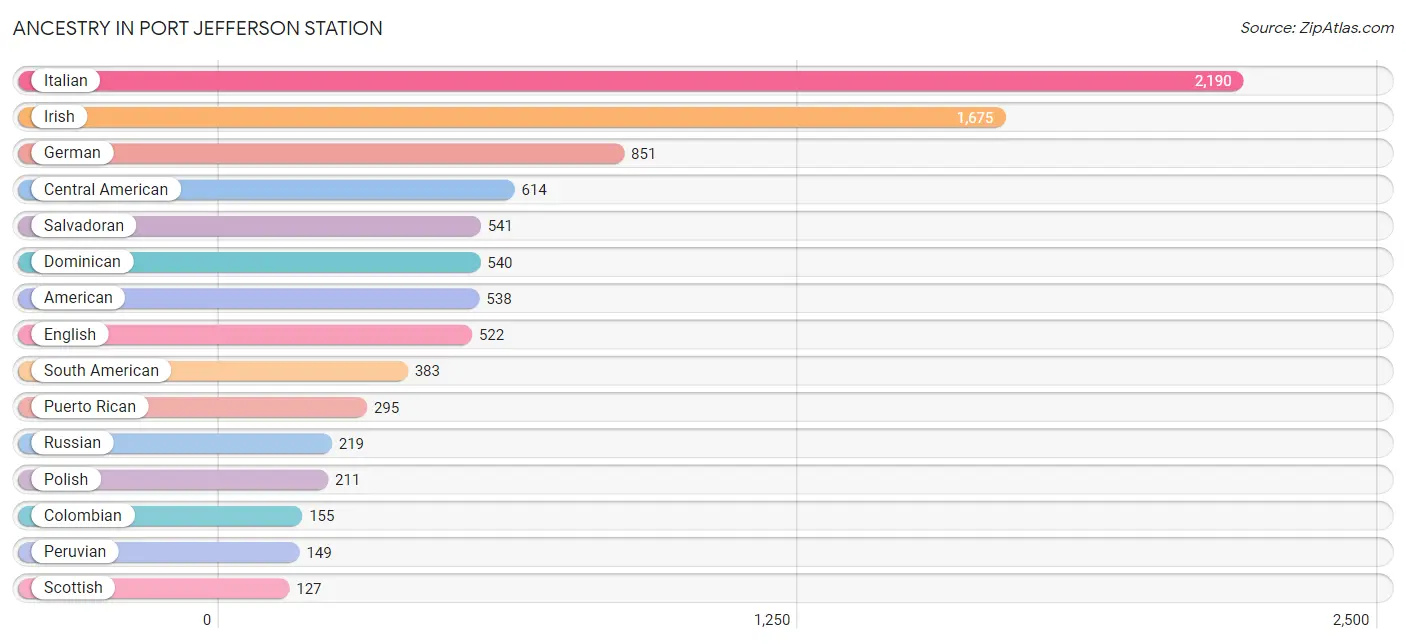
| Ancestry | # Population | % Population |
| Albanian | 59 | 0.7% |
| American | 538 | 6.8% |
| Arab | 56 | 0.7% |
| Austrian | 87 | 1.1% |
| Bhutanese | 73 | 0.9% |
| British | 24 | 0.3% |
| Burmese | 20 | 0.3% |
| Canadian | 25 | 0.3% |
| Central American | 614 | 7.7% |
| Cherokee | 7 | 0.1% |
| Chilean | 7 | 0.1% |
| Colombian | 155 | 1.9% |
| Cuban | 17 | 0.2% |
| Dominican | 540 | 6.8% |
| Dutch | 54 | 0.7% |
| Eastern European | 28 | 0.4% |
| Ecuadorian | 57 | 0.7% |
| Egyptian | 56 | 0.7% |
| English | 522 | 6.6% |
| European | 11 | 0.1% |
| French | 85 | 1.1% |
| French Canadian | 4 | 0.1% |
| German | 851 | 10.7% |
| Greek | 61 | 0.8% |
| Honduran | 73 | 0.9% |
| Hungarian | 46 | 0.6% |
| Indian (Asian) | 113 | 1.4% |
| Iranian | 94 | 1.2% |
| Irish | 1,675 | 21.0% |
| Italian | 2,190 | 27.5% |
| Lithuanian | 65 | 0.8% |
| Mexican | 11 | 0.1% |
| Peruvian | 149 | 1.9% |
| Polish | 211 | 2.6% |
| Portuguese | 96 | 1.2% |
| Puerto Rican | 295 | 3.7% |
| Russian | 219 | 2.8% |
| Salvadoran | 541 | 6.8% |
| Scotch-Irish | 18 | 0.2% |
| Scottish | 127 | 1.6% |
| Slovak | 25 | 0.3% |
| South American | 383 | 4.8% |
| Spaniard | 81 | 1.0% |
| Spanish | 62 | 0.8% |
| Swedish | 12 | 0.2% |
| Swiss | 31 | 0.4% |
| Thai | 63 | 0.8% |
| Trinidadian and Tobagonian | 2 | 0.0% |
| Turkish | 12 | 0.2% |
| Ukrainian | 13 | 0.2% |
| Venezuelan | 15 | 0.2% |
| Welsh | 38 | 0.5% | View All 52 Rows |
Immigrants in Port Jefferson Station
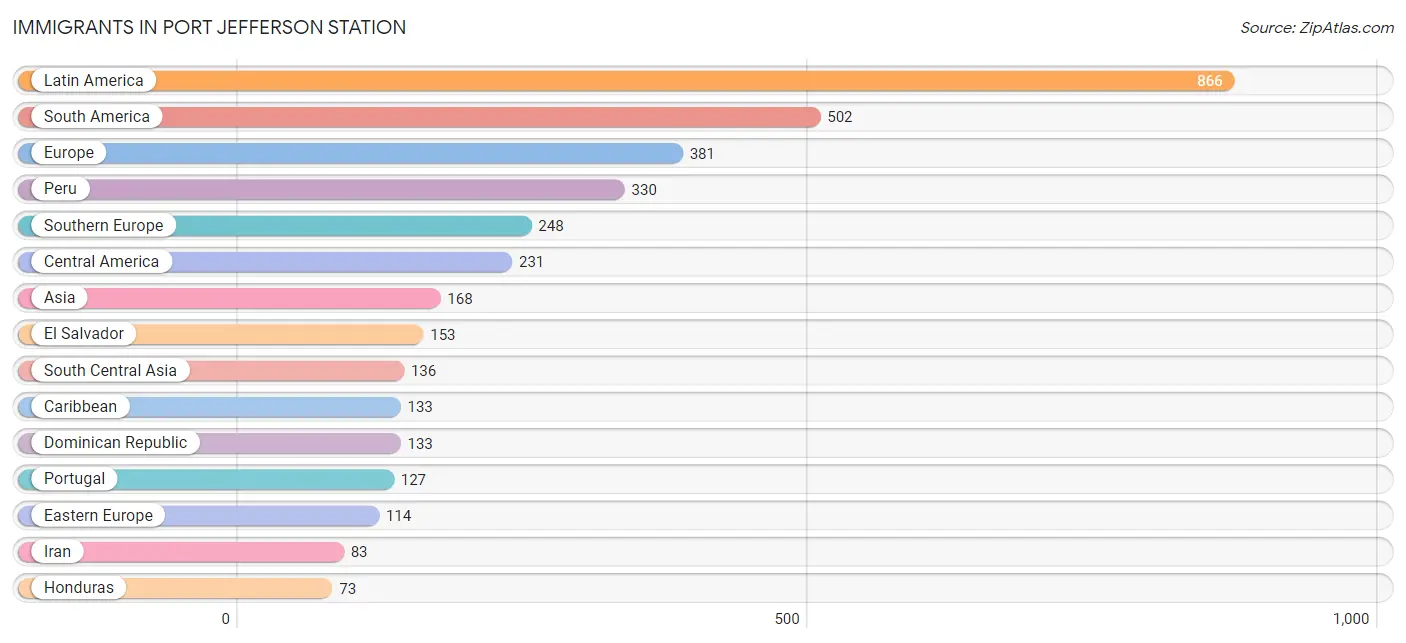
The most numerous immigrant groups reported in Port Jefferson Station came from Latin America (866 | 10.9%), South America (502 | 6.3%), Europe (381 | 4.8%), Peru (330 | 4.1%), and Southern Europe (248 | 3.1%), together accounting for 29.2% of all Port Jefferson Station residents.
| Immigration Origin | # Population | % Population |
| Africa | 68 | 0.9% |
| Albania | 59 | 0.7% |
| Argentina | 53 | 0.7% |
| Asia | 168 | 2.1% |
| Canada | 18 | 0.2% |
| Caribbean | 133 | 1.7% |
| Central America | 231 | 2.9% |
| Chile | 7 | 0.1% |
| China | 22 | 0.3% |
| Colombia | 54 | 0.7% |
| Czechoslovakia | 11 | 0.1% |
| Dominican Republic | 133 | 1.7% |
| Eastern Asia | 32 | 0.4% |
| Eastern Europe | 114 | 1.4% |
| Ecuador | 43 | 0.5% |
| Egypt | 68 | 0.9% |
| El Salvador | 153 | 1.9% |
| England | 11 | 0.1% |
| Europe | 381 | 4.8% |
| Germany | 8 | 0.1% |
| Greece | 32 | 0.4% |
| Honduras | 73 | 0.9% |
| India | 53 | 0.7% |
| Iran | 83 | 1.0% |
| Italy | 48 | 0.6% |
| Korea | 10 | 0.1% |
| Latin America | 866 | 10.9% |
| Mexico | 5 | 0.1% |
| Northern Africa | 68 | 0.9% |
| Northern Europe | 11 | 0.1% |
| Peru | 330 | 4.1% |
| Poland | 44 | 0.5% |
| Portugal | 127 | 1.6% |
| South America | 502 | 6.3% |
| South Central Asia | 136 | 1.7% |
| Southern Europe | 248 | 3.1% |
| Spain | 41 | 0.5% |
| Venezuela | 15 | 0.2% |
| Western Europe | 8 | 0.1% | View All 39 Rows |
Sex and Age in Port Jefferson Station
Sex and Age in Port Jefferson Station
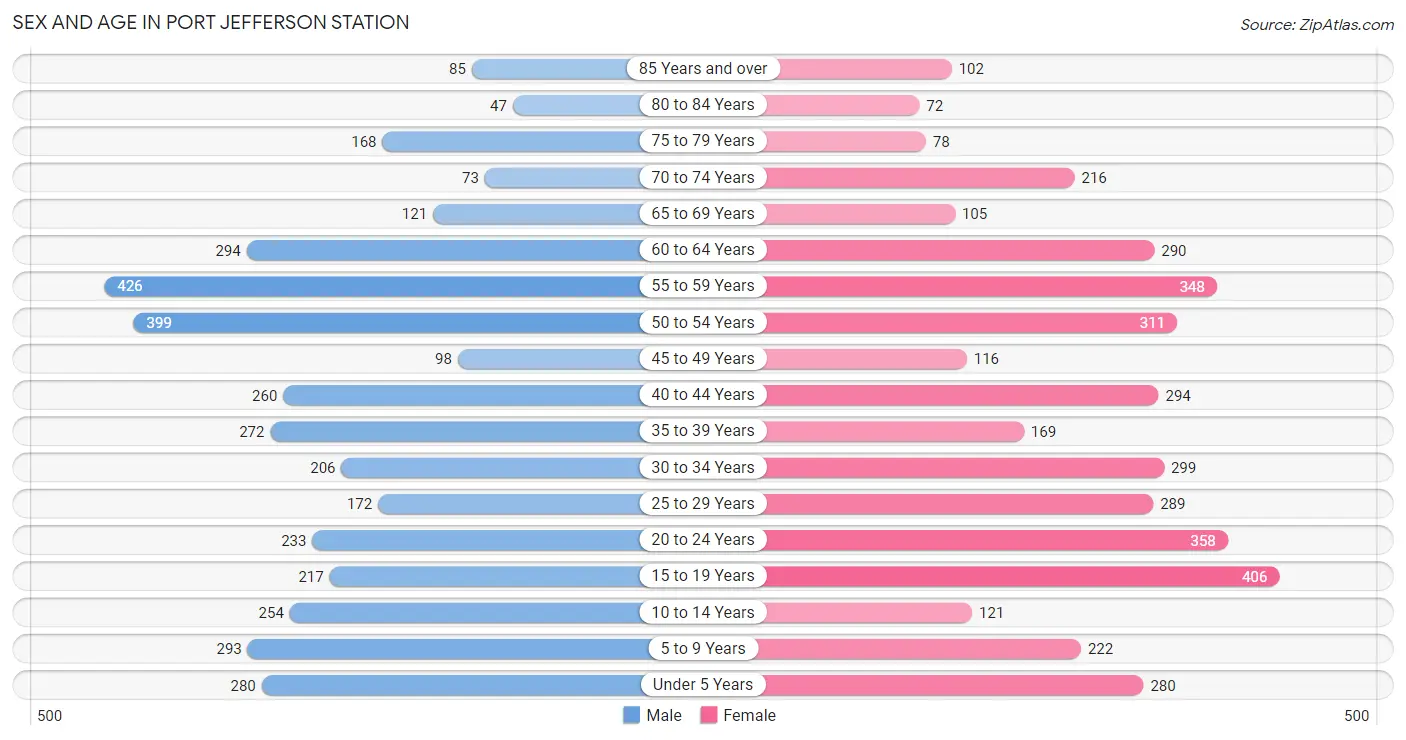
The most populous age groups in Port Jefferson Station are 55 to 59 Years (426 | 10.9%) for men and 15 to 19 Years (406 | 10.0%) for women.
| Age Bracket | Male | Female |
| Under 5 Years | 280 (7.2%) | 280 (6.9%) |
| 5 to 9 Years | 293 (7.5%) | 222 (5.4%) |
| 10 to 14 Years | 254 (6.5%) | 121 (3.0%) |
| 15 to 19 Years | 217 (5.6%) | 406 (10.0%) |
| 20 to 24 Years | 233 (6.0%) | 358 (8.8%) |
| 25 to 29 Years | 172 (4.4%) | 289 (7.1%) |
| 30 to 34 Years | 206 (5.3%) | 299 (7.3%) |
| 35 to 39 Years | 272 (7.0%) | 169 (4.2%) |
| 40 to 44 Years | 260 (6.7%) | 294 (7.2%) |
| 45 to 49 Years | 98 (2.5%) | 116 (2.9%) |
| 50 to 54 Years | 399 (10.2%) | 311 (7.6%) |
| 55 to 59 Years | 426 (10.9%) | 348 (8.5%) |
| 60 to 64 Years | 294 (7.5%) | 290 (7.1%) |
| 65 to 69 Years | 121 (3.1%) | 105 (2.6%) |
| 70 to 74 Years | 73 (1.9%) | 216 (5.3%) |
| 75 to 79 Years | 168 (4.3%) | 78 (1.9%) |
| 80 to 84 Years | 47 (1.2%) | 72 (1.8%) |
| 85 Years and over | 85 (2.2%) | 102 (2.5%) |
| Total | 3,898 (100.0%) | 4,076 (100.0%) |
Families and Households in Port Jefferson Station
Median Family Size in Port Jefferson Station
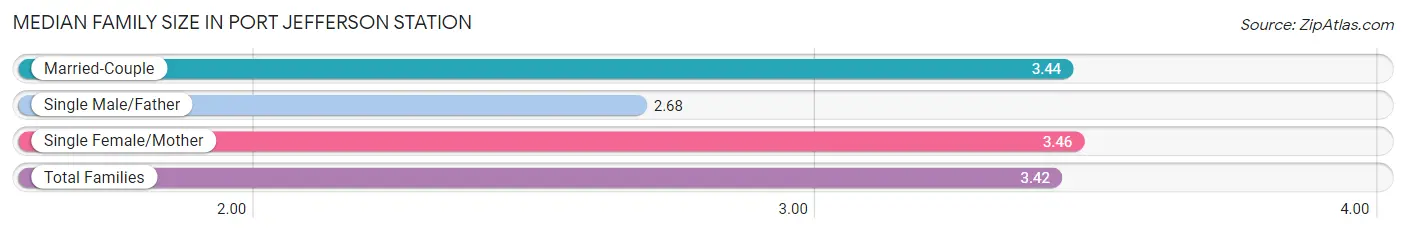
The median family size in Port Jefferson Station is 3.42 persons per family, with single female/mother families (203 | 10.1%) accounting for the largest median family size of 3.46 persons per family. On the other hand, single male/father families (73 | 3.6%) represent the smallest median family size with 2.68 persons per family.
| Family Type | # Families | Family Size |
| Married-Couple | 1,729 (86.2%) | 3.44 |
| Single Male/Father | 73 (3.6%) | 2.68 |
| Single Female/Mother | 203 (10.1%) | 3.46 |
| Total Families | 2,005 (100.0%) | 3.42 |
Median Household Size in Port Jefferson Station
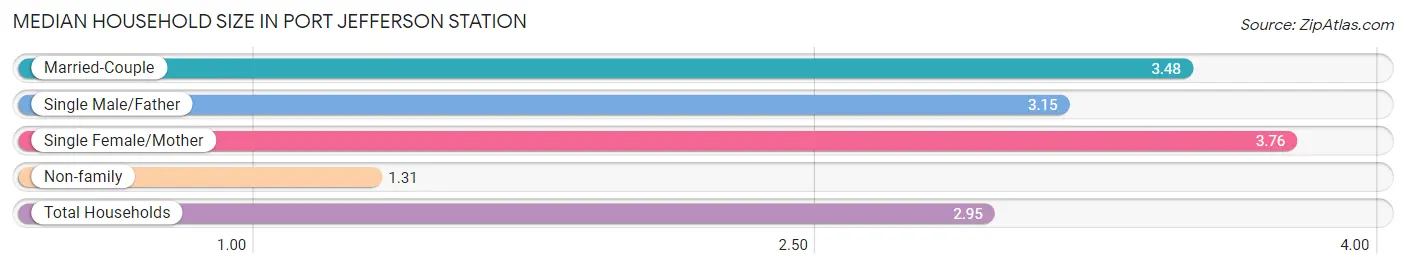
The median household size in Port Jefferson Station is 2.95 persons per household, with single female/mother households (203 | 7.6%) accounting for the largest median household size of 3.76 persons per household. non-family households (664 | 24.9%) represent the smallest median household size with 1.31 persons per household.
| Household Type | # Households | Household Size |
| Married-Couple | 1,729 (64.8%) | 3.48 |
| Single Male/Father | 73 (2.7%) | 3.15 |
| Single Female/Mother | 203 (7.6%) | 3.76 |
| Non-family | 664 (24.9%) | 1.31 |
| Total Households | 2,669 (100.0%) | 2.95 |
Household Size by Marriage Status in Port Jefferson Station
Out of a total of 2,669 households in Port Jefferson Station, 2,005 (75.1%) are family households, while 664 (24.9%) are nonfamily households. The most numerous type of family households are 4-person households, comprising 693, and the most common type of nonfamily households are 1-person households, comprising 471.
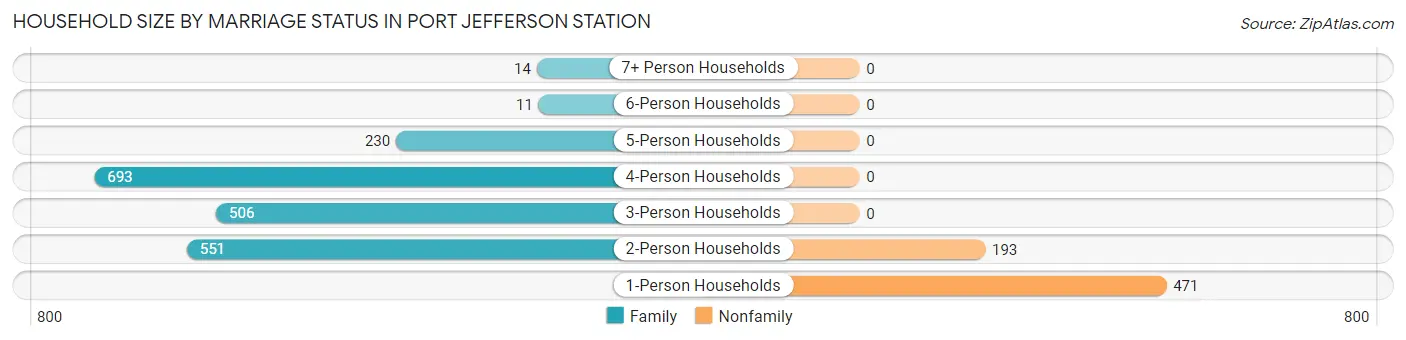
| Household Size | Family Households | Nonfamily Households |
| 1-Person Households | - | 471 (17.6%) |
| 2-Person Households | 551 (20.6%) | 193 (7.2%) |
| 3-Person Households | 506 (19.0%) | 0 (0.0%) |
| 4-Person Households | 693 (26.0%) | 0 (0.0%) |
| 5-Person Households | 230 (8.6%) | 0 (0.0%) |
| 6-Person Households | 11 (0.4%) | 0 (0.0%) |
| 7+ Person Households | 14 (0.5%) | 0 (0.0%) |
| Total | 2,005 (75.1%) | 664 (24.9%) |
Female Fertility in Port Jefferson Station
Fertility by Age in Port Jefferson Station
Average fertility rate in Port Jefferson Station is 18.0 births per 1,000 women. Women in the age bracket of 20 to 34 years have the highest fertility rate with 39.0 births per 1,000 women. Women in the age bracket of 20 to 34 years acount for 100.0% of all women with births.
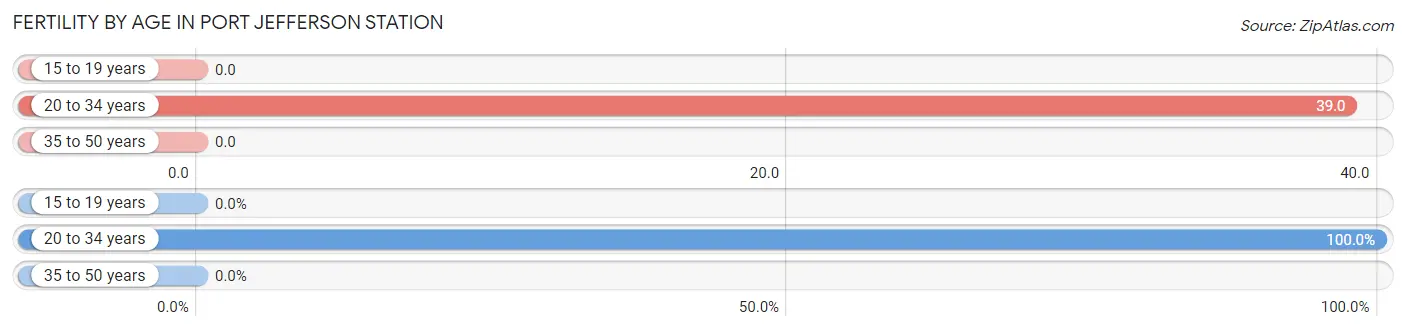
| Age Bracket | Women with Births | Births / 1,000 Women |
| 15 to 19 years | 0 (0.0%) | 0.0 |
| 20 to 34 years | 37 (100.0%) | 39.0 |
| 35 to 50 years | 0 (0.0%) | 0.0 |
| Total | 37 (100.0%) | 18.0 |
Fertility by Age by Marriage Status in Port Jefferson Station
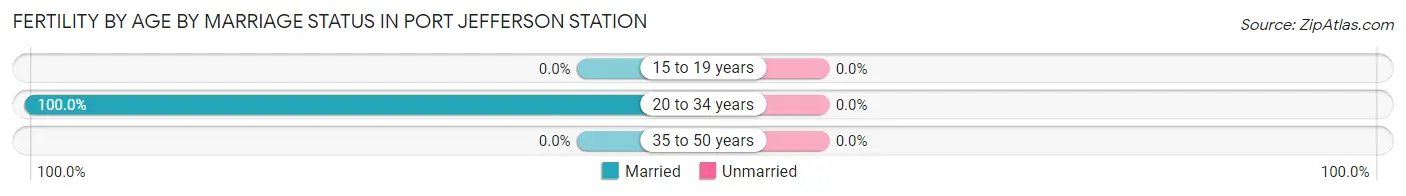
| Age Bracket | Married | Unmarried |
| 15 to 19 years | 0 (0.0%) | 0 (0.0%) |
| 20 to 34 years | 37 (100.0%) | 0 (0.0%) |
| 35 to 50 years | 0 (0.0%) | 0 (0.0%) |
| Total | 37 (100.0%) | 0 (0.0%) |
Fertility by Education in Port Jefferson Station
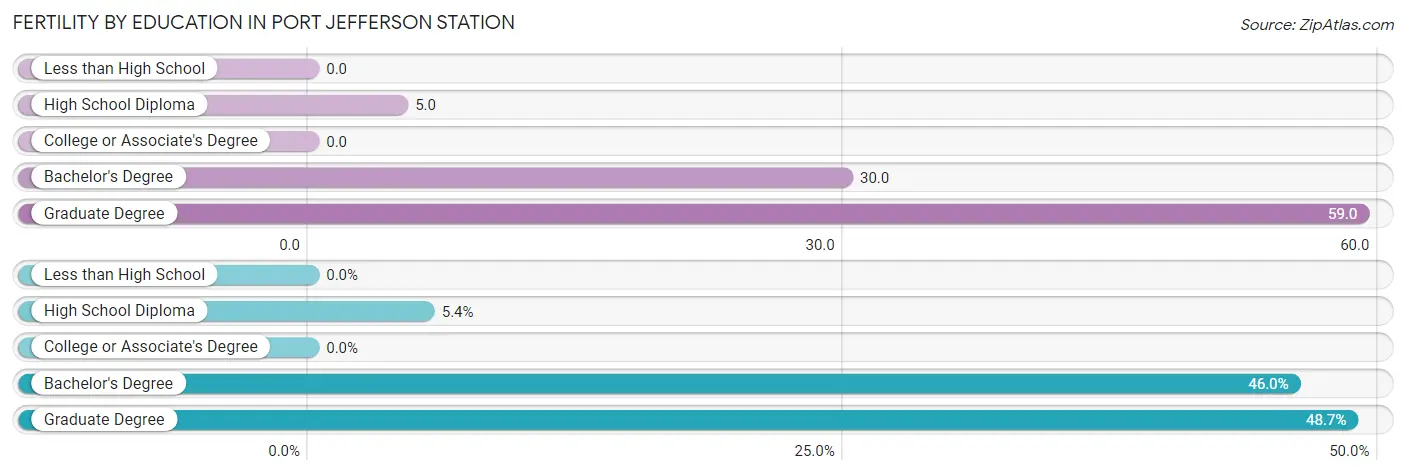
| Educational Attainment | Women with Births | Births / 1,000 Women |
| Less than High School | 0 (0.0%) | 0.0 |
| High School Diploma | 2 (5.4%) | 5.0 |
| College or Associate's Degree | 0 (0.0%) | 0.0 |
| Bachelor's Degree | 17 (46.0%) | 30.0 |
| Graduate Degree | 18 (48.6%) | 59.0 |
| Total | 37 (100.0%) | 18.0 |
Fertility by Education by Marriage Status in Port Jefferson Station
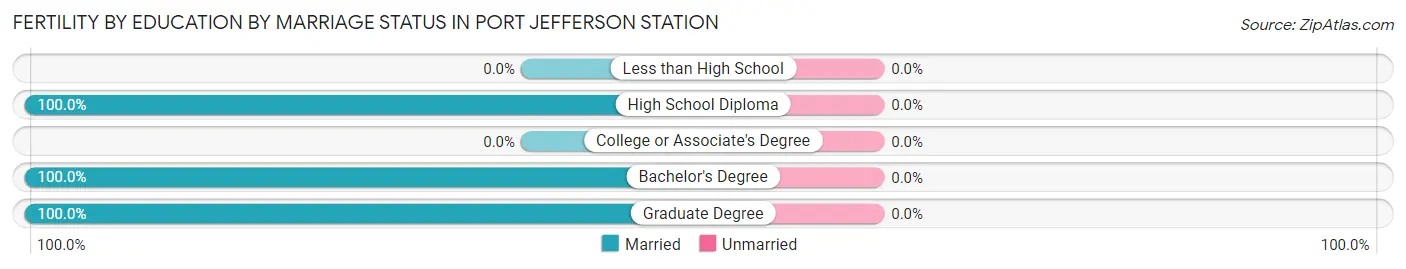
| Educational Attainment | Married | Unmarried |
| Less than High School | 0 (0.0%) | 0 (0.0%) |
| High School Diploma | 2 (100.0%) | 0 (0.0%) |
| College or Associate's Degree | 0 (0.0%) | 0 (0.0%) |
| Bachelor's Degree | 17 (100.0%) | 0 (0.0%) |
| Graduate Degree | 18 (100.0%) | 0 (0.0%) |
| Total | 37 (100.0%) | 0 (0.0%) |
Employment Characteristics in Port Jefferson Station
Employment by Class of Employer in Port Jefferson Station
Among the 3,800 employed individuals in Port Jefferson Station, private company employees (2,328 | 61.3%), local government employees (520 | 13.7%), and state government employees (406 | 10.7%) make up the most common classes of employment.
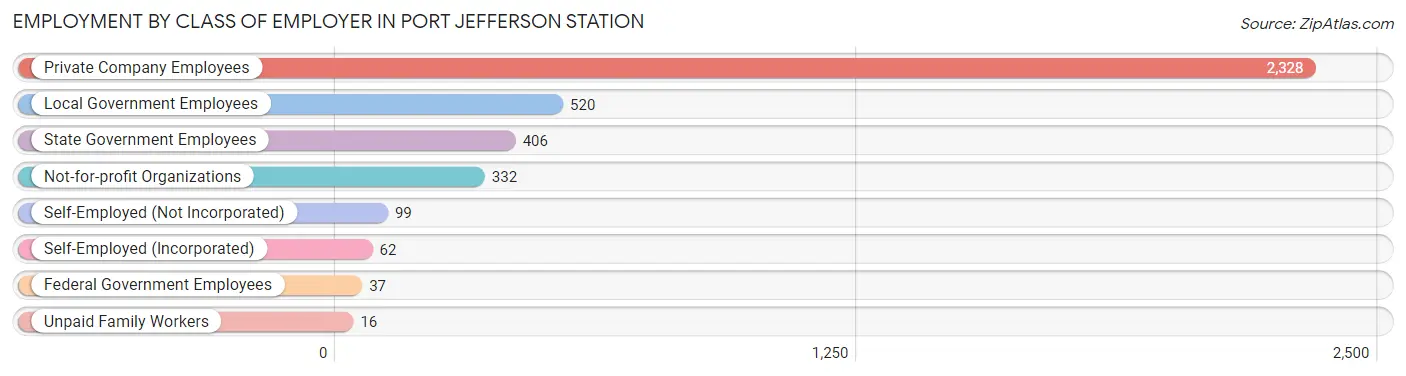
| Employer Class | # Employees | % Employees |
| Private Company Employees | 2,328 | 61.3% |
| Self-Employed (Incorporated) | 62 | 1.6% |
| Self-Employed (Not Incorporated) | 99 | 2.6% |
| Not-for-profit Organizations | 332 | 8.7% |
| Local Government Employees | 520 | 13.7% |
| State Government Employees | 406 | 10.7% |
| Federal Government Employees | 37 | 1.0% |
| Unpaid Family Workers | 16 | 0.4% |
| Total | 3,800 | 100.0% |
Employment Status by Age in Port Jefferson Station
According to the labor force statistics for Port Jefferson Station, out of the total population over 16 years of age (6,328), 65.5% or 4,145 individuals are in the labor force, with 7.1% or 294 of them unemployed. The age group with the highest labor force participation rate is 20 to 24 years, with 89.7% or 530 individuals in the labor force. Within the labor force, the 20 to 24 years age range has the highest percentage of unemployed individuals, with 19.2% or 102 of them being unemployed.
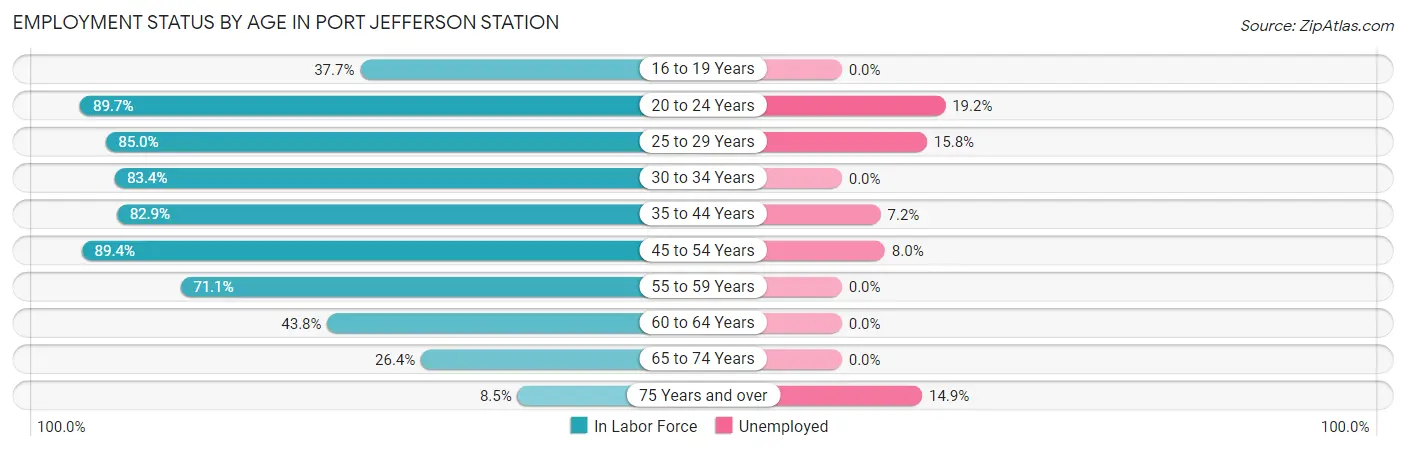
| Age Bracket | In Labor Force | Unemployed |
| 16 to 19 Years | 161 (37.7%) | 0 (0.0%) |
| 20 to 24 Years | 530 (89.7%) | 102 (19.2%) |
| 25 to 29 Years | 392 (85.0%) | 62 (15.8%) |
| 30 to 34 Years | 421 (83.4%) | 0 (0.0%) |
| 35 to 44 Years | 825 (82.9%) | 59 (7.2%) |
| 45 to 54 Years | 826 (89.4%) | 66 (8.0%) |
| 55 to 59 Years | 550 (71.1%) | 0 (0.0%) |
| 60 to 64 Years | 256 (43.8%) | 0 (0.0%) |
| 65 to 74 Years | 136 (26.4%) | 0 (0.0%) |
| 75 Years and over | 47 (8.5%) | 7 (14.9%) |
| Total | 4,145 (65.5%) | 294 (7.1%) |
Employment Status by Educational Attainment in Port Jefferson Station
According to labor force statistics for Port Jefferson Station, 77.1% of individuals (3,271) out of the total population between 25 and 64 years of age (4,243) are in the labor force, with 5.7% or 186 of them being unemployed. The group with the highest labor force participation rate are those with the educational attainment of bachelor's degree or higher, with 84.4% or 1,520 individuals in the labor force. Within the labor force, individuals with high school diploma education have the highest percentage of unemployment, with 8.1% or 80 of them being unemployed.
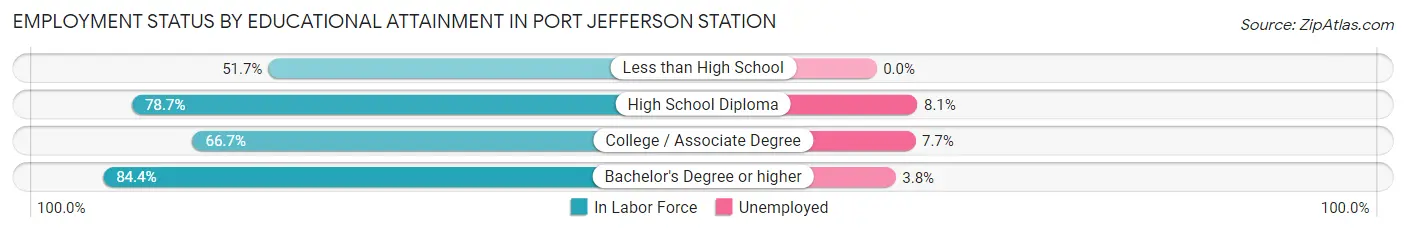
| Educational Attainment | In Labor Force | Unemployed |
| Less than High School | 106 (51.7%) | 0 (0.0%) |
| High School Diploma | 992 (78.7%) | 102 (8.1%) |
| College / Associate Degree | 651 (66.7%) | 75 (7.7%) |
| Bachelor's Degree or higher | 1,520 (84.4%) | 68 (3.8%) |
| Total | 3,271 (77.1%) | 242 (5.7%) |
Employment Occupations by Sex in Port Jefferson Station
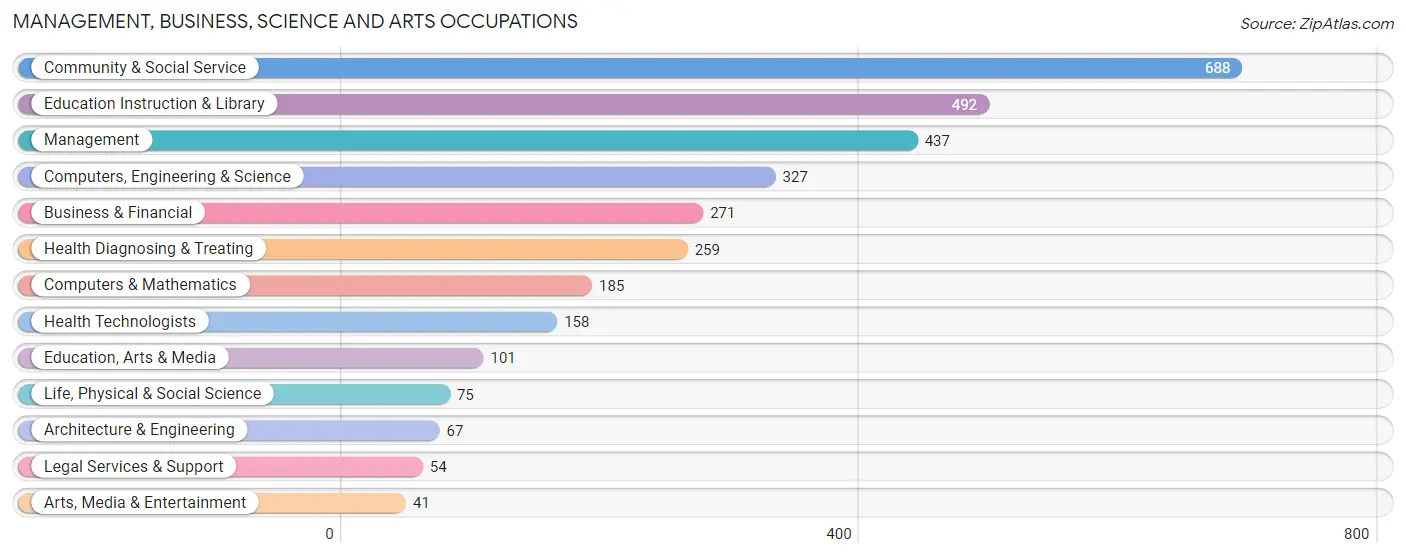
Management, Business, Science and Arts Occupations
The most common Management, Business, Science and Arts occupations in Port Jefferson Station are Community & Social Service (688 | 17.9%), Education Instruction & Library (492 | 12.8%), Management (437 | 11.4%), Computers, Engineering & Science (327 | 8.5%), and Business & Financial (271 | 7.0%).
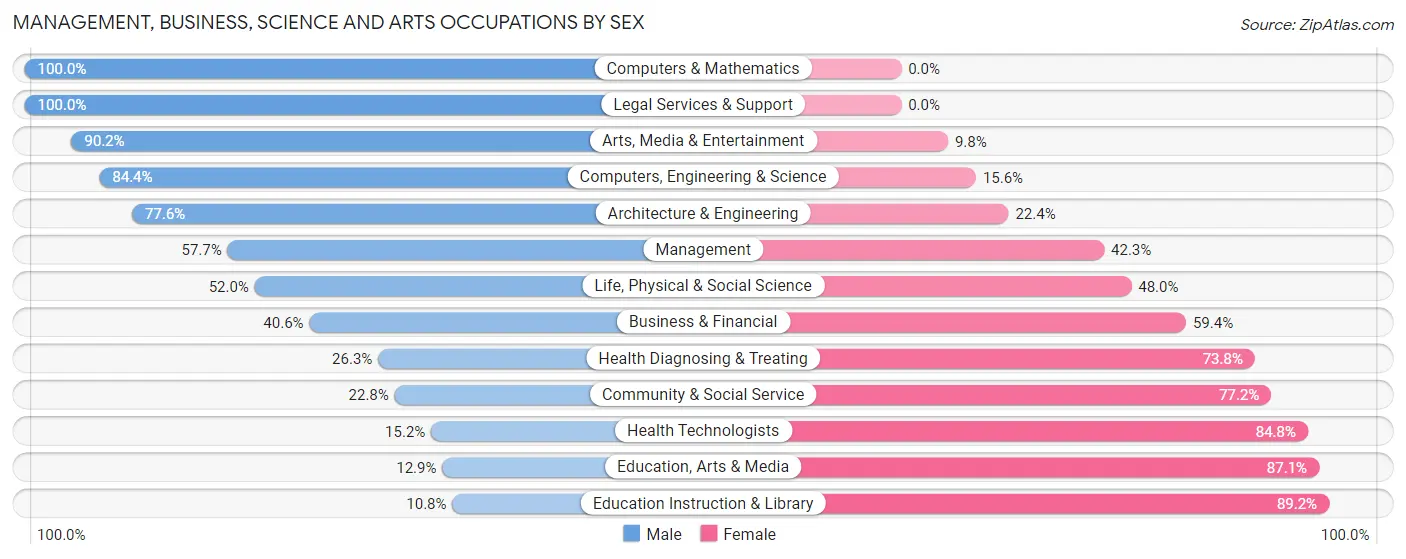
Management, Business, Science and Arts Occupations by Sex
Within the Management, Business, Science and Arts occupations in Port Jefferson Station, the most male-oriented occupations are Computers & Mathematics (100.0%), Legal Services & Support (100.0%), and Arts, Media & Entertainment (90.2%), while the most female-oriented occupations are Education Instruction & Library (89.2%), Education, Arts & Media (87.1%), and Health Technologists (84.8%).
| Occupation | Male | Female |
| Management | 252 (57.7%) | 185 (42.3%) |
| Business & Financial | 110 (40.6%) | 161 (59.4%) |
| Computers, Engineering & Science | 276 (84.4%) | 51 (15.6%) |
| Computers & Mathematics | 185 (100.0%) | 0 (0.0%) |
| Architecture & Engineering | 52 (77.6%) | 15 (22.4%) |
| Life, Physical & Social Science | 39 (52.0%) | 36 (48.0%) |
| Community & Social Service | 157 (22.8%) | 531 (77.2%) |
| Education, Arts & Media | 13 (12.9%) | 88 (87.1%) |
| Legal Services & Support | 54 (100.0%) | 0 (0.0%) |
| Education Instruction & Library | 53 (10.8%) | 439 (89.2%) |
| Arts, Media & Entertainment | 37 (90.2%) | 4 (9.8%) |
| Health Diagnosing & Treating | 68 (26.3%) | 191 (73.8%) |
| Health Technologists | 24 (15.2%) | 134 (84.8%) |
| Total (Category) | 863 (43.5%) | 1,119 (56.5%) |
| Total (Overall) | 1,964 (51.0%) | 1,884 (49.0%) |
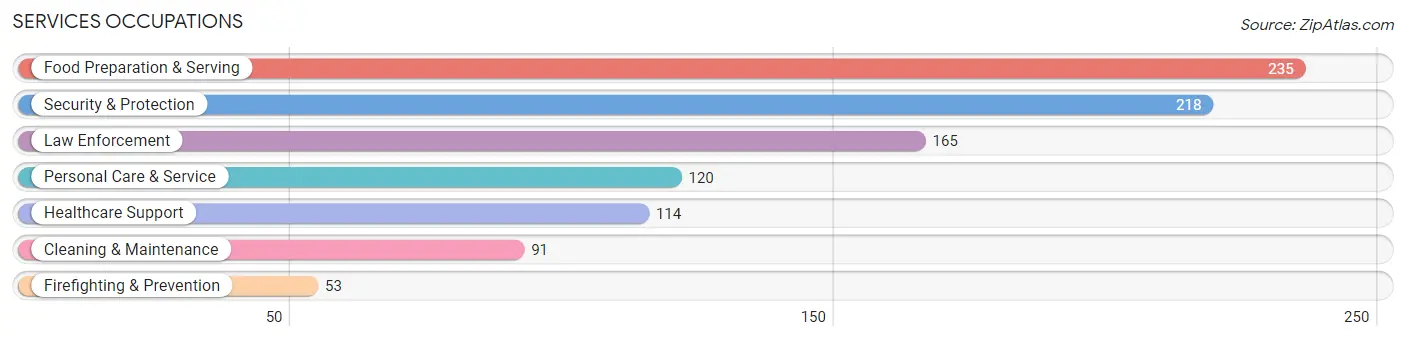
Services Occupations
The most common Services occupations in Port Jefferson Station are Food Preparation & Serving (235 | 6.1%), Security & Protection (218 | 5.7%), Law Enforcement (165 | 4.3%), Personal Care & Service (120 | 3.1%), and Healthcare Support (114 | 3.0%).
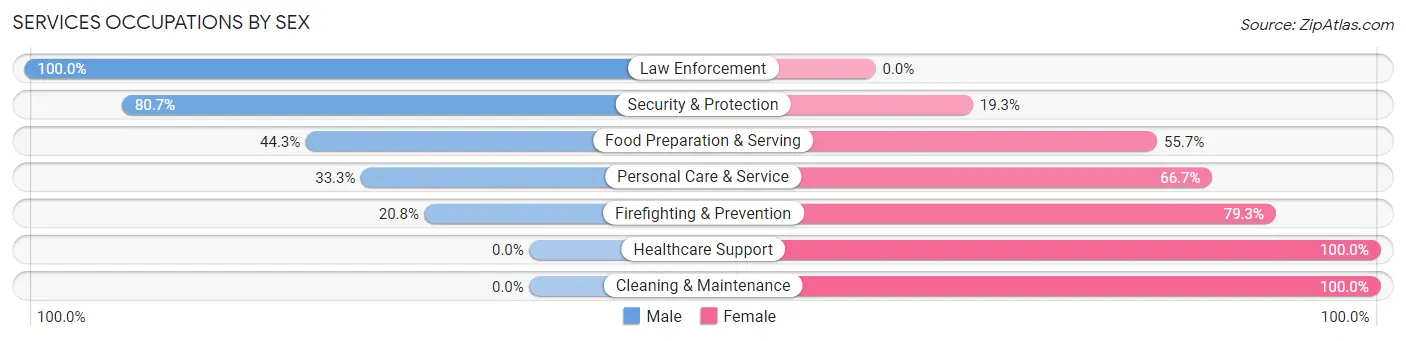
Services Occupations by Sex
Within the Services occupations in Port Jefferson Station, the most male-oriented occupations are Law Enforcement (100.0%), Security & Protection (80.7%), and Food Preparation & Serving (44.3%), while the most female-oriented occupations are Healthcare Support (100.0%), Cleaning & Maintenance (100.0%), and Firefighting & Prevention (79.2%).
| Occupation | Male | Female |
| Healthcare Support | 0 (0.0%) | 114 (100.0%) |
| Security & Protection | 176 (80.7%) | 42 (19.3%) |
| Firefighting & Prevention | 11 (20.7%) | 42 (79.2%) |
| Law Enforcement | 165 (100.0%) | 0 (0.0%) |
| Food Preparation & Serving | 104 (44.3%) | 131 (55.7%) |
| Cleaning & Maintenance | 0 (0.0%) | 91 (100.0%) |
| Personal Care & Service | 40 (33.3%) | 80 (66.7%) |
| Total (Category) | 320 (41.1%) | 458 (58.9%) |
| Total (Overall) | 1,964 (51.0%) | 1,884 (49.0%) |
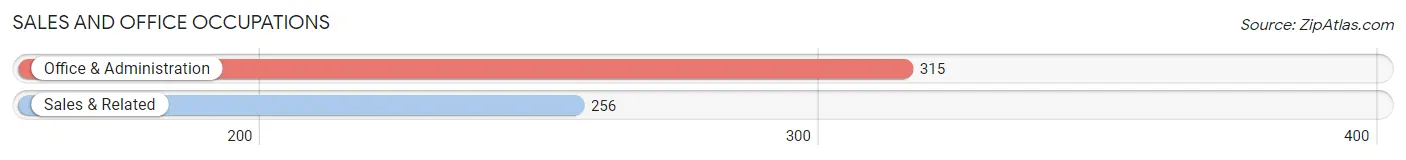
Sales and Office Occupations
The most common Sales and Office occupations in Port Jefferson Station are Office & Administration (315 | 8.2%), and Sales & Related (256 | 6.7%).
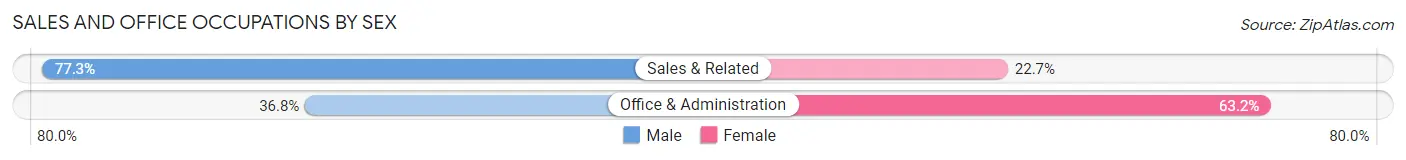
Sales and Office Occupations by Sex
| Occupation | Male | Female |
| Sales & Related | 198 (77.3%) | 58 (22.7%) |
| Office & Administration | 116 (36.8%) | 199 (63.2%) |
| Total (Category) | 314 (55.0%) | 257 (45.0%) |
| Total (Overall) | 1,964 (51.0%) | 1,884 (49.0%) |
Natural Resources, Construction and Maintenance Occupations
The most common Natural Resources, Construction and Maintenance occupations in Port Jefferson Station are Construction & Extraction (102 | 2.6%), and Installation, Maintenance & Repair (73 | 1.9%).

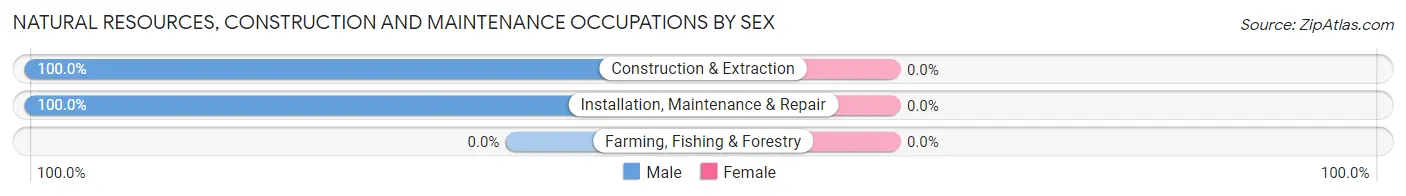
Natural Resources, Construction and Maintenance Occupations by Sex
| Occupation | Male | Female |
| Farming, Fishing & Forestry | 0 (0.0%) | 0 (0.0%) |
| Construction & Extraction | 102 (100.0%) | 0 (0.0%) |
| Installation, Maintenance & Repair | 73 (100.0%) | 0 (0.0%) |
| Total (Category) | 175 (100.0%) | 0 (0.0%) |
| Total (Overall) | 1,964 (51.0%) | 1,884 (49.0%) |
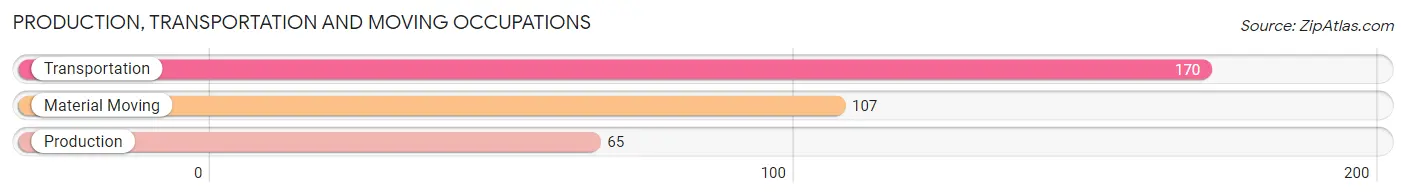
Production, Transportation and Moving Occupations
The most common Production, Transportation and Moving occupations in Port Jefferson Station are Transportation (170 | 4.4%), Material Moving (107 | 2.8%), and Production (65 | 1.7%).
Production, Transportation and Moving Occupations by Sex
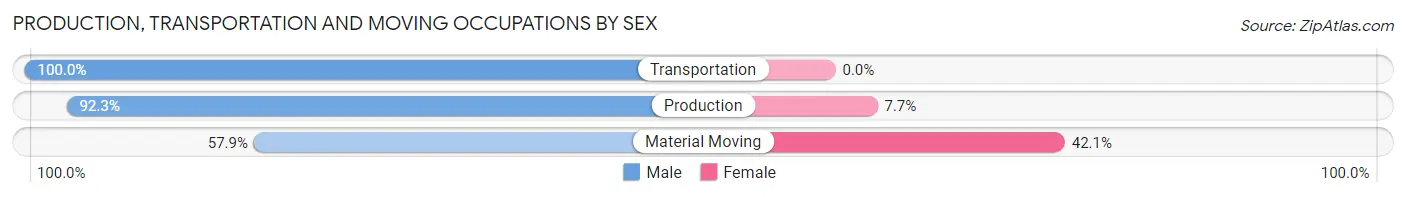
| Occupation | Male | Female |
| Production | 60 (92.3%) | 5 (7.7%) |
| Transportation | 170 (100.0%) | 0 (0.0%) |
| Material Moving | 62 (57.9%) | 45 (42.1%) |
| Total (Category) | 292 (85.4%) | 50 (14.6%) |
| Total (Overall) | 1,964 (51.0%) | 1,884 (49.0%) |
Employment Industries by Sex in Port Jefferson Station
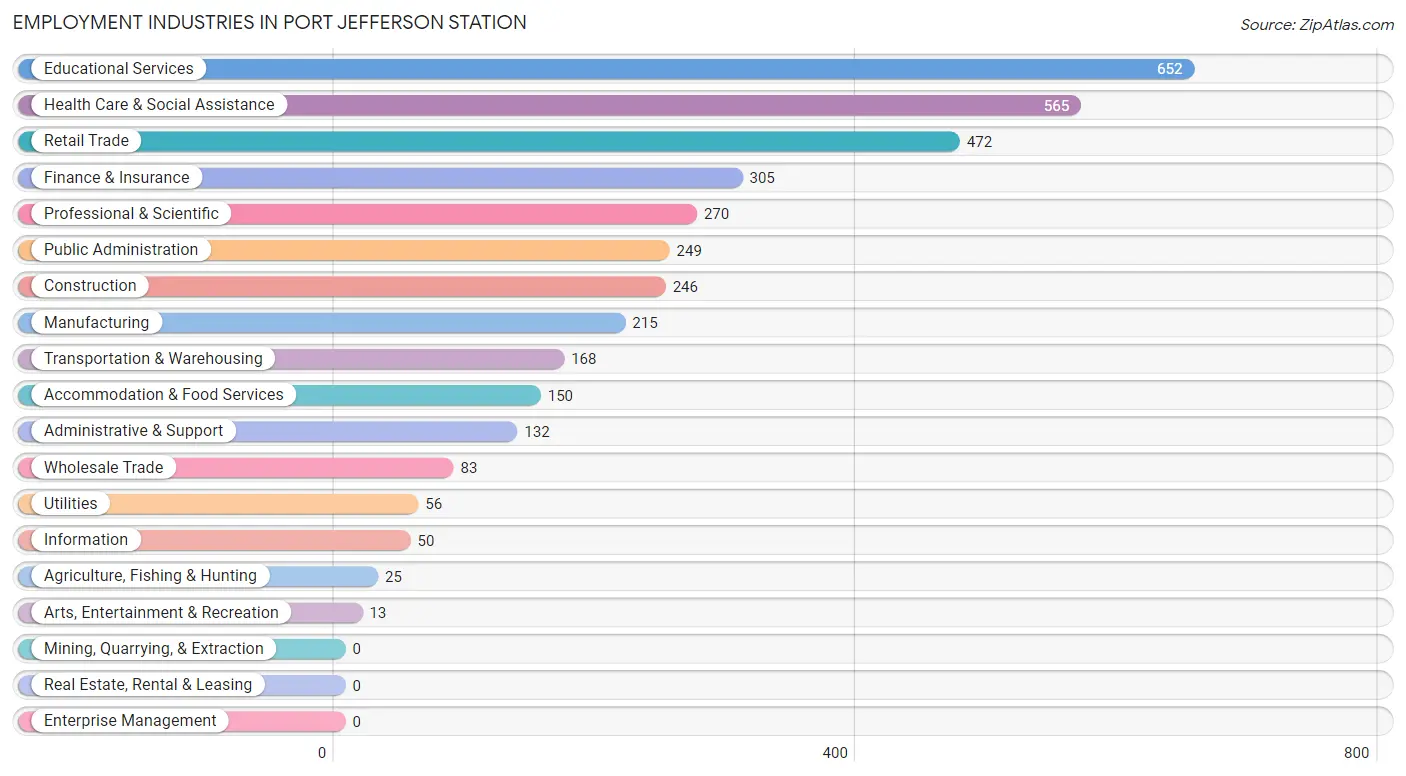
Employment Industries in Port Jefferson Station
The major employment industries in Port Jefferson Station include Educational Services (652 | 16.9%), Health Care & Social Assistance (565 | 14.7%), Retail Trade (472 | 12.3%), Finance & Insurance (305 | 7.9%), and Professional & Scientific (270 | 7.0%).
Employment Industries by Sex in Port Jefferson Station
The Port Jefferson Station industries that see more men than women are Transportation & Warehousing (100.0%), Utilities (100.0%), and Construction (93.1%), whereas the industries that tend to have a higher number of women are Agriculture, Fishing & Hunting (100.0%), Arts, Entertainment & Recreation (100.0%), and Health Care & Social Assistance (87.4%).
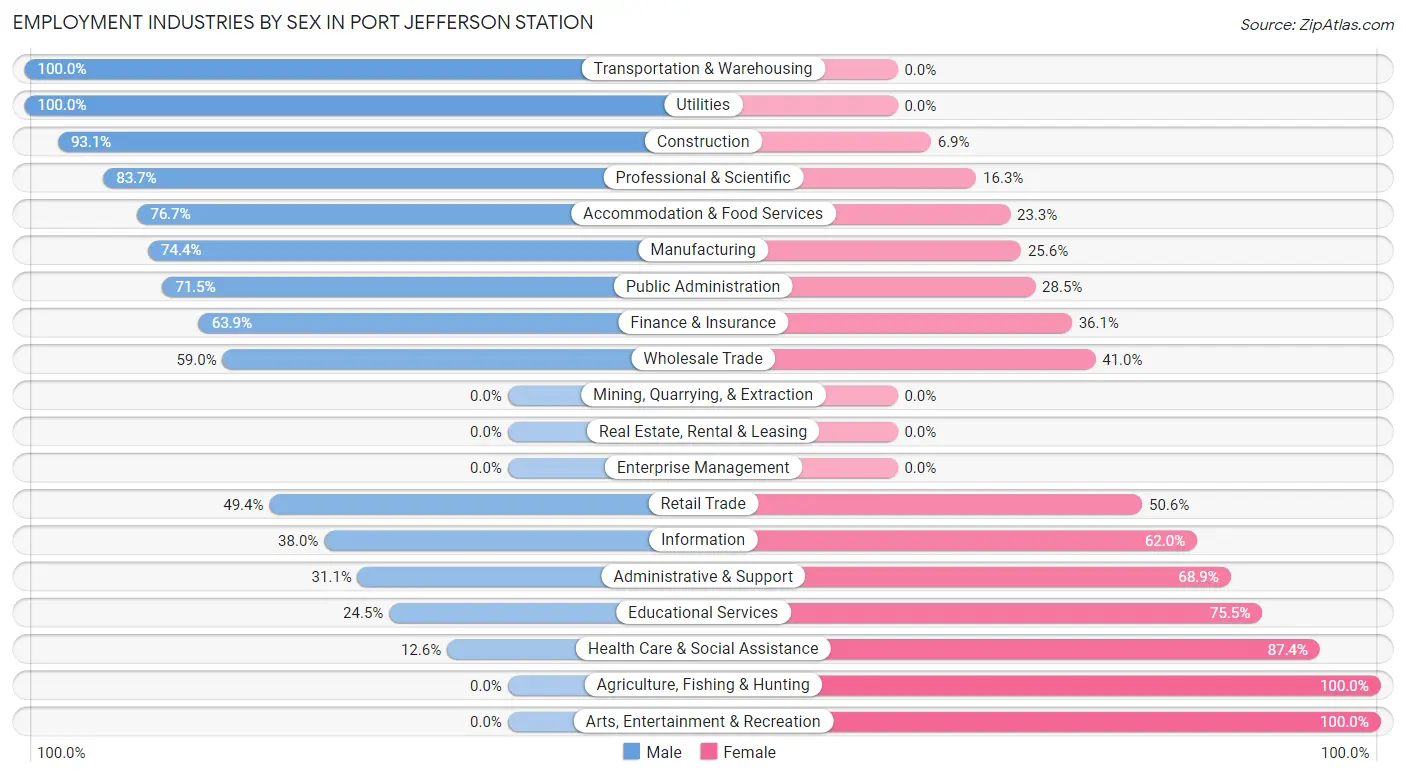
| Industry | Male | Female |
| Agriculture, Fishing & Hunting | 0 (0.0%) | 25 (100.0%) |
| Mining, Quarrying, & Extraction | 0 (0.0%) | 0 (0.0%) |
| Construction | 229 (93.1%) | 17 (6.9%) |
| Manufacturing | 160 (74.4%) | 55 (25.6%) |
| Wholesale Trade | 49 (59.0%) | 34 (41.0%) |
| Retail Trade | 233 (49.4%) | 239 (50.6%) |
| Transportation & Warehousing | 168 (100.0%) | 0 (0.0%) |
| Utilities | 56 (100.0%) | 0 (0.0%) |
| Information | 19 (38.0%) | 31 (62.0%) |
| Finance & Insurance | 195 (63.9%) | 110 (36.1%) |
| Real Estate, Rental & Leasing | 0 (0.0%) | 0 (0.0%) |
| Professional & Scientific | 226 (83.7%) | 44 (16.3%) |
| Enterprise Management | 0 (0.0%) | 0 (0.0%) |
| Administrative & Support | 41 (31.1%) | 91 (68.9%) |
| Educational Services | 160 (24.5%) | 492 (75.5%) |
| Health Care & Social Assistance | 71 (12.6%) | 494 (87.4%) |
| Arts, Entertainment & Recreation | 0 (0.0%) | 13 (100.0%) |
| Accommodation & Food Services | 115 (76.7%) | 35 (23.3%) |
| Public Administration | 178 (71.5%) | 71 (28.5%) |
| Total | 1,964 (51.0%) | 1,884 (49.0%) |
Education in Port Jefferson Station
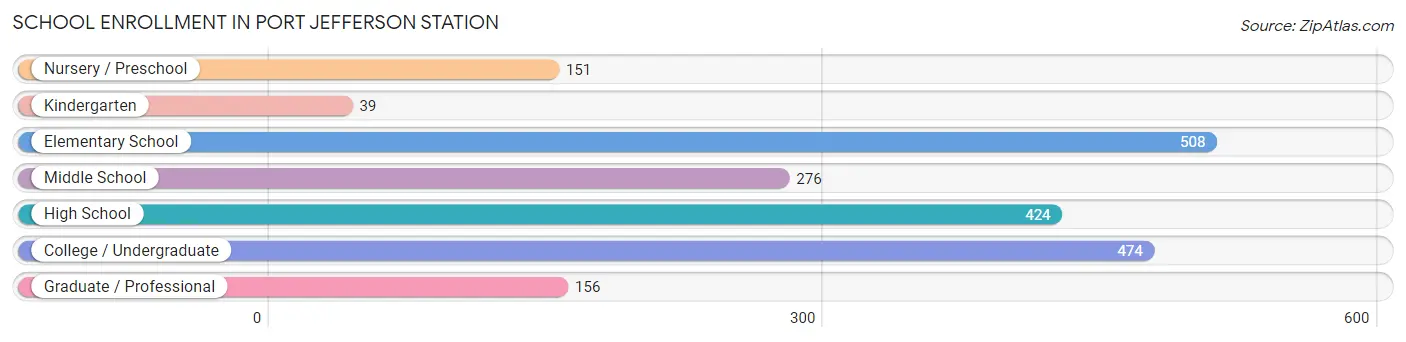
School Enrollment in Port Jefferson Station
The most common levels of schooling among the 2,028 students in Port Jefferson Station are elementary school (508 | 25.1%), college / undergraduate (474 | 23.4%), and high school (424 | 20.9%).
| School Level | # Students | % Students |
| Nursery / Preschool | 151 | 7.4% |
| Kindergarten | 39 | 1.9% |
| Elementary School | 508 | 25.1% |
| Middle School | 276 | 13.6% |
| High School | 424 | 20.9% |
| College / Undergraduate | 474 | 23.4% |
| Graduate / Professional | 156 | 7.7% |
| Total | 2,028 | 100.0% |
School Enrollment by Age by Funding Source in Port Jefferson Station
Out of a total of 2,028 students who are enrolled in schools in Port Jefferson Station, 314 (15.5%) attend a private institution, while the remaining 1,714 (84.5%) are enrolled in public schools. The age group of 3 to 4 year olds has the highest likelihood of being enrolled in private schools, with 110 (72.9% in the age bracket) enrolled. Conversely, the age group of 10 to 14 year olds has the lowest likelihood of being enrolled in a private school, with 375 (100.0% in the age bracket) attending a public institution.
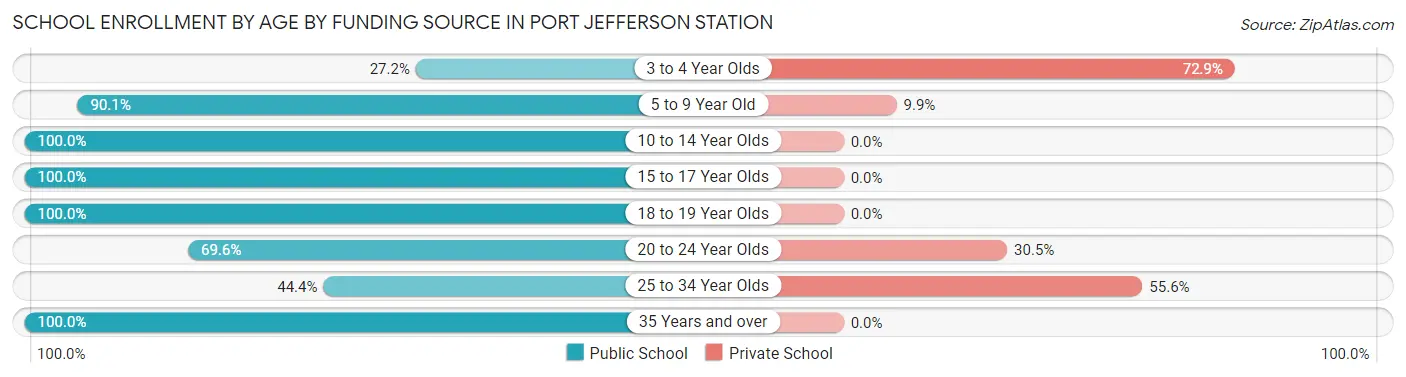
| Age Bracket | Public School | Private School |
| 3 to 4 Year Olds | 41 (27.2%) | 110 (72.9%) |
| 5 to 9 Year Old | 448 (90.1%) | 49 (9.9%) |
| 10 to 14 Year Olds | 375 (100.0%) | 0 (0.0%) |
| 15 to 17 Year Olds | 338 (100.0%) | 0 (0.0%) |
| 18 to 19 Year Olds | 244 (100.0%) | 0 (0.0%) |
| 20 to 24 Year Olds | 185 (69.6%) | 81 (30.4%) |
| 25 to 34 Year Olds | 59 (44.4%) | 74 (55.6%) |
| 35 Years and over | 24 (100.0%) | 0 (0.0%) |
| Total | 1,714 (84.5%) | 314 (15.5%) |
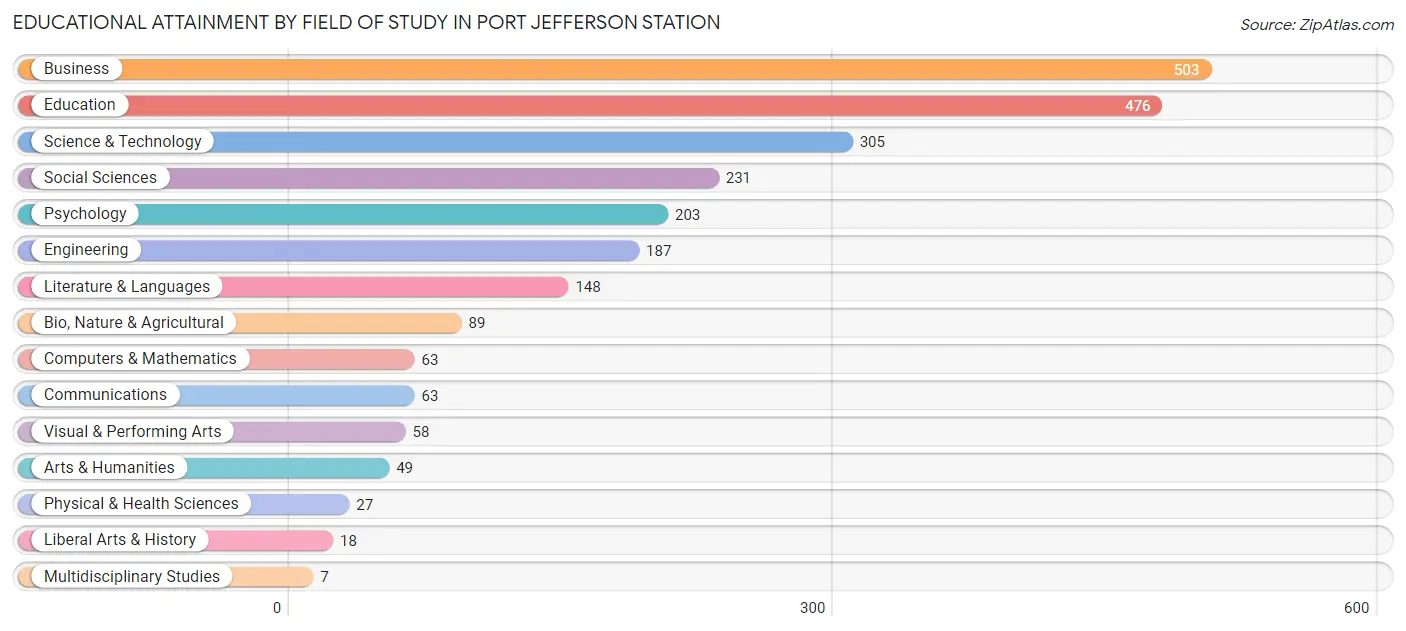
Educational Attainment by Field of Study in Port Jefferson Station
Business (503 | 20.7%), education (476 | 19.6%), science & technology (305 | 12.6%), social sciences (231 | 9.5%), and psychology (203 | 8.4%) are the most common fields of study among 2,427 individuals in Port Jefferson Station who have obtained a bachelor's degree or higher.
| Field of Study | # Graduates | % Graduates |
| Computers & Mathematics | 63 | 2.6% |
| Bio, Nature & Agricultural | 89 | 3.7% |
| Physical & Health Sciences | 27 | 1.1% |
| Psychology | 203 | 8.4% |
| Social Sciences | 231 | 9.5% |
| Engineering | 187 | 7.7% |
| Multidisciplinary Studies | 7 | 0.3% |
| Science & Technology | 305 | 12.6% |
| Business | 503 | 20.7% |
| Education | 476 | 19.6% |
| Literature & Languages | 148 | 6.1% |
| Liberal Arts & History | 18 | 0.7% |
| Visual & Performing Arts | 58 | 2.4% |
| Communications | 63 | 2.6% |
| Arts & Humanities | 49 | 2.0% |
| Total | 2,427 | 100.0% |
Transportation & Commute in Port Jefferson Station
Vehicle Availability by Sex in Port Jefferson Station
The most prevalent vehicle ownership categories in Port Jefferson Station are males with 2 vehicles (886, accounting for 45.7%) and females with 2 vehicles (685, making up 47.6%).
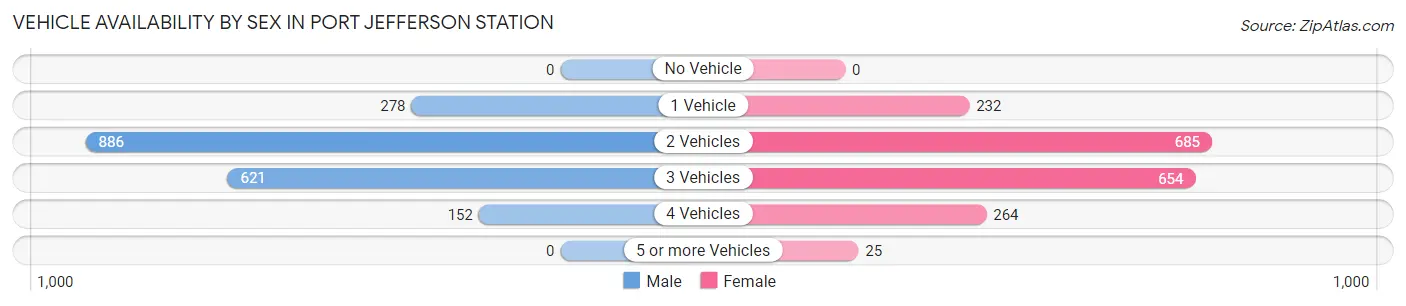
| Vehicles Available | Male | Female |
| No Vehicle | 0 (0.0%) | 0 (0.0%) |
| 1 Vehicle | 278 (14.3%) | 232 (12.5%) |
| 2 Vehicles | 886 (45.7%) | 685 (36.8%) |
| 3 Vehicles | 621 (32.1%) | 654 (35.2%) |
| 4 Vehicles | 152 (7.9%) | 264 (14.2%) |
| 5 or more Vehicles | 0 (0.0%) | 25 (1.3%) |
| Total | 1,937 (100.0%) | 1,860 (100.0%) |
Commute Time in Port Jefferson Station
The most frequently occuring commute durations in Port Jefferson Station are 30 to 34 minutes (595 commuters, 17.8%), 10 to 14 minutes (521 commuters, 15.6%), and 20 to 24 minutes (455 commuters, 13.6%).
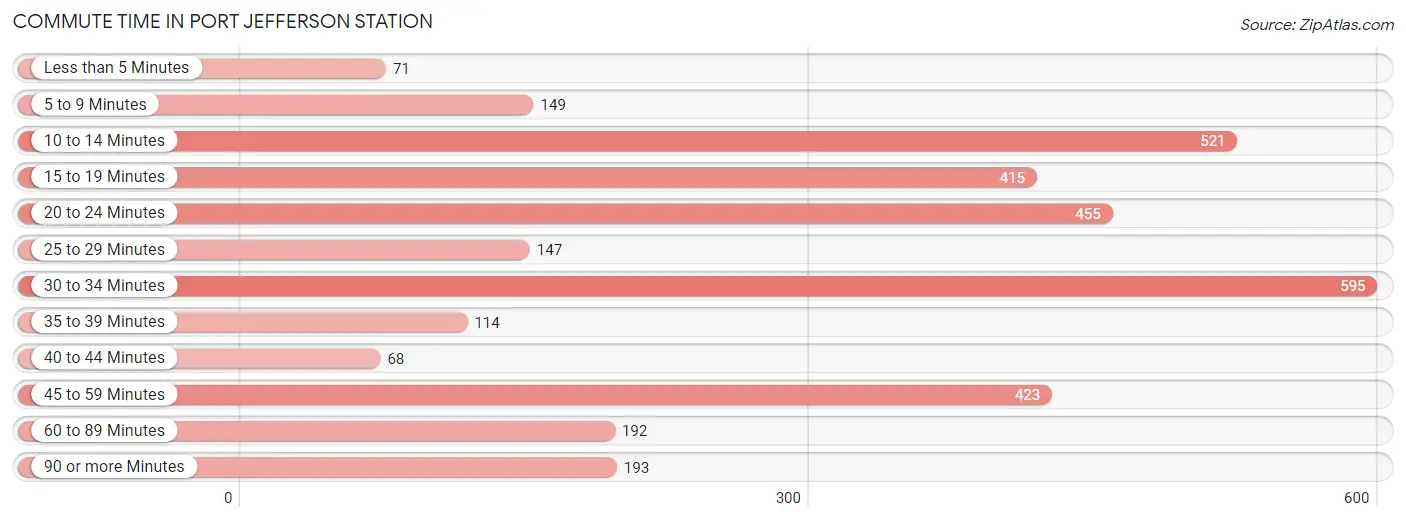
| Commute Time | # Commuters | % Commuters |
| Less than 5 Minutes | 71 | 2.1% |
| 5 to 9 Minutes | 149 | 4.5% |
| 10 to 14 Minutes | 521 | 15.6% |
| 15 to 19 Minutes | 415 | 12.4% |
| 20 to 24 Minutes | 455 | 13.6% |
| 25 to 29 Minutes | 147 | 4.4% |
| 30 to 34 Minutes | 595 | 17.8% |
| 35 to 39 Minutes | 114 | 3.4% |
| 40 to 44 Minutes | 68 | 2.0% |
| 45 to 59 Minutes | 423 | 12.7% |
| 60 to 89 Minutes | 192 | 5.7% |
| 90 or more Minutes | 193 | 5.8% |
Commute Time by Sex in Port Jefferson Station
The most common commute times in Port Jefferson Station are 45 to 59 minutes (331 commuters, 19.3%) for males and 10 to 14 minutes (389 commuters, 23.9%) for females.
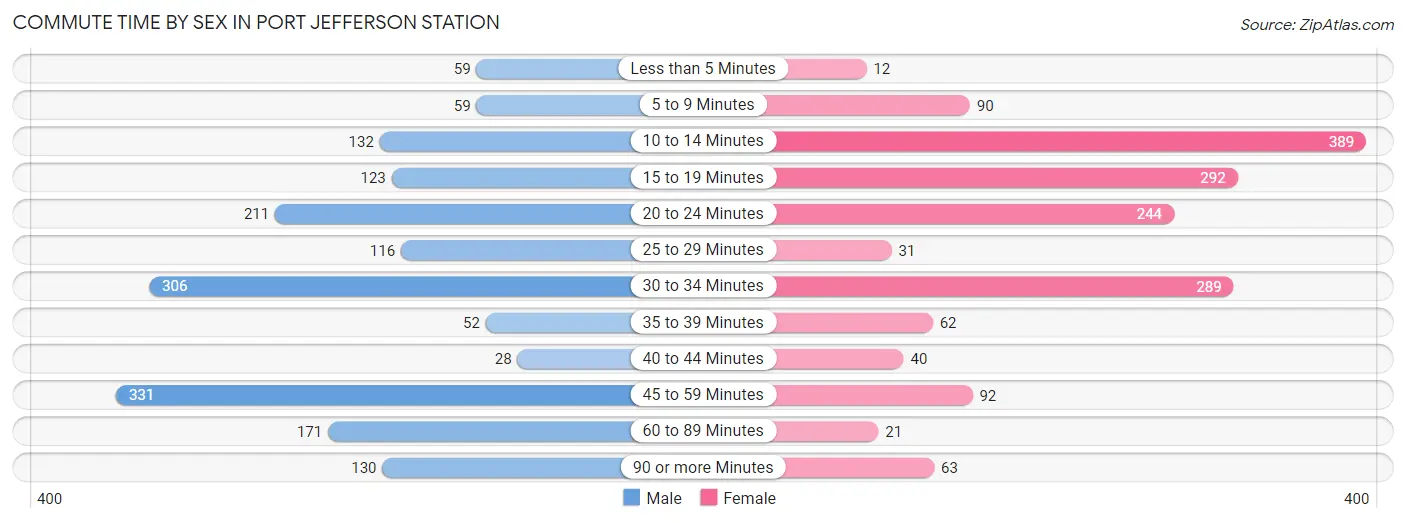
| Commute Time | Male | Female |
| Less than 5 Minutes | 59 (3.4%) | 12 (0.7%) |
| 5 to 9 Minutes | 59 (3.4%) | 90 (5.5%) |
| 10 to 14 Minutes | 132 (7.7%) | 389 (23.9%) |
| 15 to 19 Minutes | 123 (7.2%) | 292 (18.0%) |
| 20 to 24 Minutes | 211 (12.3%) | 244 (15.0%) |
| 25 to 29 Minutes | 116 (6.8%) | 31 (1.9%) |
| 30 to 34 Minutes | 306 (17.8%) | 289 (17.8%) |
| 35 to 39 Minutes | 52 (3.0%) | 62 (3.8%) |
| 40 to 44 Minutes | 28 (1.6%) | 40 (2.5%) |
| 45 to 59 Minutes | 331 (19.3%) | 92 (5.7%) |
| 60 to 89 Minutes | 171 (10.0%) | 21 (1.3%) |
| 90 or more Minutes | 130 (7.6%) | 63 (3.9%) |
Time of Departure to Work by Sex in Port Jefferson Station
The most frequent times of departure to work in Port Jefferson Station are 8:00 AM to 8:29 AM (254, 14.8%) for males and 6:30 AM to 6:59 AM (266, 16.4%) for females.
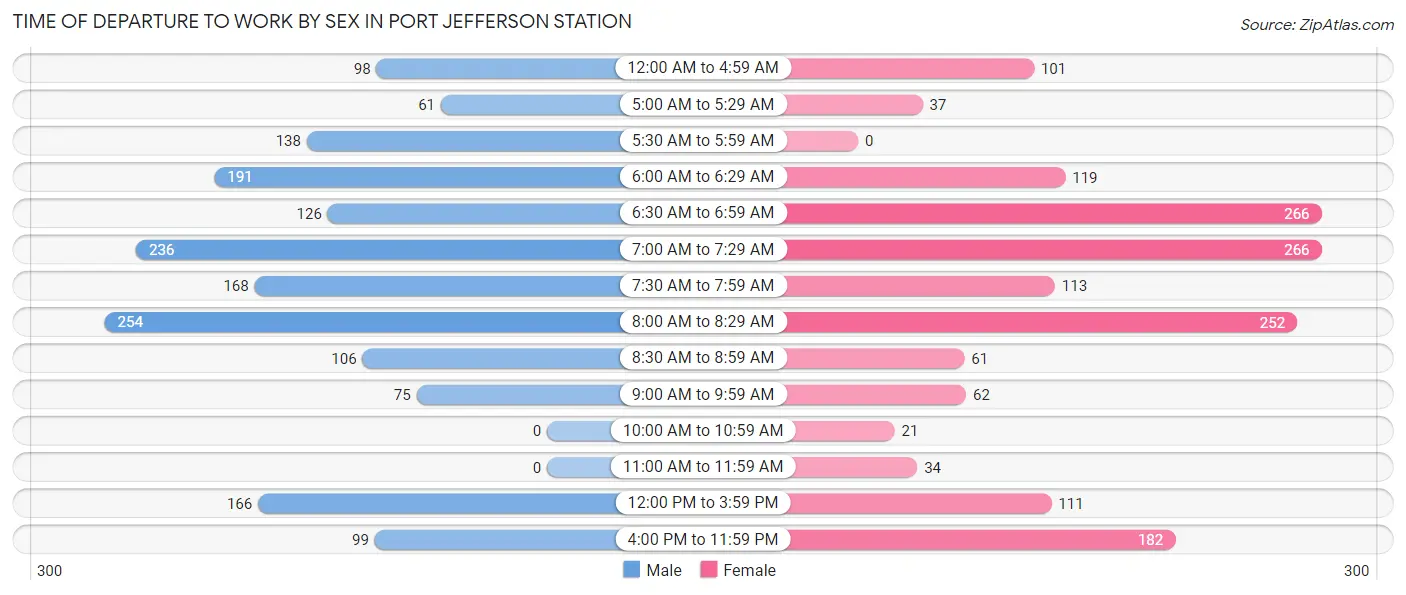
| Time of Departure | Male | Female |
| 12:00 AM to 4:59 AM | 98 (5.7%) | 101 (6.2%) |
| 5:00 AM to 5:29 AM | 61 (3.5%) | 37 (2.3%) |
| 5:30 AM to 5:59 AM | 138 (8.0%) | 0 (0.0%) |
| 6:00 AM to 6:29 AM | 191 (11.1%) | 119 (7.3%) |
| 6:30 AM to 6:59 AM | 126 (7.3%) | 266 (16.4%) |
| 7:00 AM to 7:29 AM | 236 (13.7%) | 266 (16.4%) |
| 7:30 AM to 7:59 AM | 168 (9.8%) | 113 (7.0%) |
| 8:00 AM to 8:29 AM | 254 (14.8%) | 252 (15.5%) |
| 8:30 AM to 8:59 AM | 106 (6.2%) | 61 (3.7%) |
| 9:00 AM to 9:59 AM | 75 (4.4%) | 62 (3.8%) |
| 10:00 AM to 10:59 AM | 0 (0.0%) | 21 (1.3%) |
| 11:00 AM to 11:59 AM | 0 (0.0%) | 34 (2.1%) |
| 12:00 PM to 3:59 PM | 166 (9.7%) | 111 (6.8%) |
| 4:00 PM to 11:59 PM | 99 (5.8%) | 182 (11.2%) |
| Total | 1,718 (100.0%) | 1,625 (100.0%) |
Housing Occupancy in Port Jefferson Station
Occupancy by Ownership in Port Jefferson Station
Of the total 2,669 dwellings in Port Jefferson Station, owner-occupied units account for 2,064 (77.3%), while renter-occupied units make up 605 (22.7%).
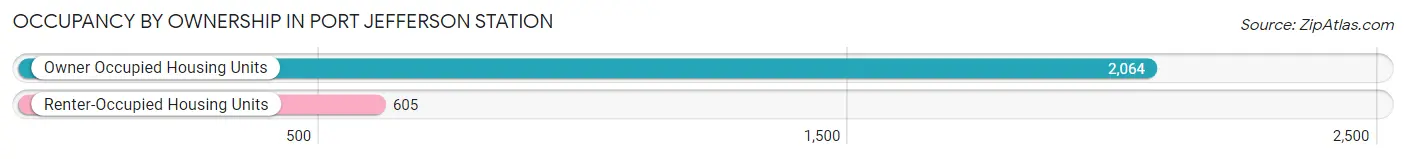
| Occupancy | # Housing Units | % Housing Units |
| Owner Occupied Housing Units | 2,064 | 77.3% |
| Renter-Occupied Housing Units | 605 | 22.7% |
| Total Occupied Housing Units | 2,669 | 100.0% |
Occupancy by Household Size in Port Jefferson Station
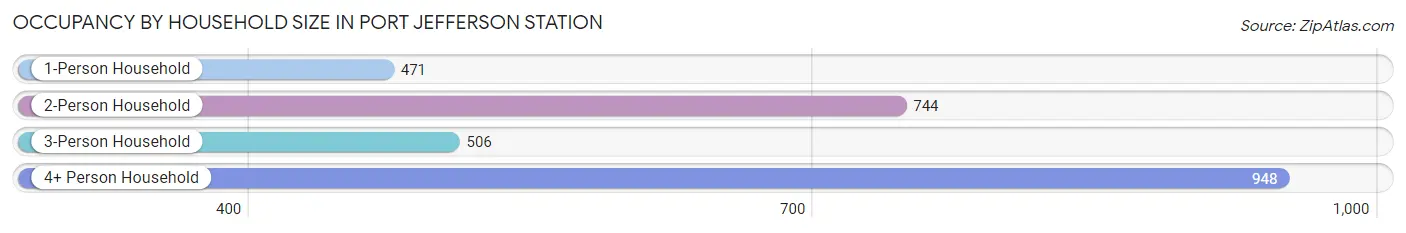
| Household Size | # Housing Units | % Housing Units |
| 1-Person Household | 471 | 17.6% |
| 2-Person Household | 744 | 27.9% |
| 3-Person Household | 506 | 19.0% |
| 4+ Person Household | 948 | 35.5% |
| Total Housing Units | 2,669 | 100.0% |
Occupancy by Ownership by Household Size in Port Jefferson Station
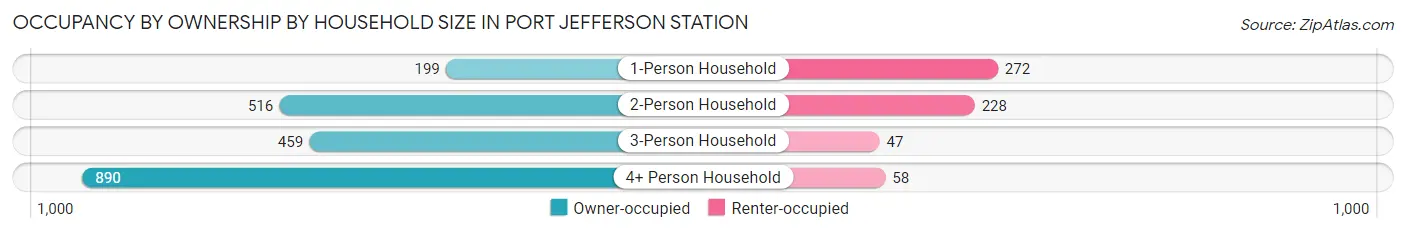
| Household Size | Owner-occupied | Renter-occupied |
| 1-Person Household | 199 (42.2%) | 272 (57.8%) |
| 2-Person Household | 516 (69.4%) | 228 (30.6%) |
| 3-Person Household | 459 (90.7%) | 47 (9.3%) |
| 4+ Person Household | 890 (93.9%) | 58 (6.1%) |
| Total Housing Units | 2,064 (77.3%) | 605 (22.7%) |
Occupancy by Educational Attainment in Port Jefferson Station
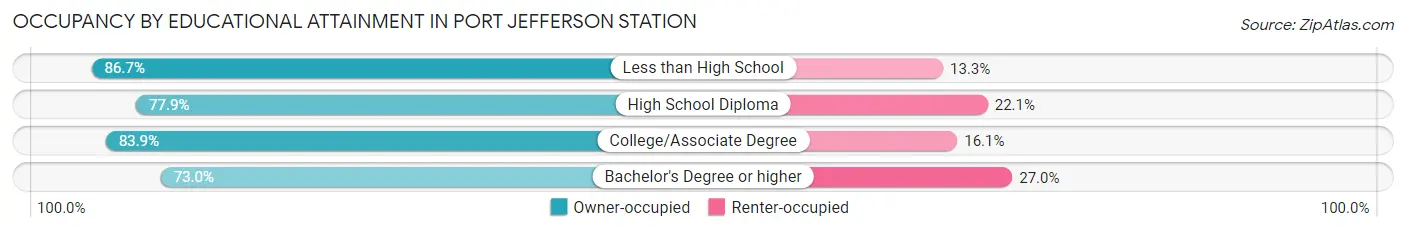
| Household Size | Owner-occupied | Renter-occupied |
| Less than High School | 85 (86.7%) | 13 (13.3%) |
| High School Diploma | 570 (77.9%) | 162 (22.1%) |
| College/Associate Degree | 511 (83.9%) | 98 (16.1%) |
| Bachelor's Degree or higher | 898 (73.0%) | 332 (27.0%) |
Occupancy by Age of Householder in Port Jefferson Station
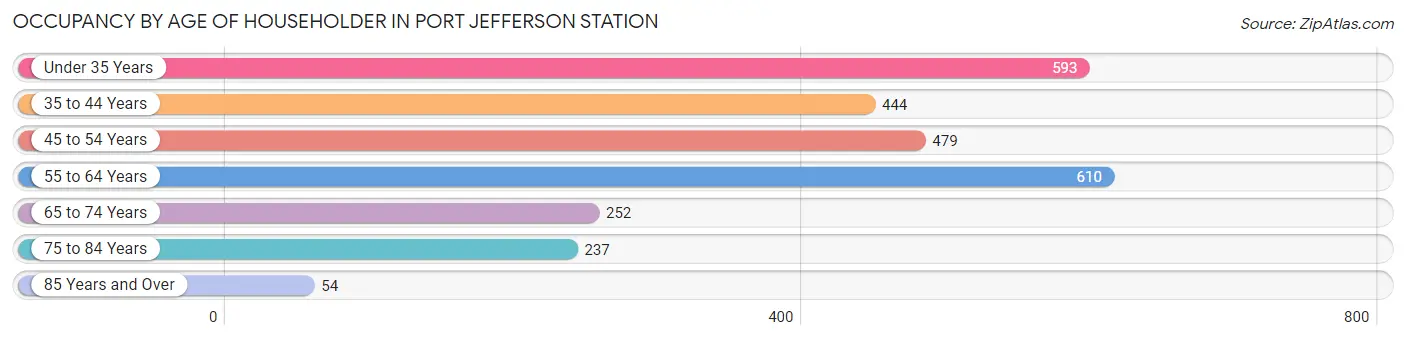
| Age Bracket | # Households | % Households |
| Under 35 Years | 593 | 22.2% |
| 35 to 44 Years | 444 | 16.6% |
| 45 to 54 Years | 479 | 17.9% |
| 55 to 64 Years | 610 | 22.9% |
| 65 to 74 Years | 252 | 9.4% |
| 75 to 84 Years | 237 | 8.9% |
| 85 Years and Over | 54 | 2.0% |
| Total | 2,669 | 100.0% |
Housing Finances in Port Jefferson Station
Median Income by Occupancy in Port Jefferson Station
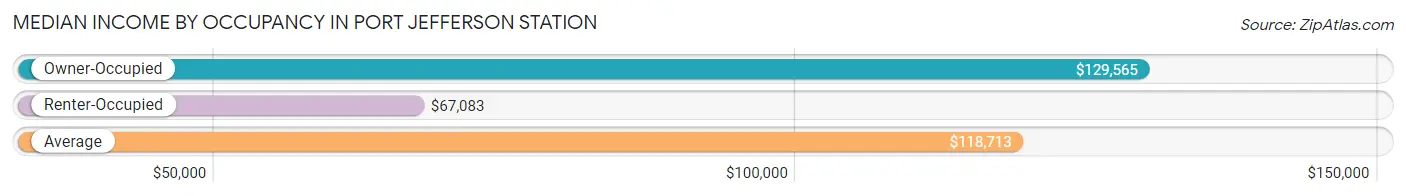
| Occupancy Type | # Households | Median Income |
| Owner-Occupied | 2,064 (77.3%) | $129,565 |
| Renter-Occupied | 605 (22.7%) | $67,083 |
| Average | 2,669 (100.0%) | $118,713 |
Occupancy by Householder Income Bracket in Port Jefferson Station
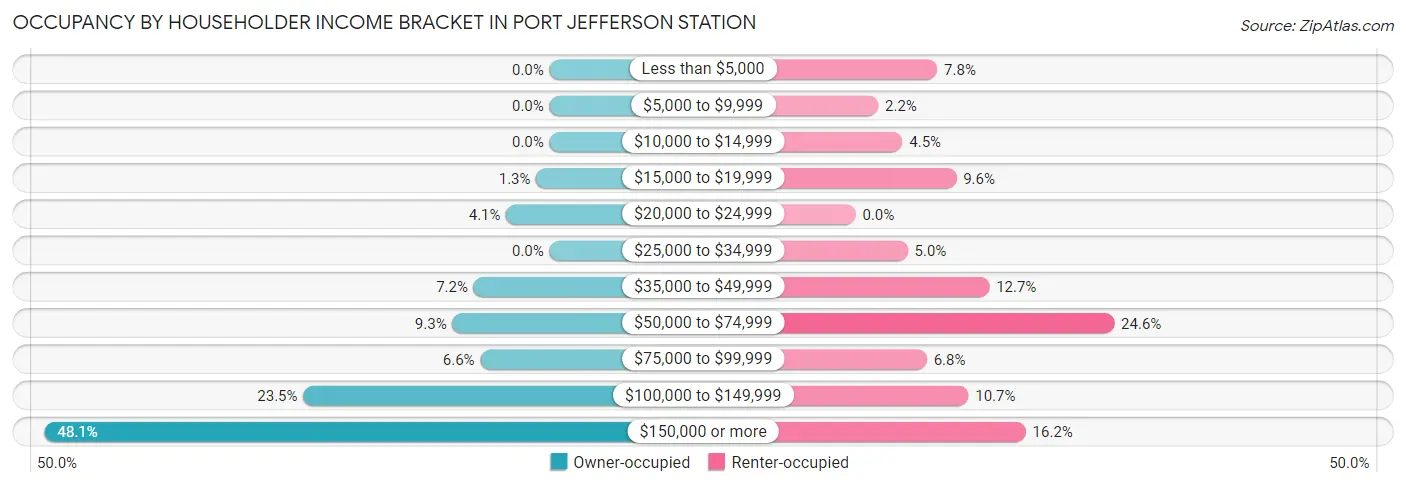
| Income Bracket | Owner-occupied | Renter-occupied |
| Less than $5,000 | 0 (0.0%) | 47 (7.8%) |
| $5,000 to $9,999 | 0 (0.0%) | 13 (2.1%) |
| $10,000 to $14,999 | 0 (0.0%) | 27 (4.5%) |
| $15,000 to $19,999 | 26 (1.3%) | 58 (9.6%) |
| $20,000 to $24,999 | 85 (4.1%) | 0 (0.0%) |
| $25,000 to $34,999 | 0 (0.0%) | 30 (5.0%) |
| $35,000 to $49,999 | 149 (7.2%) | 77 (12.7%) |
| $50,000 to $74,999 | 191 (9.2%) | 149 (24.6%) |
| $75,000 to $99,999 | 136 (6.6%) | 41 (6.8%) |
| $100,000 to $149,999 | 484 (23.4%) | 65 (10.7%) |
| $150,000 or more | 993 (48.1%) | 98 (16.2%) |
| Total | 2,064 (100.0%) | 605 (100.0%) |
Monthly Housing Cost Tiers in Port Jefferson Station
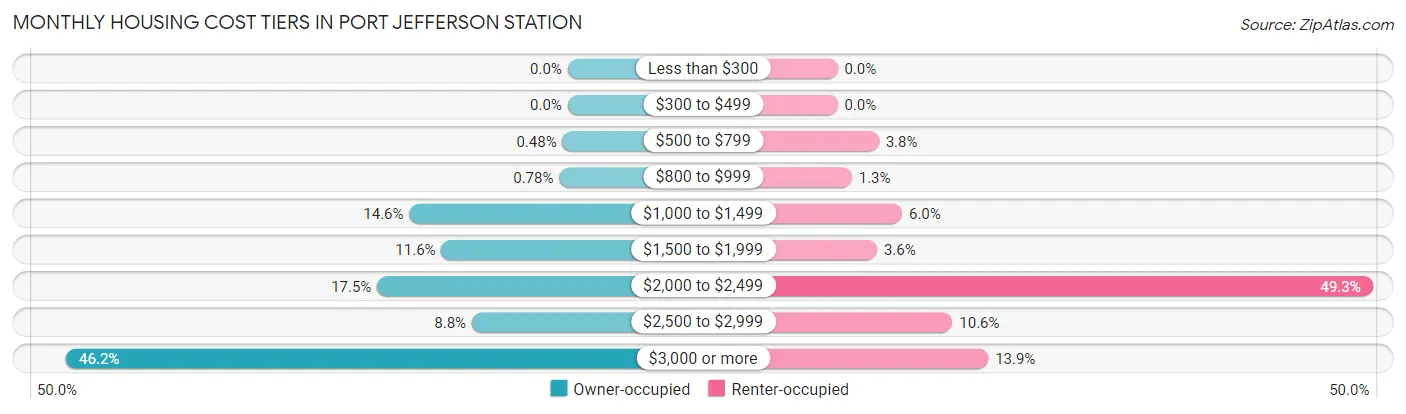
| Monthly Cost | Owner-occupied | Renter-occupied |
| Less than $300 | 0 (0.0%) | 0 (0.0%) |
| $300 to $499 | 0 (0.0%) | 0 (0.0%) |
| $500 to $799 | 10 (0.5%) | 23 (3.8%) |
| $800 to $999 | 16 (0.8%) | 8 (1.3%) |
| $1,000 to $1,499 | 301 (14.6%) | 36 (5.9%) |
| $1,500 to $1,999 | 240 (11.6%) | 22 (3.6%) |
| $2,000 to $2,499 | 362 (17.5%) | 298 (49.3%) |
| $2,500 to $2,999 | 182 (8.8%) | 64 (10.6%) |
| $3,000 or more | 953 (46.2%) | 84 (13.9%) |
| Total | 2,064 (100.0%) | 605 (100.0%) |
Physical Housing Characteristics in Port Jefferson Station
Housing Structures in Port Jefferson Station
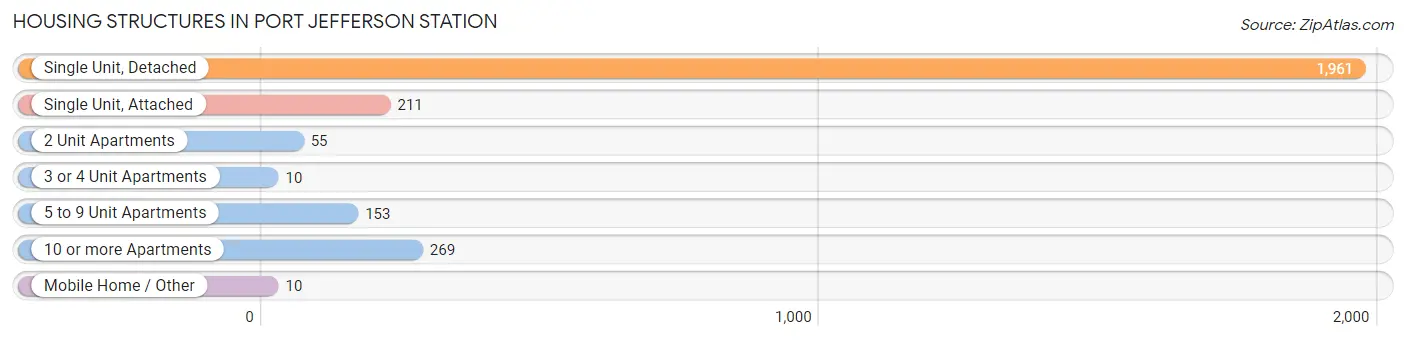
| Structure Type | # Housing Units | % Housing Units |
| Single Unit, Detached | 1,961 | 73.5% |
| Single Unit, Attached | 211 | 7.9% |
| 2 Unit Apartments | 55 | 2.1% |
| 3 or 4 Unit Apartments | 10 | 0.4% |
| 5 to 9 Unit Apartments | 153 | 5.7% |
| 10 or more Apartments | 269 | 10.1% |
| Mobile Home / Other | 10 | 0.4% |
| Total | 2,669 | 100.0% |
Housing Structures by Occupancy in Port Jefferson Station
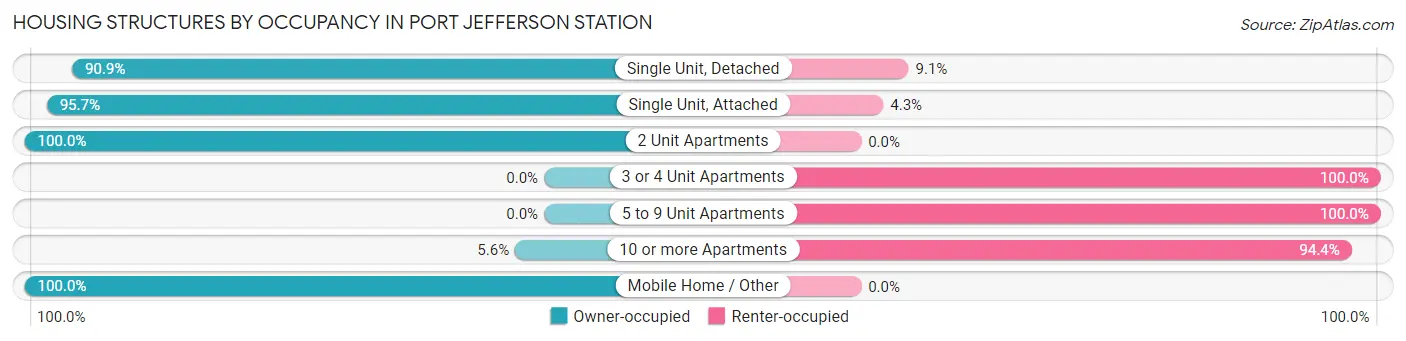
| Structure Type | Owner-occupied | Renter-occupied |
| Single Unit, Detached | 1,782 (90.9%) | 179 (9.1%) |
| Single Unit, Attached | 202 (95.7%) | 9 (4.3%) |
| 2 Unit Apartments | 55 (100.0%) | 0 (0.0%) |
| 3 or 4 Unit Apartments | 0 (0.0%) | 10 (100.0%) |
| 5 to 9 Unit Apartments | 0 (0.0%) | 153 (100.0%) |
| 10 or more Apartments | 15 (5.6%) | 254 (94.4%) |
| Mobile Home / Other | 10 (100.0%) | 0 (0.0%) |
| Total | 2,064 (77.3%) | 605 (22.7%) |
Housing Structures by Number of Rooms in Port Jefferson Station
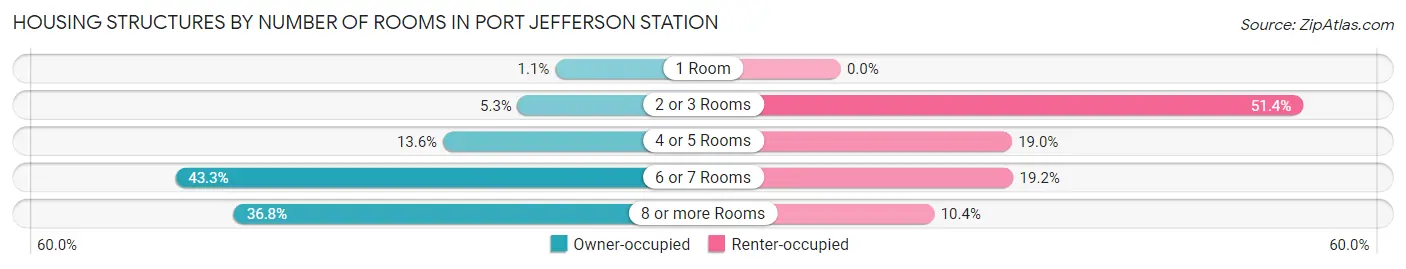
| Number of Rooms | Owner-occupied | Renter-occupied |
| 1 Room | 23 (1.1%) | 0 (0.0%) |
| 2 or 3 Rooms | 109 (5.3%) | 311 (51.4%) |
| 4 or 5 Rooms | 280 (13.6%) | 115 (19.0%) |
| 6 or 7 Rooms | 893 (43.3%) | 116 (19.2%) |
| 8 or more Rooms | 759 (36.8%) | 63 (10.4%) |
| Total | 2,064 (100.0%) | 605 (100.0%) |
Housing Structure by Heating Type in Port Jefferson Station
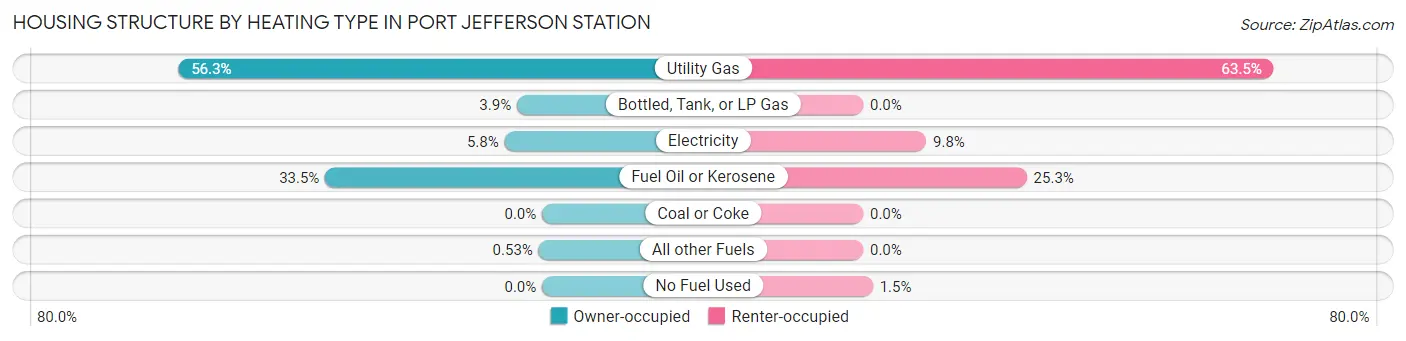
| Heating Type | Owner-occupied | Renter-occupied |
| Utility Gas | 1,161 (56.2%) | 384 (63.5%) |
| Bottled, Tank, or LP Gas | 80 (3.9%) | 0 (0.0%) |
| Electricity | 120 (5.8%) | 59 (9.8%) |
| Fuel Oil or Kerosene | 692 (33.5%) | 153 (25.3%) |
| Coal or Coke | 0 (0.0%) | 0 (0.0%) |
| All other Fuels | 11 (0.5%) | 0 (0.0%) |
| No Fuel Used | 0 (0.0%) | 9 (1.5%) |
| Total | 2,064 (100.0%) | 605 (100.0%) |
Household Vehicle Usage in Port Jefferson Station
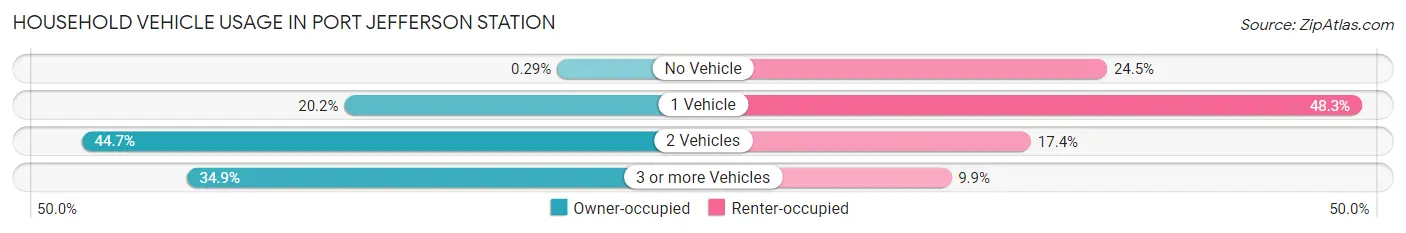
| Vehicles per Household | Owner-occupied | Renter-occupied |
| No Vehicle | 6 (0.3%) | 148 (24.5%) |
| 1 Vehicle | 416 (20.2%) | 292 (48.3%) |
| 2 Vehicles | 922 (44.7%) | 105 (17.4%) |
| 3 or more Vehicles | 720 (34.9%) | 60 (9.9%) |
| Total | 2,064 (100.0%) | 605 (100.0%) |
Real Estate & Mortgages in Port Jefferson Station
Real Estate and Mortgage Overview in Port Jefferson Station
| Characteristic | Without Mortgage | With Mortgage |
| Housing Units | 559 | 1,505 |
| Median Property Value | $447,500 | $443,500 |
| Median Household Income | $158,319 | $704 |
| Monthly Housing Costs | $1,476 | $953 |
| Real Estate Taxes | $10,001 | $0 |
Property Value by Mortgage Status in Port Jefferson Station
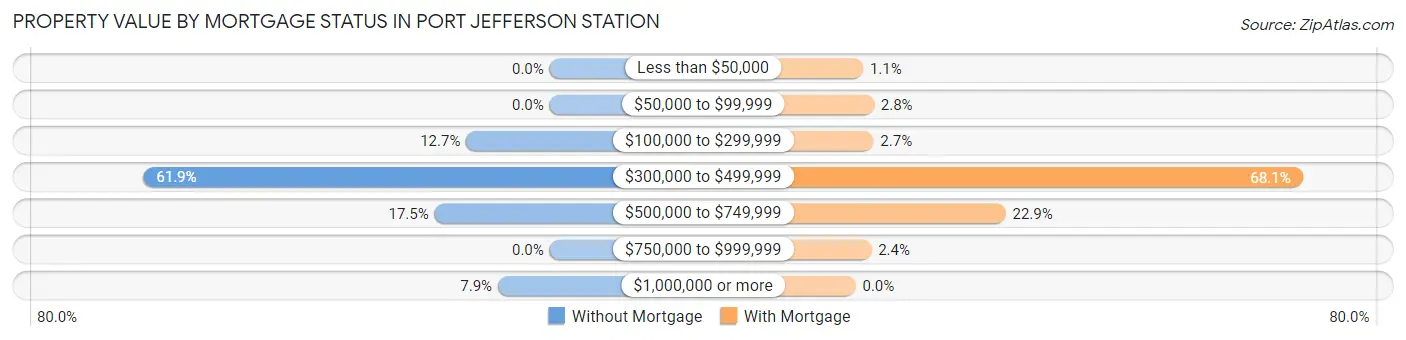
| Property Value | Without Mortgage | With Mortgage |
| Less than $50,000 | 0 (0.0%) | 17 (1.1%) |
| $50,000 to $99,999 | 0 (0.0%) | 42 (2.8%) |
| $100,000 to $299,999 | 71 (12.7%) | 41 (2.7%) |
| $300,000 to $499,999 | 346 (61.9%) | 1,025 (68.1%) |
| $500,000 to $749,999 | 98 (17.5%) | 344 (22.9%) |
| $750,000 to $999,999 | 0 (0.0%) | 36 (2.4%) |
| $1,000,000 or more | 44 (7.9%) | 0 (0.0%) |
| Total | 559 (100.0%) | 1,505 (100.0%) |
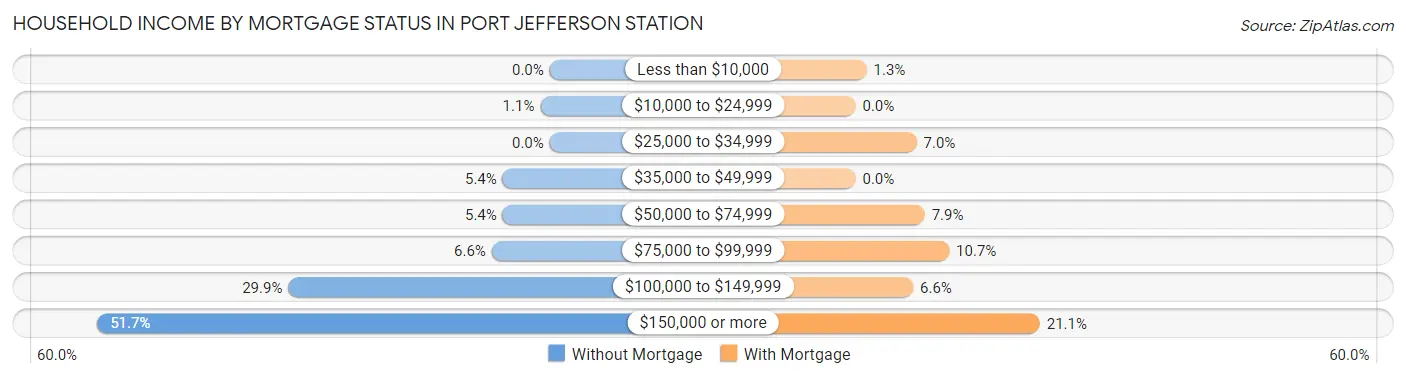
Household Income by Mortgage Status in Port Jefferson Station
| Household Income | Without Mortgage | With Mortgage |
| Less than $10,000 | 0 (0.0%) | 19 (1.3%) |
| $10,000 to $24,999 | 6 (1.1%) | 0 (0.0%) |
| $25,000 to $34,999 | 0 (0.0%) | 105 (7.0%) |
| $35,000 to $49,999 | 30 (5.4%) | 0 (0.0%) |
| $50,000 to $74,999 | 30 (5.4%) | 119 (7.9%) |
| $75,000 to $99,999 | 37 (6.6%) | 161 (10.7%) |
| $100,000 to $149,999 | 167 (29.9%) | 99 (6.6%) |
| $150,000 or more | 289 (51.7%) | 317 (21.1%) |
| Total | 559 (100.0%) | 1,505 (100.0%) |
Property Value to Household Income Ratio in Port Jefferson Station
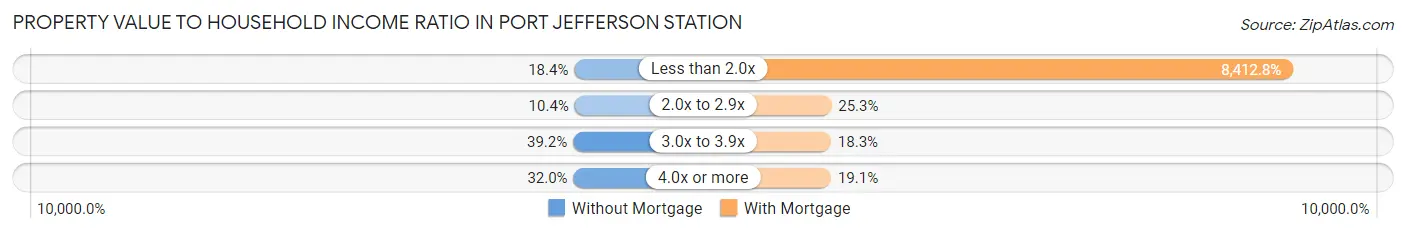
| Value-to-Income Ratio | Without Mortgage | With Mortgage |
| Less than 2.0x | 103 (18.4%) | 126,612 (8,412.8%) |
| 2.0x to 2.9x | 58 (10.4%) | 380 (25.3%) |
| 3.0x to 3.9x | 219 (39.2%) | 275 (18.3%) |
| 4.0x or more | 179 (32.0%) | 287 (19.1%) |
| Total | 559 (100.0%) | 1,505 (100.0%) |
Real Estate Taxes by Mortgage Status in Port Jefferson Station
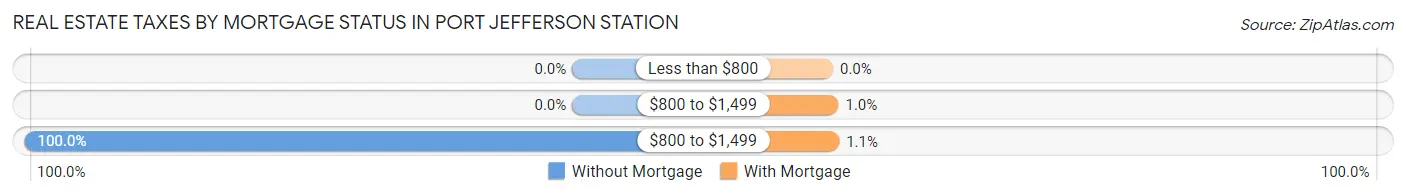
| Property Taxes | Without Mortgage | With Mortgage |
| Less than $800 | 0 (0.0%) | 0 (0.0%) |
| $800 to $1,499 | 0 (0.0%) | 15 (1.0%) |
| $800 to $1,499 | 559 (100.0%) | 17 (1.1%) |
| Total | 559 (100.0%) | 1,505 (100.0%) |
Health & Disability in Port Jefferson Station
Health Insurance Coverage by Age in Port Jefferson Station
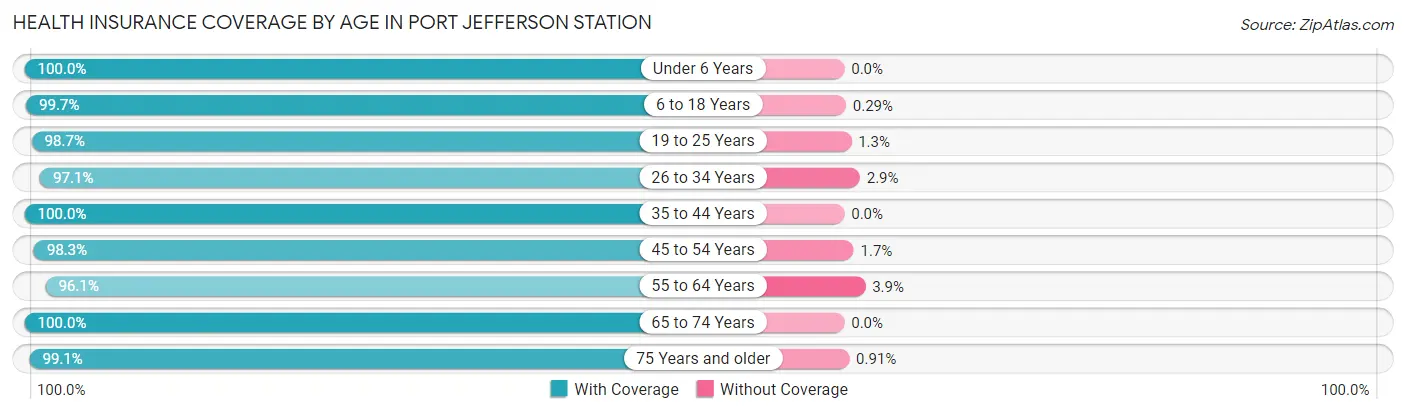
| Age Bracket | With Coverage | Without Coverage |
| Under 6 Years | 585 (100.0%) | 0 (0.0%) |
| 6 to 18 Years | 1,364 (99.7%) | 4 (0.3%) |
| 19 to 25 Years | 766 (98.7%) | 10 (1.3%) |
| 26 to 34 Years | 875 (97.1%) | 26 (2.9%) |
| 35 to 44 Years | 995 (100.0%) | 0 (0.0%) |
| 45 to 54 Years | 908 (98.3%) | 16 (1.7%) |
| 55 to 64 Years | 1,305 (96.1%) | 53 (3.9%) |
| 65 to 74 Years | 515 (100.0%) | 0 (0.0%) |
| 75 Years and older | 547 (99.1%) | 5 (0.9%) |
| Total | 7,860 (98.6%) | 114 (1.4%) |
Health Insurance Coverage by Citizenship Status in Port Jefferson Station
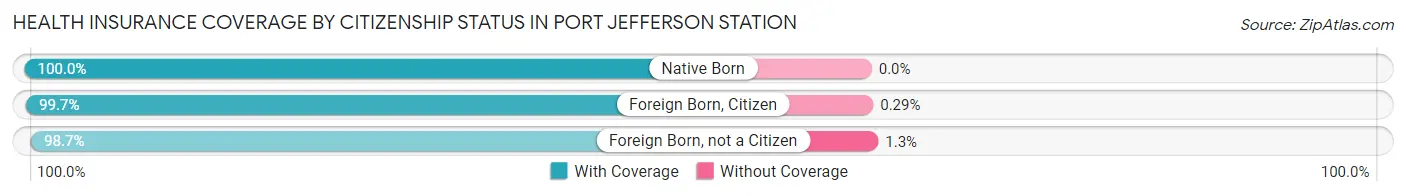
| Citizenship Status | With Coverage | Without Coverage |
| Native Born | 585 (100.0%) | 0 (0.0%) |
| Foreign Born, Citizen | 1,364 (99.7%) | 4 (0.3%) |
| Foreign Born, not a Citizen | 766 (98.7%) | 10 (1.3%) |
Health Insurance Coverage by Household Income in Port Jefferson Station
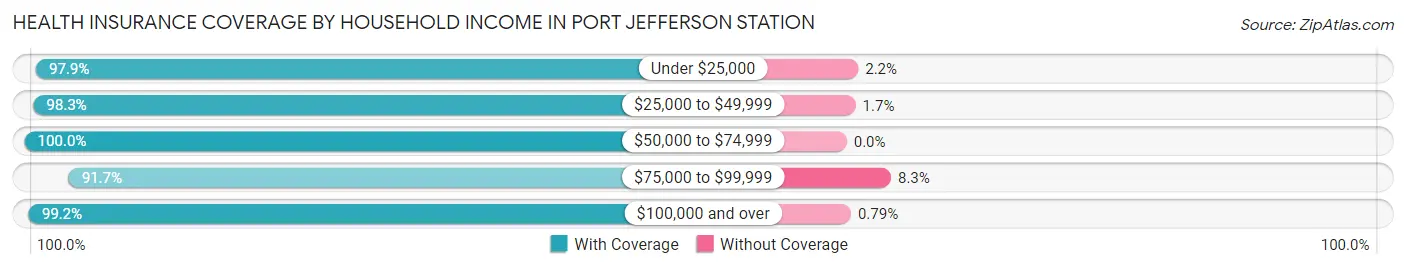
| Household Income | With Coverage | Without Coverage |
| Under $25,000 | 592 (97.9%) | 13 (2.1%) |
| $25,000 to $49,999 | 591 (98.3%) | 10 (1.7%) |
| $50,000 to $74,999 | 964 (100.0%) | 0 (0.0%) |
| $75,000 to $99,999 | 498 (91.7%) | 45 (8.3%) |
| $100,000 and over | 5,123 (99.2%) | 41 (0.8%) |
Public vs Private Health Insurance Coverage by Age in Port Jefferson Station
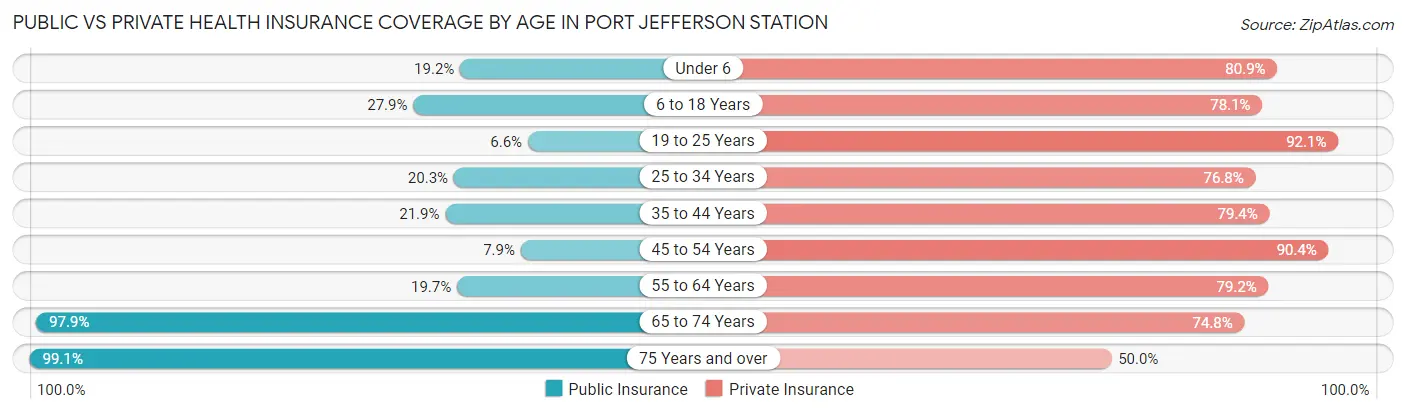
| Age Bracket | Public Insurance | Private Insurance |
| Under 6 | 112 (19.2%) | 473 (80.8%) |
| 6 to 18 Years | 381 (27.9%) | 1,068 (78.1%) |
| 19 to 25 Years | 51 (6.6%) | 715 (92.1%) |
| 25 to 34 Years | 183 (20.3%) | 692 (76.8%) |
| 35 to 44 Years | 218 (21.9%) | 790 (79.4%) |
| 45 to 54 Years | 73 (7.9%) | 835 (90.4%) |
| 55 to 64 Years | 268 (19.7%) | 1,076 (79.2%) |
| 65 to 74 Years | 504 (97.9%) | 385 (74.8%) |
| 75 Years and over | 547 (99.1%) | 276 (50.0%) |
| Total | 2,337 (29.3%) | 6,310 (79.1%) |
Disability Status by Sex by Age in Port Jefferson Station
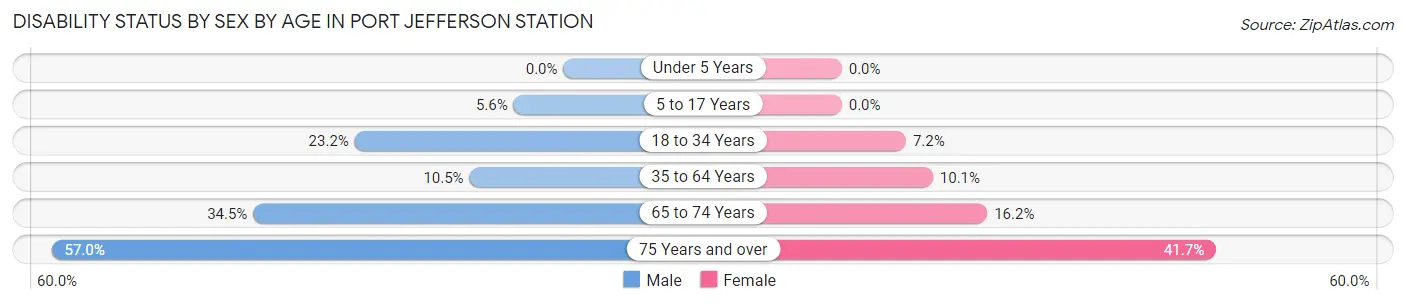
| Age Bracket | Male | Female |
| Under 5 Years | 0 (0.0%) | 0 (0.0%) |
| 5 to 17 Years | 40 (5.6%) | 0 (0.0%) |
| 18 to 34 Years | 152 (23.2%) | 85 (7.1%) |
| 35 to 64 Years | 183 (10.5%) | 155 (10.1%) |
| 65 to 74 Years | 67 (34.5%) | 52 (16.2%) |
| 75 Years and over | 171 (57.0%) | 105 (41.7%) |
Disability Class by Sex by Age in Port Jefferson Station
Disability Class: Hearing Difficulty
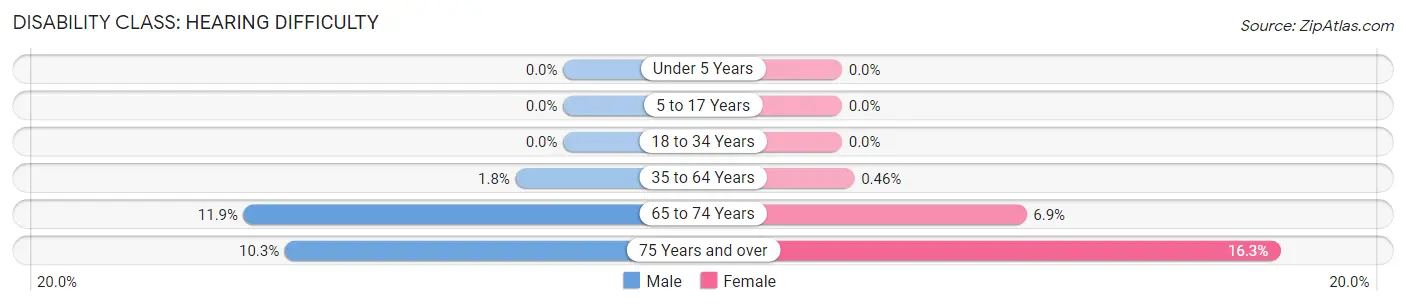
| Age Bracket | Male | Female |
| Under 5 Years | 0 (0.0%) | 0 (0.0%) |
| 5 to 17 Years | 0 (0.0%) | 0 (0.0%) |
| 18 to 34 Years | 0 (0.0%) | 0 (0.0%) |
| 35 to 64 Years | 31 (1.8%) | 7 (0.5%) |
| 65 to 74 Years | 23 (11.9%) | 22 (6.9%) |
| 75 Years and over | 31 (10.3%) | 41 (16.3%) |
Disability Class: Vision Difficulty
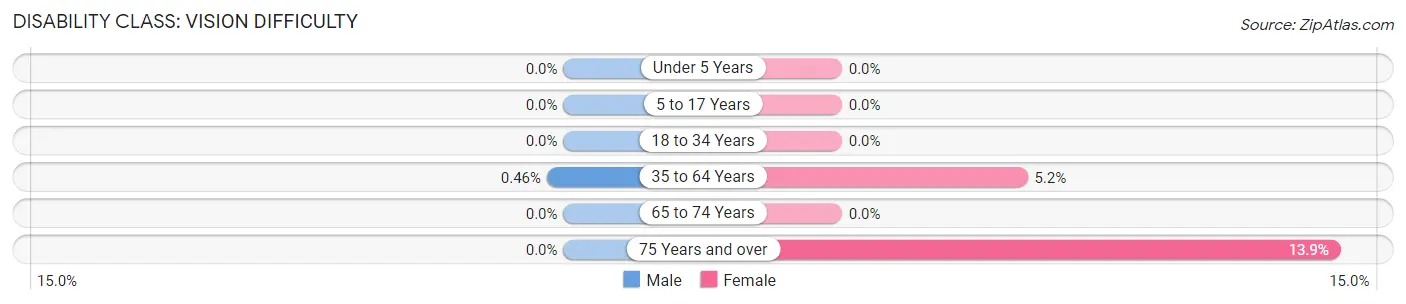
| Age Bracket | Male | Female |
| Under 5 Years | 0 (0.0%) | 0 (0.0%) |
| 5 to 17 Years | 0 (0.0%) | 0 (0.0%) |
| 18 to 34 Years | 0 (0.0%) | 0 (0.0%) |
| 35 to 64 Years | 8 (0.5%) | 79 (5.2%) |
| 65 to 74 Years | 0 (0.0%) | 0 (0.0%) |
| 75 Years and over | 0 (0.0%) | 35 (13.9%) |
Disability Class: Cognitive Difficulty
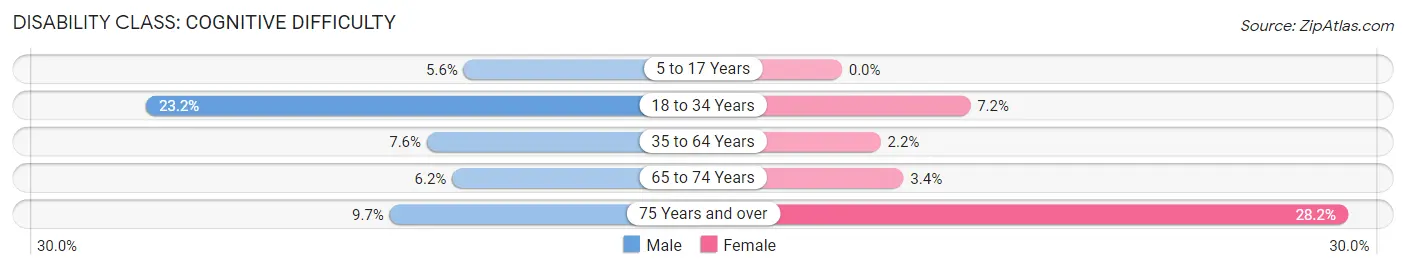
| Age Bracket | Male | Female |
| 5 to 17 Years | 40 (5.6%) | 0 (0.0%) |
| 18 to 34 Years | 152 (23.2%) | 85 (7.1%) |
| 35 to 64 Years | 133 (7.6%) | 33 (2.2%) |
| 65 to 74 Years | 12 (6.2%) | 11 (3.4%) |
| 75 Years and over | 29 (9.7%) | 71 (28.2%) |
Disability Class: Ambulatory Difficulty
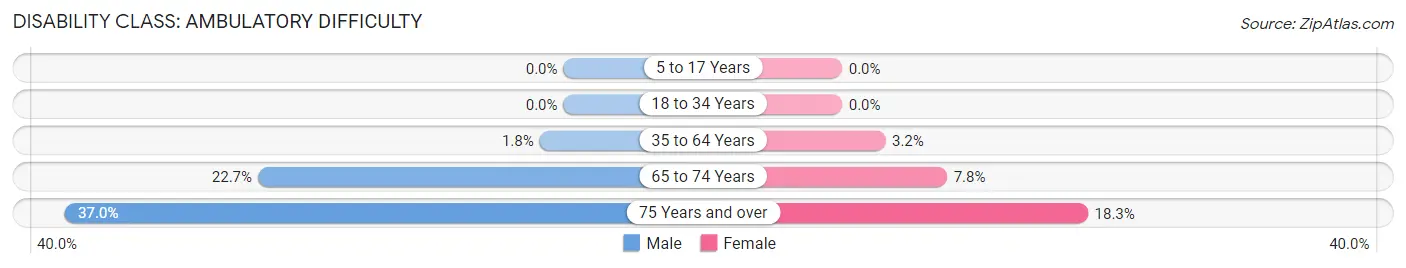
| Age Bracket | Male | Female |
| 5 to 17 Years | 0 (0.0%) | 0 (0.0%) |
| 18 to 34 Years | 0 (0.0%) | 0 (0.0%) |
| 35 to 64 Years | 31 (1.8%) | 49 (3.2%) |
| 65 to 74 Years | 44 (22.7%) | 25 (7.8%) |
| 75 Years and over | 111 (37.0%) | 46 (18.2%) |
Disability Class: Self-Care Difficulty
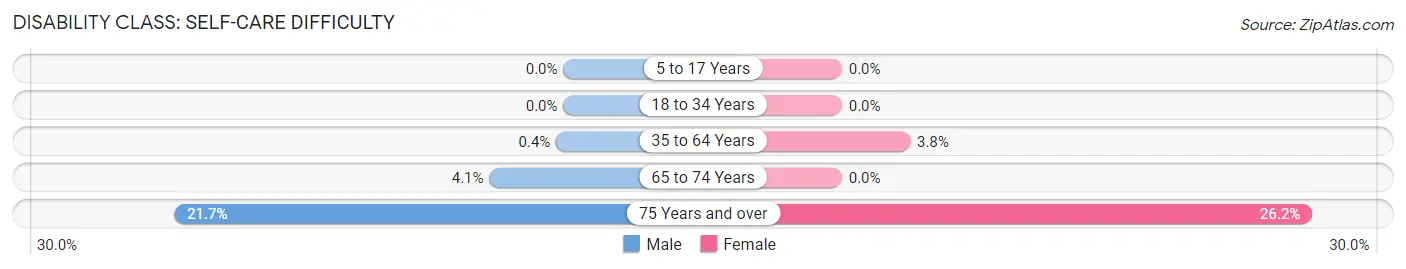
| Age Bracket | Male | Female |
| 5 to 17 Years | 0 (0.0%) | 0 (0.0%) |
| 18 to 34 Years | 0 (0.0%) | 0 (0.0%) |
| 35 to 64 Years | 7 (0.4%) | 58 (3.8%) |
| 65 to 74 Years | 8 (4.1%) | 0 (0.0%) |
| 75 Years and over | 65 (21.7%) | 66 (26.2%) |
Technology Access in Port Jefferson Station
Computing Device Access in Port Jefferson Station
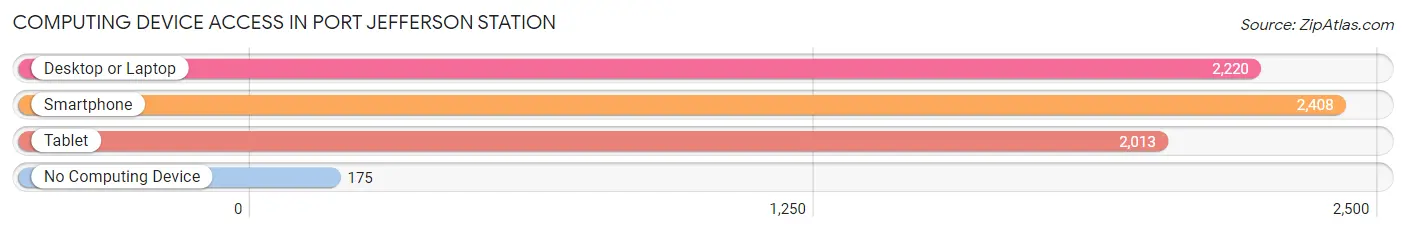
| Device Type | # Households | % Households |
| Desktop or Laptop | 2,220 | 83.2% |
| Smartphone | 2,408 | 90.2% |
| Tablet | 2,013 | 75.4% |
| No Computing Device | 175 | 6.6% |
| Total | 2,669 | 100.0% |
Internet Access in Port Jefferson Station
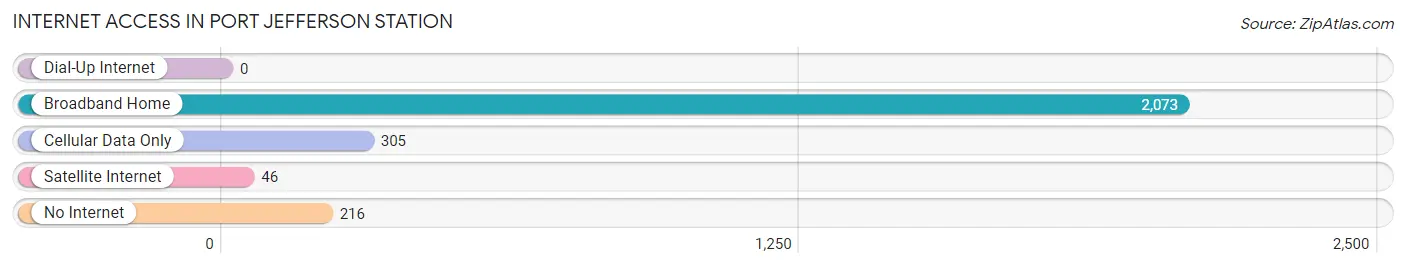
| Internet Type | # Households | % Households |
| Dial-Up Internet | 0 | 0.0% |
| Broadband Home | 2,073 | 77.7% |
| Cellular Data Only | 305 | 11.4% |
| Satellite Internet | 46 | 1.7% |
| No Internet | 216 | 8.1% |
| Total | 2,669 | 100.0% |
Port Jefferson Station Summary
Introduction
Port Jefferson Station is a hamlet located in the Town of Brookhaven in Suffolk County, New York. It is situated on the north shore of Long Island, approximately 60 miles east of New York City. The hamlet is part of the Greater Port Jefferson area, which includes the neighboring hamlet of Port Jefferson. The hamlet has a population of approximately 8,000 people and is a popular destination for tourists and commuters alike.
History
The area that is now Port Jefferson Station was originally inhabited by the Setalcott Indians, a branch of the Algonquin tribe. The first European settlers arrived in the area in the late 1600s, and the hamlet was officially established in 1793. The hamlet was originally known as Comsewogue, after the local Native American tribe.
In 1873, the Long Island Rail Road (LIRR) opened a station in the hamlet, which was then renamed Port Jefferson Station. The station was a major factor in the growth of the hamlet, as it provided easy access to New York City and other parts of Long Island.
In the early 1900s, the hamlet experienced a period of rapid growth and development. The population increased from 1,000 in 1900 to 4,000 in 1920. During this time, the hamlet was home to several factories, including a paper mill, a brickyard, and a canning factory.
Geography
Port Jefferson Station is located on the north shore of Long Island, approximately 60 miles east of New York City. The hamlet is situated on the north side of the Nissequogue River, which flows into the Long Island Sound. The hamlet is bordered by the hamlet of Port Jefferson to the east, the hamlet of Terryville to the west, and the hamlet of Mount Sinai to the south.
The hamlet has a total area of 2.2 square miles, all of which is land. The terrain is mostly flat, with some rolling hills in the western part of the hamlet. The highest point in the hamlet is located at the intersection of Old Town Road and Route 112, which is approximately 100 feet above sea level.
Economy
Port Jefferson Station is primarily a residential community, with a few small businesses located in the hamlet. The largest employer in the hamlet is the Long Island Rail Road, which employs approximately 1,000 people. Other major employers include the Port Jefferson Free Library, the Port Jefferson School District, and the Port Jefferson Village Hall.
The hamlet also has a thriving tourism industry, with many visitors coming to the area to enjoy the beaches, parks, and other attractions. The hamlet is home to several popular restaurants, bars, and shops, as well as a number of art galleries and museums.
Demographics
As of the 2010 census, the population of Port Jefferson Station was 8,068. The racial makeup of the hamlet was 87.3% White, 5.2% African American, 0.7% Native American, 2.2% Asian, 0.1% Pacific Islander, and 4.5% from other races. Hispanic or Latino of any race were 8.3% of the population.
The median household income in the hamlet was $76,945, and the median family income was $90,917. The per capita income was $35,945. About 4.3% of families and 5.7% of the population were below the poverty line, including 6.3% of those under age 18 and 4.2% of those age 65 or over.
Conclusion
Port Jefferson Station is a hamlet located in the Town of Brookhaven in Suffolk County, New York. It is situated on the north shore of Long Island, approximately 60 miles east of New York City. The hamlet has a population of approximately 8,000 people and is a popular destination for tourists and commuters alike. The hamlet was originally inhabited by the Setalcott Indians, and was officially established in 1793. The hamlet experienced a period of rapid growth and development in the early 1900s, when the Long Island Rail Road opened a station in the hamlet. The hamlet is primarily a residential community, with a few small businesses located in the hamlet. The largest employer in the hamlet is the Long Island Rail Road, which employs approximately 1,000 people. The hamlet also has a thriving tourism industry, with many visitors coming to the area to enjoy the beaches, parks, and other attractions. As of the 2010 census, the population of Port Jefferson Station was 8,068. The racial makeup of the hamlet was 87.3% White, 5.2% African American, 0.7% Native American, 2.2% Asian, 0.1% Pacific Islander, and 4.5% from other races. The median household income in the hamlet was $76,945, and the median family income was $90,917.
Common Questions
What is Per Capita Income in Port Jefferson Station?
Per Capita income in Port Jefferson Station is $49,815.
What is the Median Family Income in Port Jefferson Station?
Median Family Income in Port Jefferson Station is $128,977.
What is the Median Household income in Port Jefferson Station?
Median Household Income in Port Jefferson Station is $118,713.
What is Income or Wage Gap in Port Jefferson Station?
Income or Wage Gap in Port Jefferson Station is 21.5%.
Women in Port Jefferson Station earn 78.5 cents for every dollar earned by a man.
What is Inequality or Gini Index in Port Jefferson Station?
Inequality or Gini Index in Port Jefferson Station is 0.40.
What is the Total Population of Port Jefferson Station?
Total Population of Port Jefferson Station is 7,974.
What is the Total Male Population of Port Jefferson Station?
Total Male Population of Port Jefferson Station is 3,898.
What is the Total Female Population of Port Jefferson Station?
Total Female Population of Port Jefferson Station is 4,076.
What is the Ratio of Males per 100 Females in Port Jefferson Station?
There are 95.63 Males per 100 Females in Port Jefferson Station.
What is the Ratio of Females per 100 Males in Port Jefferson Station?
There are 104.57 Females per 100 Males in Port Jefferson Station.
What is the Median Population Age in Port Jefferson Station?
Median Population Age in Port Jefferson Station is 39.5 Years.
What is the Average Family Size in Port Jefferson Station
Average Family Size in Port Jefferson Station is 3.4 People.
What is the Average Household Size in Port Jefferson Station
Average Household Size in Port Jefferson Station is 3.0 People.
How Large is the Labor Force in Port Jefferson Station?
There are 4,145 People in the Labor Forcein in Port Jefferson Station.
What is the Percentage of People in the Labor Force in Port Jefferson Station?
65.5% of People are in the Labor Force in Port Jefferson Station.
What is the Unemployment Rate in Port Jefferson Station?
Unemployment Rate in Port Jefferson Station is 7.1%.