Ithaca, NY Map & Demographics
Ithaca Map
Ithaca Overview
$28,566
PER CAPITA INCOME
$122,929
AVG FAMILY INCOME
$45,468
AVG HOUSEHOLD INCOME
26.4%
WAGE / INCOME GAP [ % ]
73.6¢/ $1
WAGE / INCOME GAP [ $ ]
0.56
INEQUALITY / GINI INDEX
31,359
TOTAL POPULATION
15,721
MALE POPULATION
15,638
FEMALE POPULATION
100.53
MALES / 100 FEMALES
99.47
FEMALES / 100 MALES
22.8
MEDIAN AGE
2.5
AVG FAMILY SIZE
1.8
AVG HOUSEHOLD SIZE
15,755
LABOR FORCE [ PEOPLE ]
53.7%
PERCENT IN LABOR FORCE
5.9%
UNEMPLOYMENT RATE
Ithaca Area Codes
Income in Ithaca
Income Overview in Ithaca
Per Capita Income in Ithaca is $28,566, while median incomes of families and households are $122,929 and $45,468 respectively.
| Characteristic | Number | Measure |
| Per Capita Income | 31,359 | $28,566 |
| Median Family Income | 3,610 | $122,929 |
| Mean Family Income | 3,610 | $144,470 |
| Median Household Income | 13,233 | $45,468 |
| Mean Household Income | 13,233 | $73,603 |
| Income Deficit | 3,610 | $0 |
| Wage / Income Gap (%) | 31,359 | 26.37% |
| Wage / Income Gap ($) | 31,359 | 73.63¢ per $1 |
| Gini / Inequality Index | 31,359 | 0.56 |
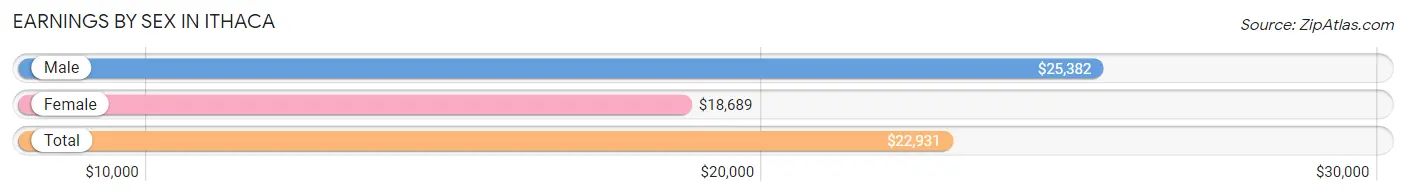
Earnings by Sex in Ithaca
Average Earnings in Ithaca are $22,931, $25,382 for men and $18,689 for women, a difference of 26.4%.
| Sex | Number | Average Earnings |
| Male | 9,889 (51.2%) | $25,382 |
| Female | 9,424 (48.8%) | $18,689 |
| Total | 19,313 (100.0%) | $22,931 |
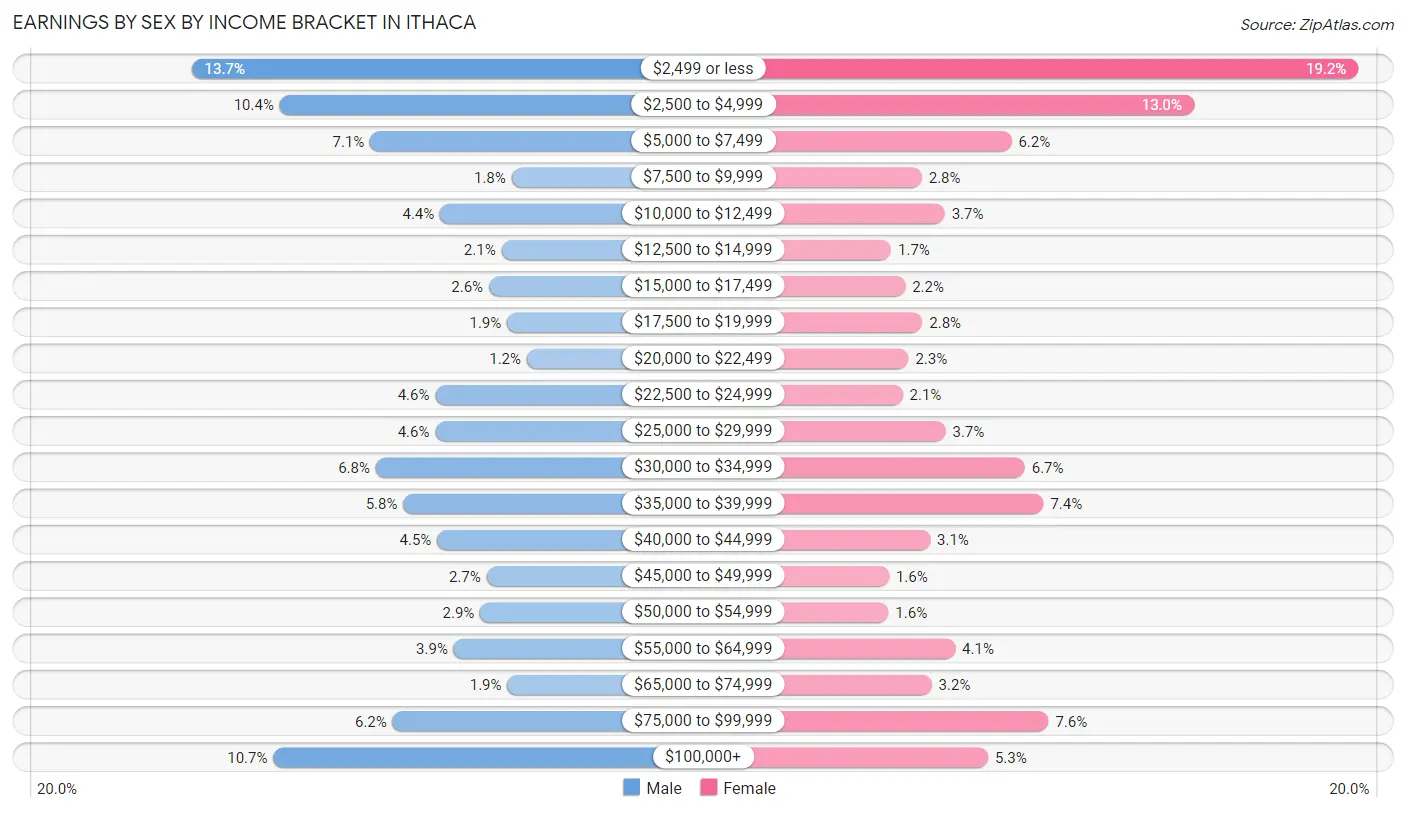
Earnings by Sex by Income Bracket in Ithaca
The most common earnings brackets in Ithaca are $2,499 or less for men (1,359 | 13.7%) and $2,499 or less for women (1,806 | 19.2%).
| Income | Male | Female |
| $2,499 or less | 1,359 (13.7%) | 1,806 (19.2%) |
| $2,500 to $4,999 | 1,032 (10.4%) | 1,225 (13.0%) |
| $5,000 to $7,499 | 697 (7.0%) | 581 (6.2%) |
| $7,500 to $9,999 | 173 (1.8%) | 265 (2.8%) |
| $10,000 to $12,499 | 438 (4.4%) | 346 (3.7%) |
| $12,500 to $14,999 | 211 (2.1%) | 156 (1.7%) |
| $15,000 to $17,499 | 257 (2.6%) | 206 (2.2%) |
| $17,500 to $19,999 | 190 (1.9%) | 267 (2.8%) |
| $20,000 to $22,499 | 117 (1.2%) | 218 (2.3%) |
| $22,500 to $24,999 | 456 (4.6%) | 197 (2.1%) |
| $25,000 to $29,999 | 456 (4.6%) | 349 (3.7%) |
| $30,000 to $34,999 | 676 (6.8%) | 629 (6.7%) |
| $35,000 to $39,999 | 575 (5.8%) | 695 (7.4%) |
| $40,000 to $44,999 | 449 (4.5%) | 294 (3.1%) |
| $45,000 to $49,999 | 266 (2.7%) | 149 (1.6%) |
| $50,000 to $54,999 | 290 (2.9%) | 147 (1.6%) |
| $55,000 to $64,999 | 388 (3.9%) | 383 (4.1%) |
| $65,000 to $74,999 | 189 (1.9%) | 300 (3.2%) |
| $75,000 to $99,999 | 614 (6.2%) | 712 (7.6%) |
| $100,000+ | 1,056 (10.7%) | 499 (5.3%) |
| Total | 9,889 (100.0%) | 9,424 (100.0%) |
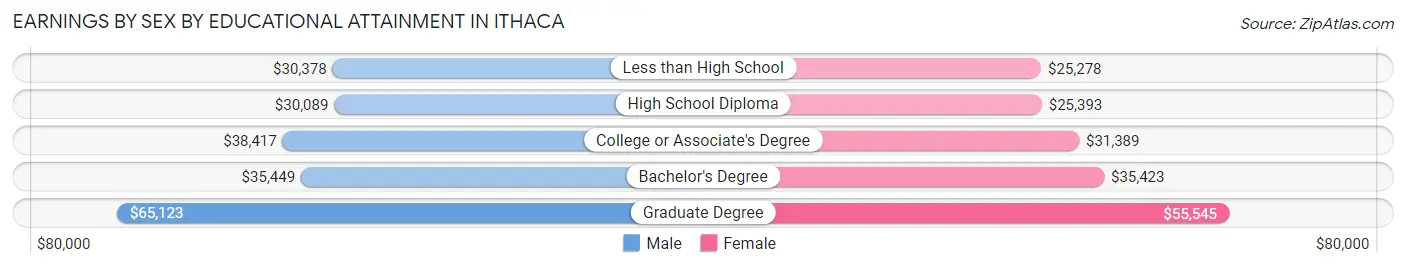
Earnings by Sex by Educational Attainment in Ithaca
Average earnings in Ithaca are $42,873 for men and $38,758 for women, a difference of 9.6%. Men with an educational attainment of graduate degree enjoy the highest average annual earnings of $65,123, while those with high school diploma education earn the least with $30,089. Women with an educational attainment of graduate degree earn the most with the average annual earnings of $55,545, while those with less than high school education have the smallest earnings of $25,278.
| Educational Attainment | Male Income | Female Income |
| Less than High School | $30,378 | $25,278 |
| High School Diploma | $30,089 | $25,393 |
| College or Associate's Degree | $38,417 | $31,389 |
| Bachelor's Degree | $35,449 | $35,423 |
| Graduate Degree | $65,123 | $55,545 |
| Total | $42,873 | $38,758 |
Family Income in Ithaca
Family Income Brackets in Ithaca
According to the Ithaca family income data, there are 816 families falling into the $200,000+ income range, which is the most common income bracket and makes up 22.6% of all families. Conversely, the $10,000 to $14,999 income bracket is the least frequent group with only 76 families (2.1%) belonging to this category.
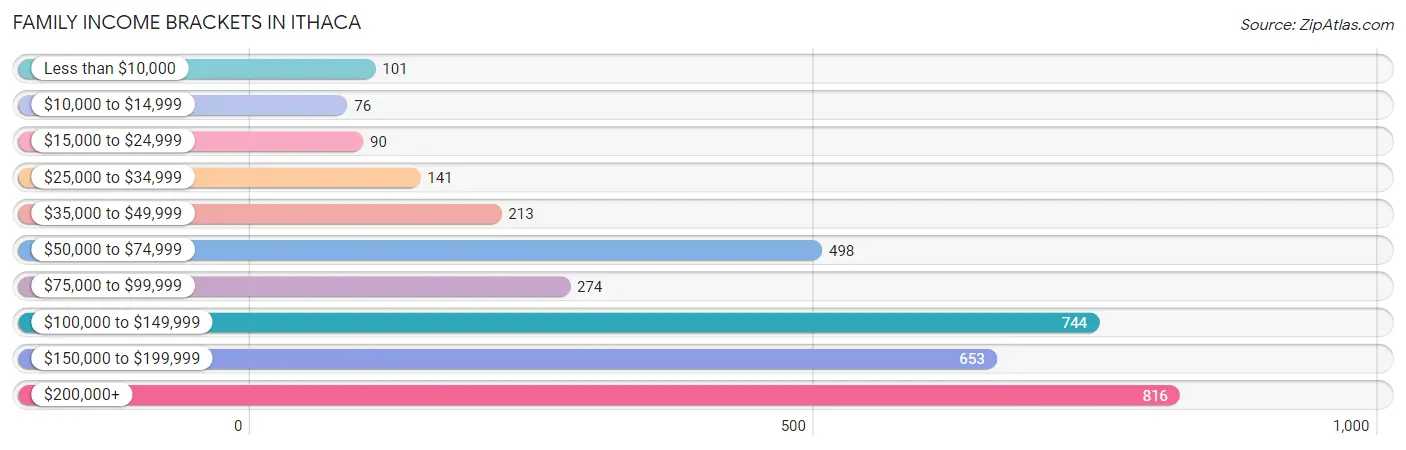
| Income Bracket | # Families | % Families |
| Less than $10,000 | 101 | 2.8% |
| $10,000 to $14,999 | 76 | 2.1% |
| $15,000 to $24,999 | 90 | 2.5% |
| $25,000 to $34,999 | 141 | 3.9% |
| $35,000 to $49,999 | 213 | 5.9% |
| $50,000 to $74,999 | 498 | 13.8% |
| $75,000 to $99,999 | 274 | 7.6% |
| $100,000 to $149,999 | 744 | 20.6% |
| $150,000 to $199,999 | 653 | 18.1% |
| $200,000+ | 816 | 22.6% |
Family Income by Famaliy Size in Ithaca
4-person families (663 | 18.4%) account for the highest median family income in Ithaca with $198,116 per family, while 2-person families (1,751 | 48.5%) have the highest median income of $52,812 per family member.
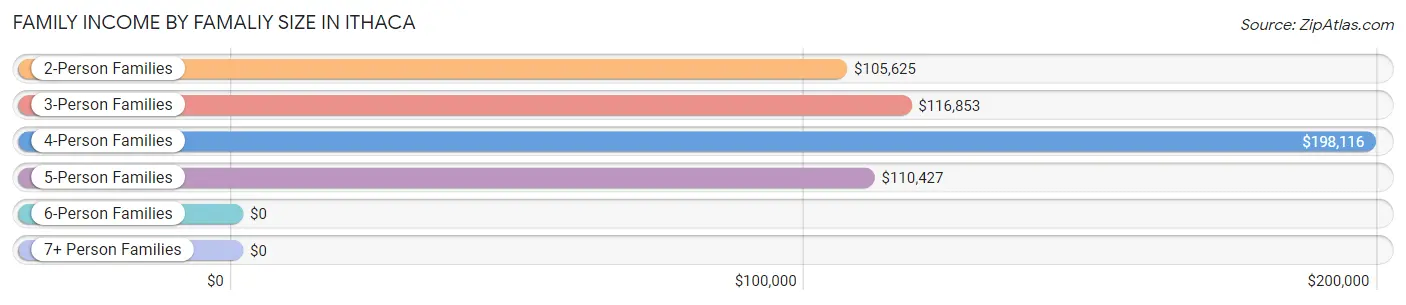
| Income Bracket | # Families | Median Income |
| 2-Person Families | 1,751 (48.5%) | $105,625 |
| 3-Person Families | 999 (27.7%) | $116,853 |
| 4-Person Families | 663 (18.4%) | $198,116 |
| 5-Person Families | 166 (4.6%) | $110,427 |
| 6-Person Families | 31 (0.9%) | $0 |
| 7+ Person Families | 0 (0.0%) | $0 |
| Total | 3,610 (100.0%) | $122,929 |
Family Income by Number of Earners in Ithaca
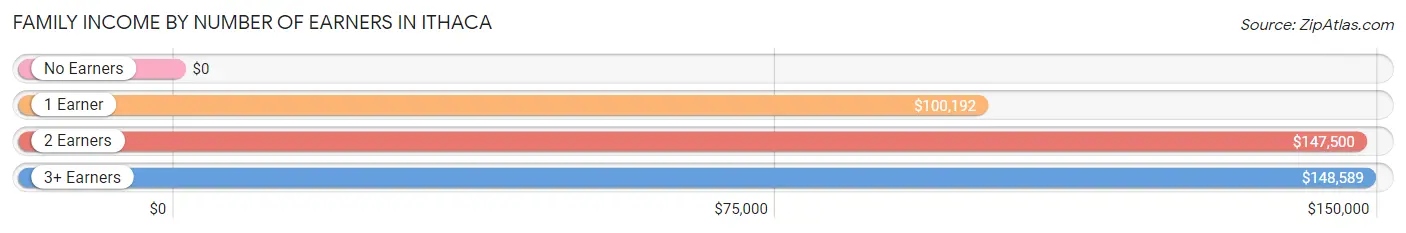
| Number of Earners | # Families | Median Income |
| No Earners | 319 (8.8%) | $0 |
| 1 Earner | 1,050 (29.1%) | $100,192 |
| 2 Earners | 1,822 (50.5%) | $147,500 |
| 3+ Earners | 419 (11.6%) | $148,589 |
| Total | 3,610 (100.0%) | $122,929 |
Household Income in Ithaca
Household Income Brackets in Ithaca
With 2,435 households falling in the category, the less than $10,000 income range is the most frequent in Ithaca, accounting for 18.4% of all households. In contrast, only 662 households (5.0%) fall into the $10,000 to $14,999 income bracket, making it the least populous group.
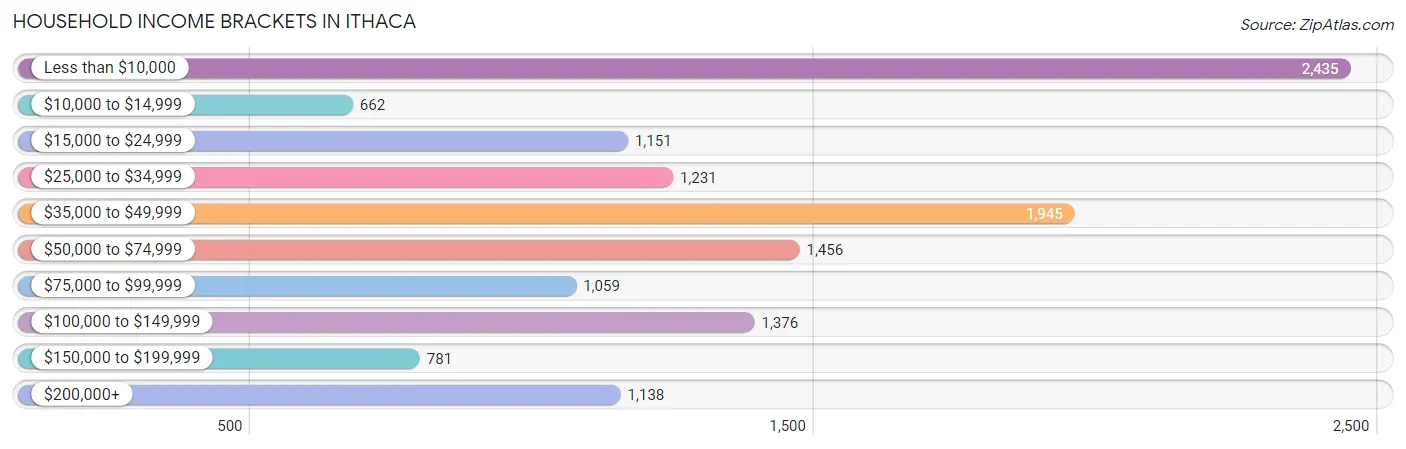
| Income Bracket | # Households | % Households |
| Less than $10,000 | 2,435 | 18.4% |
| $10,000 to $14,999 | 662 | 5.0% |
| $15,000 to $24,999 | 1,151 | 8.7% |
| $25,000 to $34,999 | 1,231 | 9.3% |
| $35,000 to $49,999 | 1,945 | 14.7% |
| $50,000 to $74,999 | 1,456 | 11.0% |
| $75,000 to $99,999 | 1,059 | 8.0% |
| $100,000 to $149,999 | 1,376 | 10.4% |
| $150,000 to $199,999 | 781 | 5.9% |
| $200,000+ | 1,138 | 8.6% |
Household Income by Householder Age in Ithaca
The median household income in Ithaca is $45,468, with the highest median household income of $110,349 found in the 45 to 64 years age bracket for the primary householder. A total of 2,655 households (20.1%) fall into this category. Meanwhile, the 15 to 24 years age bracket for the primary householder has the lowest median household income of $15,587, with 4,593 households (34.7%) in this group.
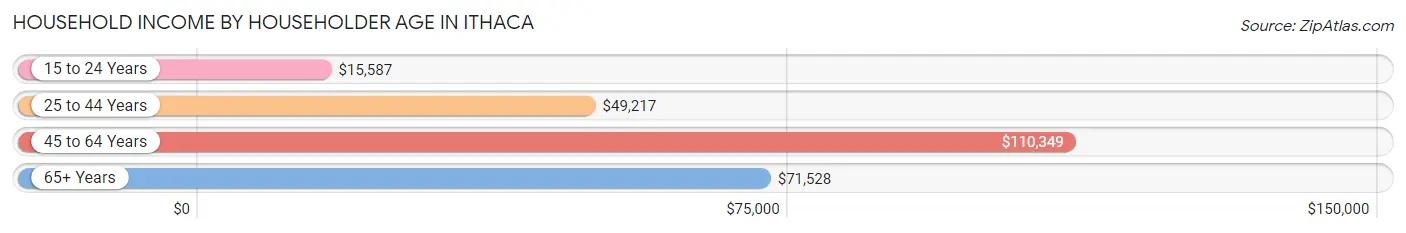
| Income Bracket | # Households | Median Income |
| 15 to 24 Years | 4,593 (34.7%) | $15,587 |
| 25 to 44 Years | 4,308 (32.6%) | $49,217 |
| 45 to 64 Years | 2,655 (20.1%) | $110,349 |
| 65+ Years | 1,677 (12.7%) | $71,528 |
| Total | 13,233 (100.0%) | $45,468 |
Poverty in Ithaca
Income Below Poverty by Sex and Age in Ithaca
With 31.2% poverty level for males and 34.9% for females among the residents of Ithaca, 18 to 24 year old males and 18 to 24 year old females are the most vulnerable to poverty, with 3,039 males (67.1%) and 3,203 females (75.8%) in their respective age groups living below the poverty level.
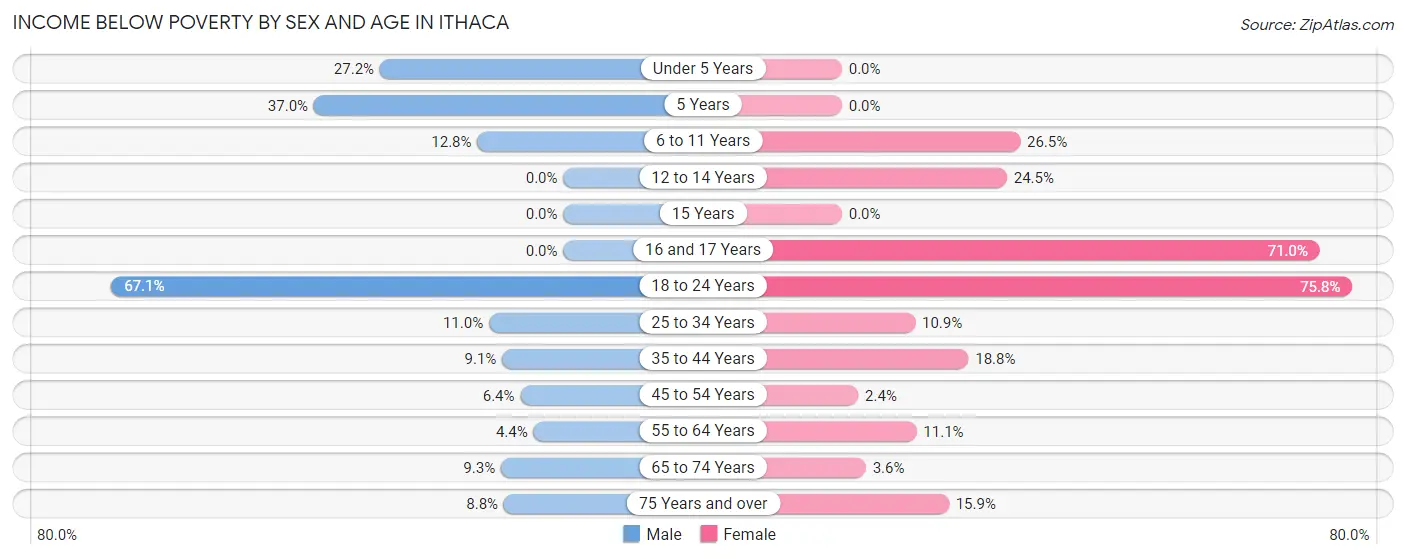
| Age Bracket | Male | Female |
| Under 5 Years | 82 (27.2%) | 0 (0.0%) |
| 5 Years | 20 (37.0%) | 0 (0.0%) |
| 6 to 11 Years | 36 (12.8%) | 99 (26.5%) |
| 12 to 14 Years | 0 (0.0%) | 74 (24.5%) |
| 15 Years | 0 (0.0%) | 0 (0.0%) |
| 16 and 17 Years | 0 (0.0%) | 44 (71.0%) |
| 18 to 24 Years | 3,039 (67.1%) | 3,203 (75.8%) |
| 25 to 34 Years | 210 (11.0%) | 212 (10.9%) |
| 35 to 44 Years | 139 (9.1%) | 272 (18.8%) |
| 45 to 54 Years | 53 (6.4%) | 20 (2.4%) |
| 55 to 64 Years | 48 (4.4%) | 129 (11.1%) |
| 65 to 74 Years | 64 (9.3%) | 23 (3.5%) |
| 75 Years and over | 27 (8.8%) | 104 (15.9%) |
| Total | 3,718 (31.2%) | 4,180 (34.9%) |
Income Above Poverty by Sex and Age in Ithaca
According to the poverty statistics in Ithaca, males aged 12 to 14 years and females aged under 5 years are the age groups that are most secure financially, with 100.0% of males and 100.0% of females in these age groups living above the poverty line.
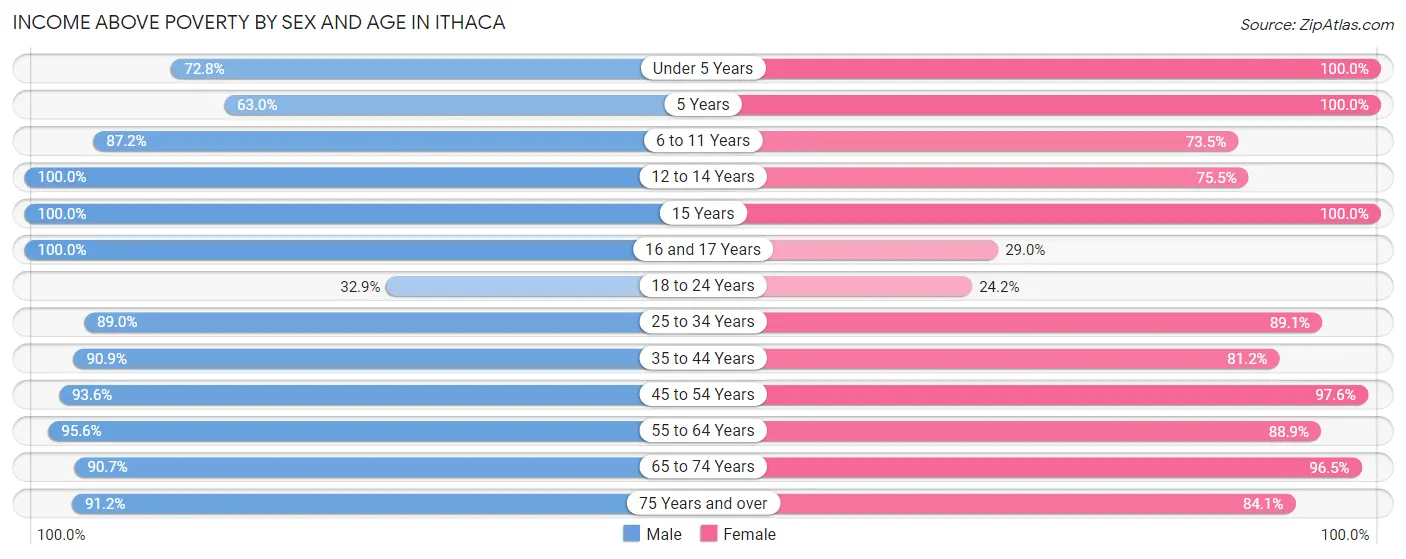
| Age Bracket | Male | Female |
| Under 5 Years | 219 (72.8%) | 176 (100.0%) |
| 5 Years | 34 (63.0%) | 96 (100.0%) |
| 6 to 11 Years | 246 (87.2%) | 275 (73.5%) |
| 12 to 14 Years | 211 (100.0%) | 228 (75.5%) |
| 15 Years | 60 (100.0%) | 54 (100.0%) |
| 16 and 17 Years | 131 (100.0%) | 18 (29.0%) |
| 18 to 24 Years | 1,488 (32.9%) | 1,023 (24.2%) |
| 25 to 34 Years | 1,693 (89.0%) | 1,737 (89.1%) |
| 35 to 44 Years | 1,391 (90.9%) | 1,176 (81.2%) |
| 45 to 54 Years | 778 (93.6%) | 803 (97.6%) |
| 55 to 64 Years | 1,038 (95.6%) | 1,035 (88.9%) |
| 65 to 74 Years | 627 (90.7%) | 625 (96.5%) |
| 75 Years and over | 279 (91.2%) | 551 (84.1%) |
| Total | 8,195 (68.8%) | 7,797 (65.1%) |
Income Below Poverty Among Married-Couple Families in Ithaca
The poverty statistics for married-couple families in Ithaca show that 0.3% or 7 of the total 2,798 families live below the poverty line. Families with no children have the highest poverty rate of 0.4%, comprising of 7 families. On the other hand, families with 1 or 2 children have the lowest poverty rate of 0.0%, which includes 0 families.
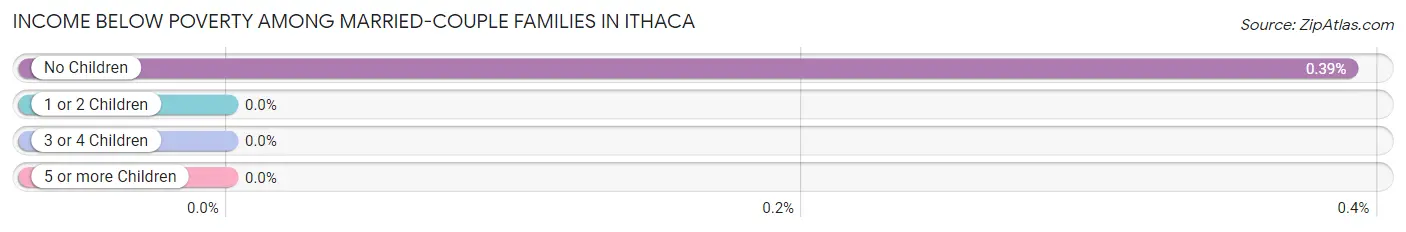
| Children | Above Poverty | Below Poverty |
| No Children | 1,769 (99.6%) | 7 (0.4%) |
| 1 or 2 Children | 947 (100.0%) | 0 (0.0%) |
| 3 or 4 Children | 75 (100.0%) | 0 (0.0%) |
| 5 or more Children | 0 (0.0%) | 0 (0.0%) |
| Total | 2,791 (99.8%) | 7 (0.3%) |
Income Below Poverty Among Single-Parent Households in Ithaca
According to the poverty data in Ithaca, 11.4% or 24 single-father households and 29.1% or 175 single-mother households are living below the poverty line. Among single-father households, those with 1 or 2 children have the highest poverty rate, with 18 households (12.2%) experiencing poverty. Likewise, among single-mother households, those with 3 or 4 children have the highest poverty rate, with 47 households (100.0%) falling below the poverty line.
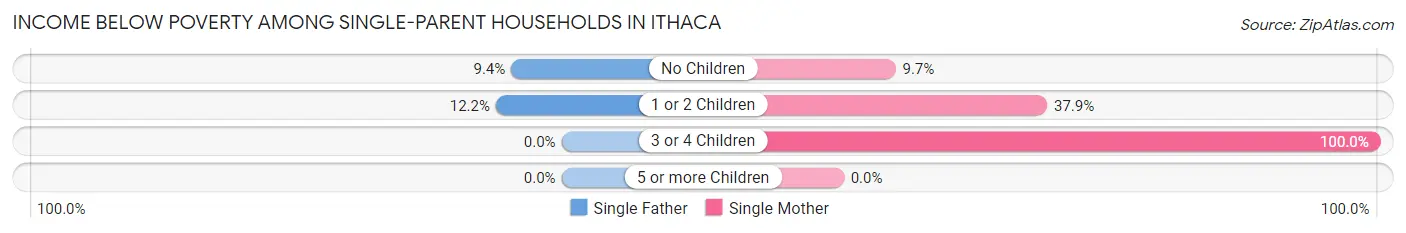
| Children | Single Father | Single Mother |
| No Children | 6 (9.4%) | 28 (9.7%) |
| 1 or 2 Children | 18 (12.2%) | 100 (37.9%) |
| 3 or 4 Children | 0 (0.0%) | 47 (100.0%) |
| 5 or more Children | 0 (0.0%) | 0 (0.0%) |
| Total | 24 (11.4%) | 175 (29.1%) |
Income Below Poverty Among Married-Couple vs Single-Parent Households in Ithaca
The poverty data for Ithaca shows that 7 of the married-couple family households (0.3%) and 199 of the single-parent households (24.5%) are living below the poverty level. Within the married-couple family households, those with no children have the highest poverty rate, with 7 households (0.4%) falling below the poverty line. Among the single-parent households, those with 3 or 4 children have the highest poverty rate, with 47 household (100.0%) living below poverty.
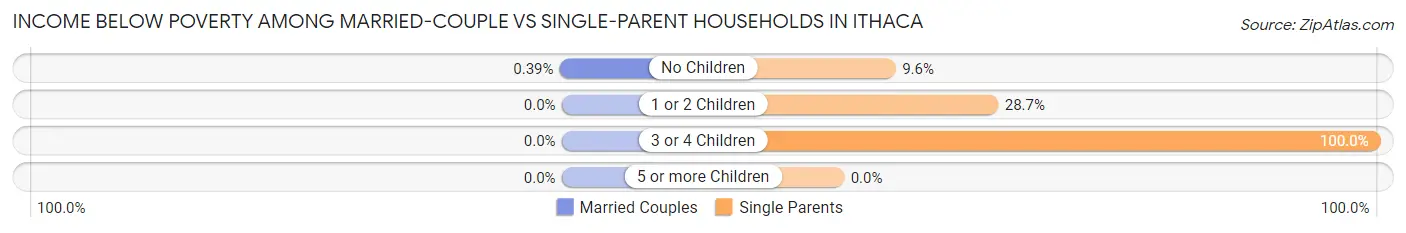
| Children | Married-Couple Families | Single-Parent Households |
| No Children | 7 (0.4%) | 34 (9.6%) |
| 1 or 2 Children | 0 (0.0%) | 118 (28.7%) |
| 3 or 4 Children | 0 (0.0%) | 47 (100.0%) |
| 5 or more Children | 0 (0.0%) | 0 (0.0%) |
| Total | 7 (0.3%) | 199 (24.5%) |
Race in Ithaca
The most populous races in Ithaca are White / Caucasian (20,841 | 66.5%), Asian (4,932 | 15.7%), and Hispanic or Latino (2,515 | 8.0%).
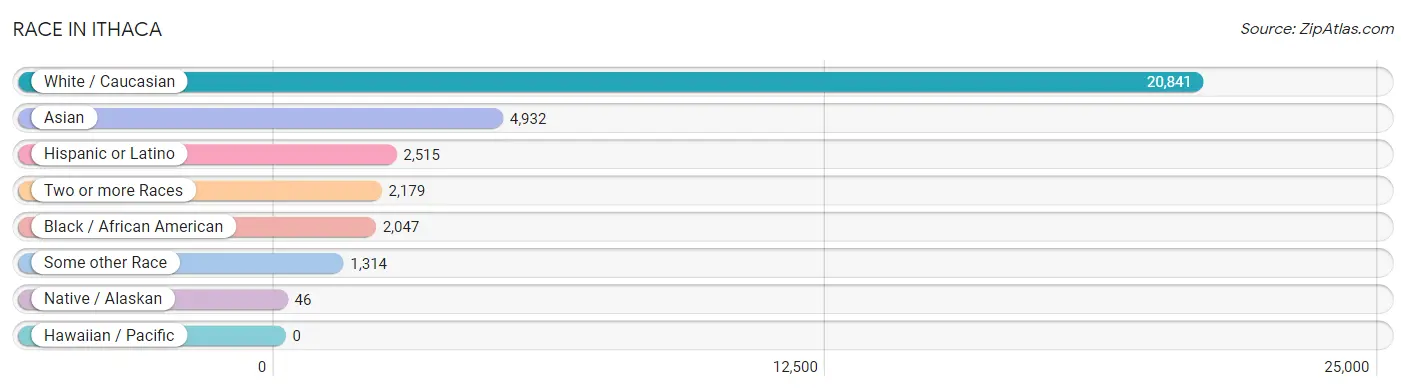
| Race | # Population | % Population |
| Asian | 4,932 | 15.7% |
| Black / African American | 2,047 | 6.5% |
| Hawaiian / Pacific | 0 | 0.0% |
| Hispanic or Latino | 2,515 | 8.0% |
| Native / Alaskan | 46 | 0.2% |
| White / Caucasian | 20,841 | 66.5% |
| Two or more Races | 2,179 | 7.0% |
| Some other Race | 1,314 | 4.2% |
| Total | 31,359 | 100.0% |
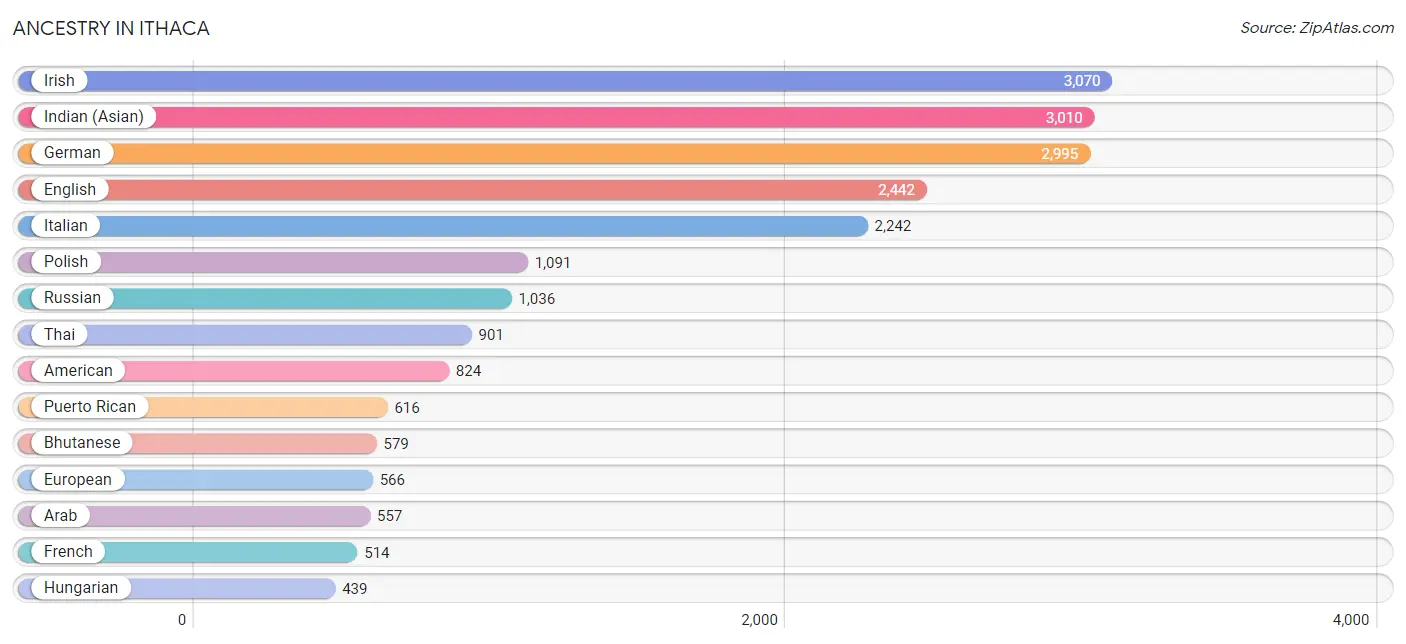
Ancestry in Ithaca
The most populous ancestries reported in Ithaca are Irish (3,070 | 9.8%), Indian (Asian) (3,010 | 9.6%), German (2,995 | 9.6%), English (2,442 | 7.8%), and Italian (2,242 | 7.1%), together accounting for 43.9% of all Ithaca residents.
| Ancestry | # Population | % Population |
| African | 33 | 0.1% |
| American | 824 | 2.6% |
| Arab | 557 | 1.8% |
| Argentinean | 58 | 0.2% |
| Armenian | 25 | 0.1% |
| Australian | 8 | 0.0% |
| Austrian | 50 | 0.2% |
| Belizean | 10 | 0.0% |
| Bhutanese | 579 | 1.8% |
| Blackfeet | 233 | 0.7% |
| Bolivian | 32 | 0.1% |
| Brazilian | 22 | 0.1% |
| British | 315 | 1.0% |
| Bulgarian | 54 | 0.2% |
| Burmese | 268 | 0.9% |
| Canadian | 228 | 0.7% |
| Cape Verdean | 22 | 0.1% |
| Carpatho Rusyn | 2 | 0.0% |
| Central American | 237 | 0.8% |
| Cherokee | 71 | 0.2% |
| Colombian | 55 | 0.2% |
| Costa Rican | 12 | 0.0% |
| Croatian | 69 | 0.2% |
| Cuban | 188 | 0.6% |
| Czech | 147 | 0.5% |
| Czechoslovakian | 13 | 0.0% |
| Danish | 76 | 0.2% |
| Dominican | 136 | 0.4% |
| Dutch | 284 | 0.9% |
| Eastern European | 259 | 0.8% |
| Ecuadorian | 110 | 0.4% |
| Egyptian | 14 | 0.0% |
| English | 2,442 | 7.8% |
| Ethiopian | 31 | 0.1% |
| European | 566 | 1.8% |
| Filipino | 41 | 0.1% |
| Finnish | 99 | 0.3% |
| French | 514 | 1.6% |
| French Canadian | 384 | 1.2% |
| German | 2,995 | 9.6% |
| German Russian | 8 | 0.0% |
| Greek | 405 | 1.3% |
| Guatemalan | 117 | 0.4% |
| Guyanese | 90 | 0.3% |
| Haitian | 14 | 0.0% |
| Honduran | 45 | 0.1% |
| Hungarian | 439 | 1.4% |
| Indian (Asian) | 3,010 | 9.6% |
| Indonesian | 86 | 0.3% |
| Iranian | 33 | 0.1% |
| Irish | 3,070 | 9.8% |
| Iroquois | 24 | 0.1% |
| Israeli | 143 | 0.5% |
| Italian | 2,242 | 7.1% |
| Jamaican | 6 | 0.0% |
| Japanese | 31 | 0.1% |
| Kenyan | 73 | 0.2% |
| Korean | 166 | 0.5% |
| Laotian | 34 | 0.1% |
| Latvian | 34 | 0.1% |
| Lebanese | 180 | 0.6% |
| Lithuanian | 131 | 0.4% |
| Luxembourger | 21 | 0.1% |
| Macedonian | 35 | 0.1% |
| Maltese | 14 | 0.0% |
| Mexican | 166 | 0.5% |
| Moroccan | 16 | 0.1% |
| Native Hawaiian | 61 | 0.2% |
| Nigerian | 78 | 0.3% |
| Northern European | 52 | 0.2% |
| Norwegian | 176 | 0.6% |
| Pakistani | 112 | 0.4% |
| Panamanian | 2 | 0.0% |
| Pennsylvania German | 16 | 0.1% |
| Peruvian | 67 | 0.2% |
| Polish | 1,091 | 3.5% |
| Portuguese | 94 | 0.3% |
| Puerto Rican | 616 | 2.0% |
| Romanian | 193 | 0.6% |
| Russian | 1,036 | 3.3% |
| Salvadoran | 61 | 0.2% |
| Scandinavian | 81 | 0.3% |
| Scotch-Irish | 125 | 0.4% |
| Scottish | 401 | 1.3% |
| Senegalese | 6 | 0.0% |
| Sierra Leonean | 5 | 0.0% |
| Slavic | 10 | 0.0% |
| Slovak | 19 | 0.1% |
| Slovene | 39 | 0.1% |
| Somali | 8 | 0.0% |
| South African | 11 | 0.0% |
| South American | 331 | 1.1% |
| South American Indian | 8 | 0.0% |
| Spaniard | 163 | 0.5% |
| Spanish | 64 | 0.2% |
| Sri Lankan | 117 | 0.4% |
| Subsaharan African | 402 | 1.3% |
| Swedish | 347 | 1.1% |
| Swiss | 32 | 0.1% |
| Syrian | 28 | 0.1% |
| Thai | 901 | 2.9% |
| Tlingit-Haida | 21 | 0.1% |
| Turkish | 155 | 0.5% |
| Ugandan | 5 | 0.0% |
| Ukrainian | 206 | 0.7% |
| Vietnamese | 105 | 0.3% |
| Welsh | 164 | 0.5% |
| Yugoslavian | 24 | 0.1% | View All 108 Rows |
Immigrants in Ithaca
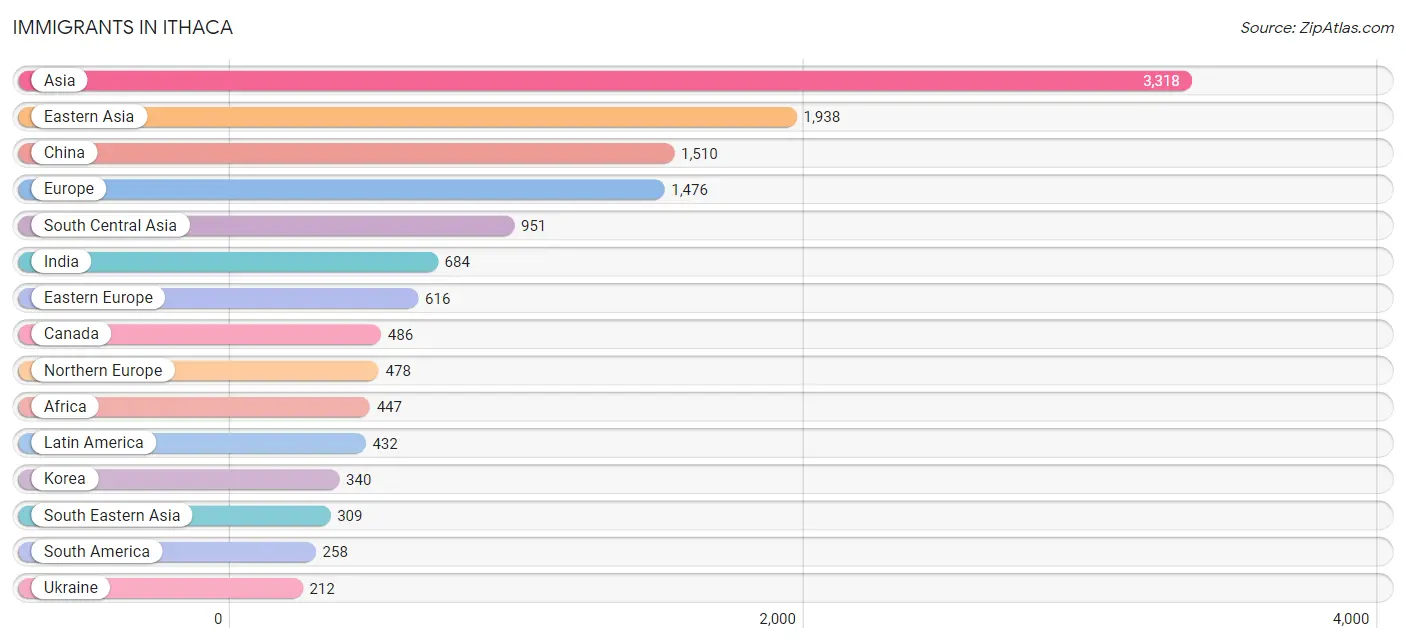
The most numerous immigrant groups reported in Ithaca came from Asia (3,318 | 10.6%), Eastern Asia (1,938 | 6.2%), China (1,510 | 4.8%), Europe (1,476 | 4.7%), and South Central Asia (951 | 3.0%), together accounting for 29.3% of all Ithaca residents.
| Immigration Origin | # Population | % Population |
| Africa | 447 | 1.4% |
| Albania | 7 | 0.0% |
| Argentina | 21 | 0.1% |
| Asia | 3,318 | 10.6% |
| Austria | 15 | 0.1% |
| Bangladesh | 93 | 0.3% |
| Belarus | 54 | 0.2% |
| Belize | 6 | 0.0% |
| Bolivia | 4 | 0.0% |
| Brazil | 112 | 0.4% |
| Bulgaria | 54 | 0.2% |
| Cambodia | 27 | 0.1% |
| Canada | 486 | 1.5% |
| Caribbean | 69 | 0.2% |
| Central America | 105 | 0.3% |
| China | 1,510 | 4.8% |
| Colombia | 46 | 0.2% |
| Costa Rica | 12 | 0.0% |
| Denmark | 16 | 0.1% |
| Dominican Republic | 69 | 0.2% |
| Eastern Africa | 192 | 0.6% |
| Eastern Asia | 1,938 | 6.2% |
| Eastern Europe | 616 | 2.0% |
| Egypt | 14 | 0.0% |
| El Salvador | 49 | 0.2% |
| England | 139 | 0.4% |
| Ethiopia | 11 | 0.0% |
| Europe | 1,476 | 4.7% |
| France | 30 | 0.1% |
| Germany | 96 | 0.3% |
| Ghana | 29 | 0.1% |
| Greece | 33 | 0.1% |
| Guyana | 47 | 0.2% |
| Hong Kong | 207 | 0.7% |
| Hungary | 34 | 0.1% |
| India | 684 | 2.2% |
| Indonesia | 34 | 0.1% |
| Iran | 29 | 0.1% |
| Ireland | 15 | 0.1% |
| Israel | 36 | 0.1% |
| Italy | 122 | 0.4% |
| Japan | 88 | 0.3% |
| Kenya | 73 | 0.2% |
| Korea | 340 | 1.1% |
| Latin America | 432 | 1.4% |
| Malaysia | 41 | 0.1% |
| Mexico | 19 | 0.1% |
| Middle Africa | 3 | 0.0% |
| Morocco | 30 | 0.1% |
| Nepal | 113 | 0.4% |
| Netherlands | 33 | 0.1% |
| Nigeria | 53 | 0.2% |
| North Macedonia | 17 | 0.1% |
| Northern Africa | 55 | 0.2% |
| Northern Europe | 478 | 1.5% |
| Oceania | 17 | 0.1% |
| Panama | 19 | 0.1% |
| Peru | 28 | 0.1% |
| Philippines | 31 | 0.1% |
| Poland | 10 | 0.0% |
| Portugal | 23 | 0.1% |
| Romania | 115 | 0.4% |
| Russia | 113 | 0.4% |
| Singapore | 15 | 0.1% |
| South Africa | 19 | 0.1% |
| South America | 258 | 0.8% |
| South Central Asia | 951 | 3.0% |
| South Eastern Asia | 309 | 1.0% |
| Southern Europe | 208 | 0.7% |
| Spain | 16 | 0.1% |
| Taiwan | 64 | 0.2% |
| Thailand | 103 | 0.3% |
| Turkey | 78 | 0.3% |
| Ukraine | 212 | 0.7% |
| Vietnam | 26 | 0.1% |
| Western Africa | 178 | 0.6% |
| Western Asia | 120 | 0.4% |
| Western Europe | 174 | 0.5% |
| Zimbabwe | 11 | 0.0% | View All 79 Rows |
Sex and Age in Ithaca
Sex and Age in Ithaca
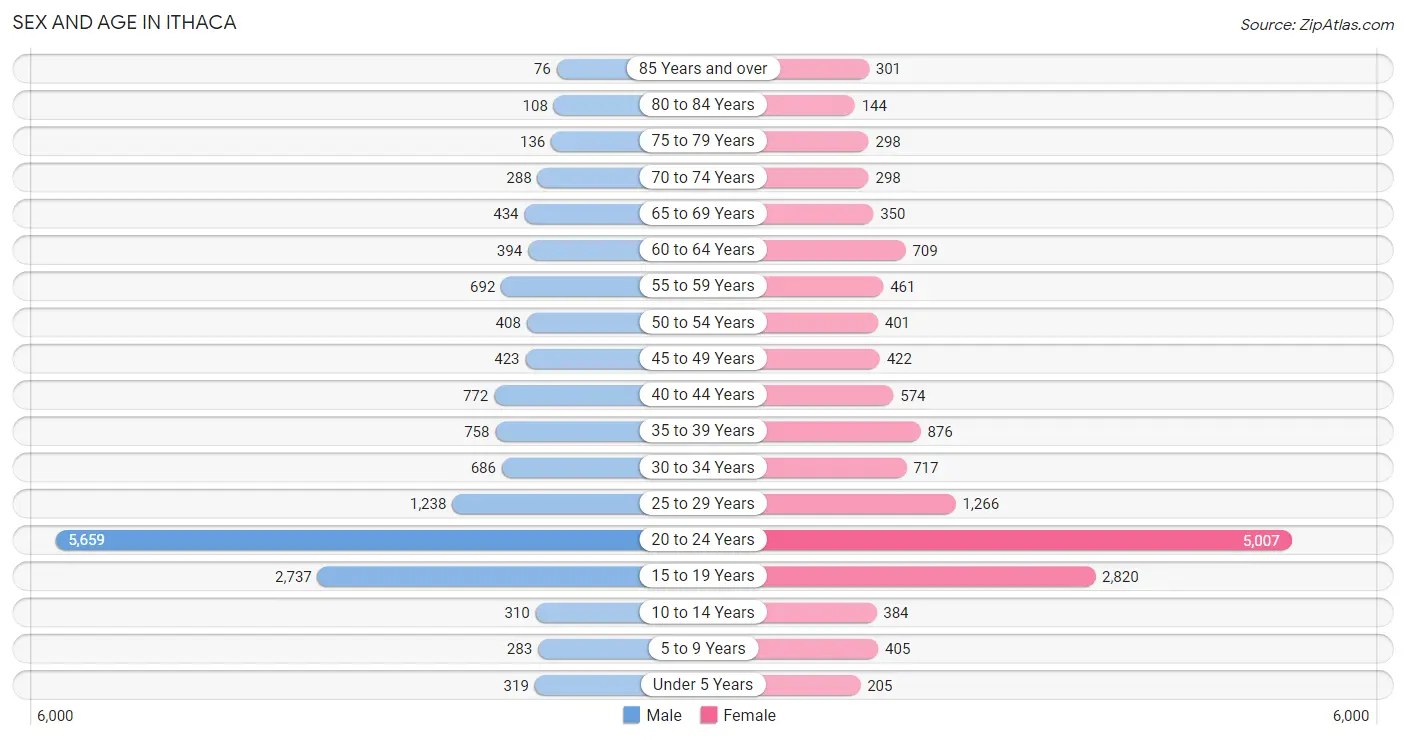
The most populous age groups in Ithaca are 20 to 24 Years (5,659 | 36.0%) for men and 20 to 24 Years (5,007 | 32.0%) for women.
| Age Bracket | Male | Female |
| Under 5 Years | 319 (2.0%) | 205 (1.3%) |
| 5 to 9 Years | 283 (1.8%) | 405 (2.6%) |
| 10 to 14 Years | 310 (2.0%) | 384 (2.5%) |
| 15 to 19 Years | 2,737 (17.4%) | 2,820 (18.0%) |
| 20 to 24 Years | 5,659 (36.0%) | 5,007 (32.0%) |
| 25 to 29 Years | 1,238 (7.9%) | 1,266 (8.1%) |
| 30 to 34 Years | 686 (4.4%) | 717 (4.6%) |
| 35 to 39 Years | 758 (4.8%) | 876 (5.6%) |
| 40 to 44 Years | 772 (4.9%) | 574 (3.7%) |
| 45 to 49 Years | 423 (2.7%) | 422 (2.7%) |
| 50 to 54 Years | 408 (2.6%) | 401 (2.6%) |
| 55 to 59 Years | 692 (4.4%) | 461 (2.9%) |
| 60 to 64 Years | 394 (2.5%) | 709 (4.5%) |
| 65 to 69 Years | 434 (2.8%) | 350 (2.2%) |
| 70 to 74 Years | 288 (1.8%) | 298 (1.9%) |
| 75 to 79 Years | 136 (0.9%) | 298 (1.9%) |
| 80 to 84 Years | 108 (0.7%) | 144 (0.9%) |
| 85 Years and over | 76 (0.5%) | 301 (1.9%) |
| Total | 15,721 (100.0%) | 15,638 (100.0%) |
Families and Households in Ithaca
Median Family Size in Ithaca
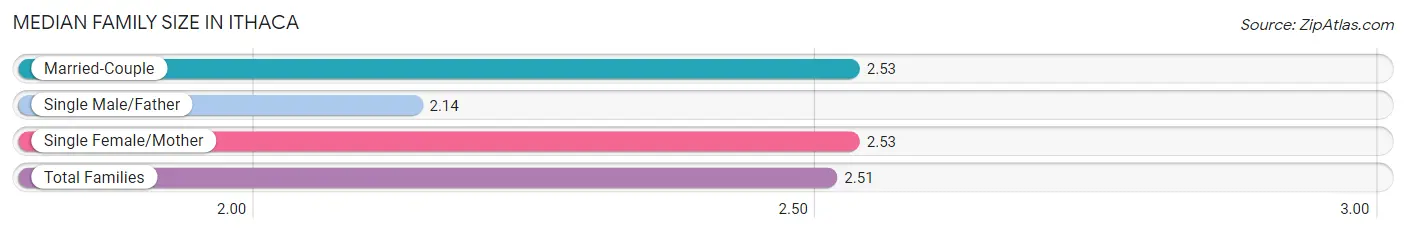
The median family size in Ithaca is 2.51 persons per family, with married-couple families (2,798 | 77.5%) accounting for the largest median family size of 2.53 persons per family. On the other hand, single male/father families (211 | 5.8%) represent the smallest median family size with 2.14 persons per family.
| Family Type | # Families | Family Size |
| Married-Couple | 2,798 (77.5%) | 2.53 |
| Single Male/Father | 211 (5.8%) | 2.14 |
| Single Female/Mother | 601 (16.7%) | 2.53 |
| Total Families | 3,610 (100.0%) | 2.51 |
Median Household Size in Ithaca
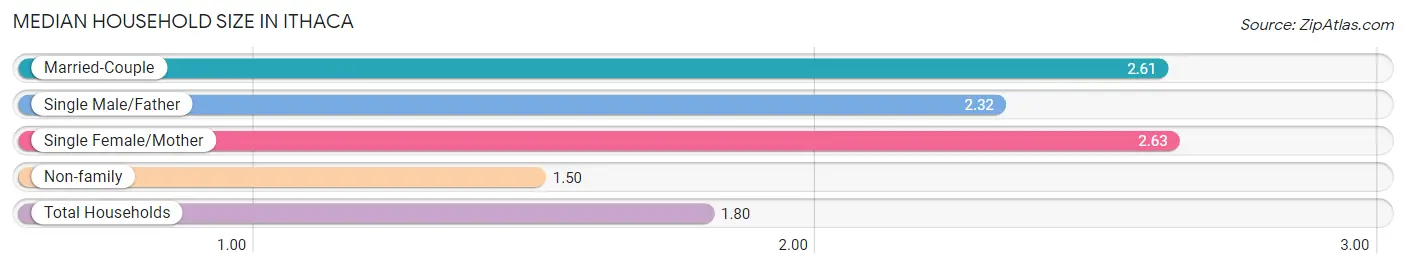
The median household size in Ithaca is 1.80 persons per household, with single female/mother households (601 | 4.5%) accounting for the largest median household size of 2.63 persons per household. non-family households (9,623 | 72.7%) represent the smallest median household size with 1.50 persons per household.
| Household Type | # Households | Household Size |
| Married-Couple | 2,798 (21.1%) | 2.61 |
| Single Male/Father | 211 (1.6%) | 2.32 |
| Single Female/Mother | 601 (4.5%) | 2.63 |
| Non-family | 9,623 (72.7%) | 1.50 |
| Total Households | 13,233 (100.0%) | 1.80 |
Household Size by Marriage Status in Ithaca
Out of a total of 13,233 households in Ithaca, 3,610 (27.3%) are family households, while 9,623 (72.7%) are nonfamily households. The most numerous type of family households are 2-person households, comprising 1,582, and the most common type of nonfamily households are 1-person households, comprising 5,376.
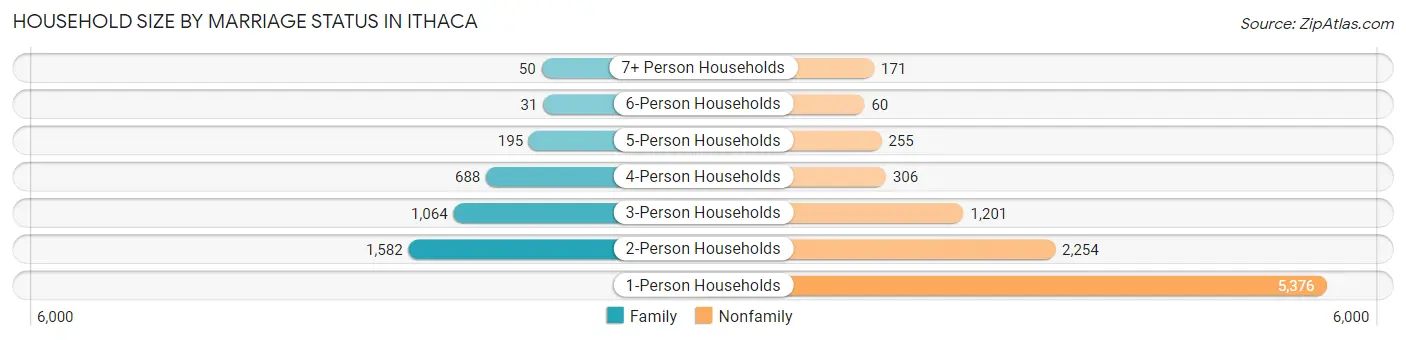
| Household Size | Family Households | Nonfamily Households |
| 1-Person Households | - | 5,376 (40.6%) |
| 2-Person Households | 1,582 (11.9%) | 2,254 (17.0%) |
| 3-Person Households | 1,064 (8.0%) | 1,201 (9.1%) |
| 4-Person Households | 688 (5.2%) | 306 (2.3%) |
| 5-Person Households | 195 (1.5%) | 255 (1.9%) |
| 6-Person Households | 31 (0.2%) | 60 (0.4%) |
| 7+ Person Households | 50 (0.4%) | 171 (1.3%) |
| Total | 3,610 (27.3%) | 9,623 (72.7%) |
Female Fertility in Ithaca
Fertility by Age in Ithaca
Average fertility rate in Ithaca is 7.0 births per 1,000 women. Women in the age bracket of 35 to 50 years have the highest fertility rate with 36.0 births per 1,000 women. Women in the age bracket of 35 to 50 years acount for 84.2% of all women with births.
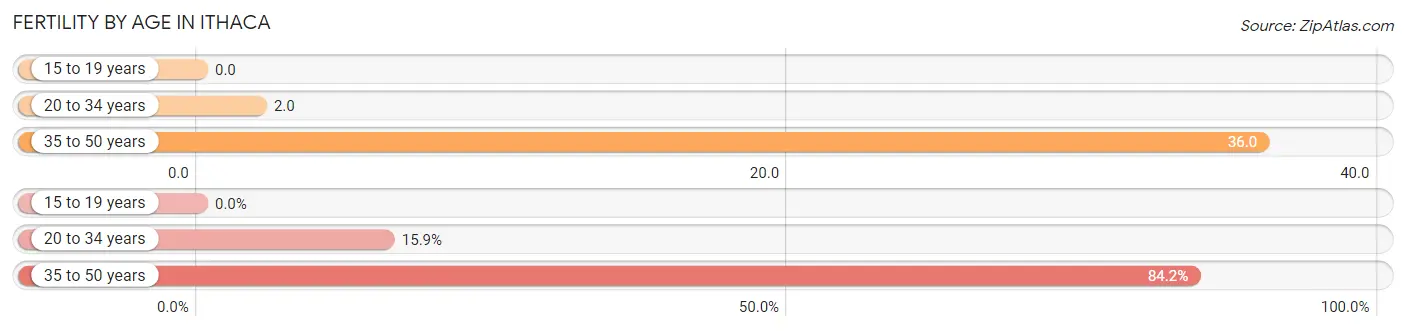
| Age Bracket | Women with Births | Births / 1,000 Women |
| 15 to 19 years | 0 (0.0%) | 0.0 |
| 20 to 34 years | 13 (15.9%) | 2.0 |
| 35 to 50 years | 69 (84.2%) | 36.0 |
| Total | 82 (100.0%) | 7.0 |
Fertility by Age by Marriage Status in Ithaca
70.7% of women with births (82) in Ithaca are married. The highest percentage of unmarried women with births falls into 35 to 50 years age bracket with 33.3% of them unmarried at the time of birth, while the lowest percentage of unmarried women with births belong to 20 to 34 years age bracket with 7.7% of them unmarried.
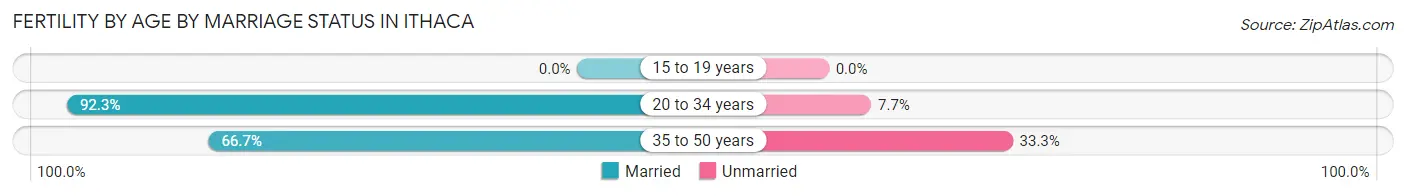
| Age Bracket | Married | Unmarried |
| 15 to 19 years | 0 (0.0%) | 0 (0.0%) |
| 20 to 34 years | 12 (92.3%) | 1 (7.7%) |
| 35 to 50 years | 46 (66.7%) | 23 (33.3%) |
| Total | 58 (70.7%) | 24 (29.3%) |
Fertility by Education in Ithaca
Average fertility rate in Ithaca is 7.0 births per 1,000 women. Women with the education attainment of less than high school have the highest fertility rate of 57.0 births per 1,000 women, while women with the education attainment of bachelor's degree have the lowest fertility at 1.0 births per 1,000 women. Women with the education attainment of graduate degree represent 34.2% of all women with births.
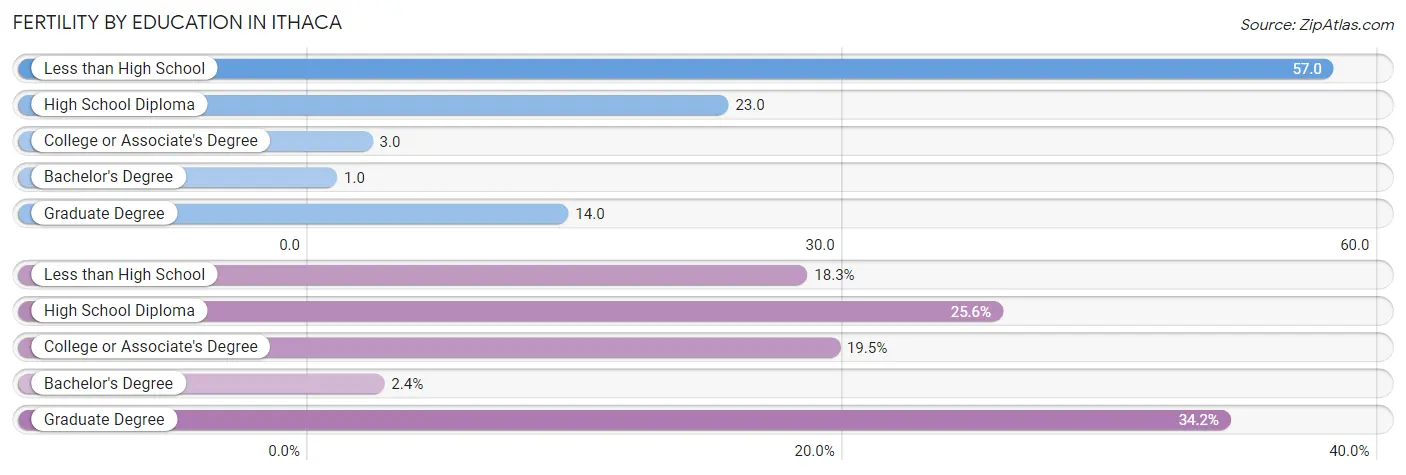
| Educational Attainment | Women with Births | Births / 1,000 Women |
| Less than High School | 15 (18.3%) | 57.0 |
| High School Diploma | 21 (25.6%) | 23.0 |
| College or Associate's Degree | 16 (19.5%) | 3.0 |
| Bachelor's Degree | 2 (2.4%) | 1.0 |
| Graduate Degree | 28 (34.2%) | 14.0 |
| Total | 82 (100.0%) | 7.0 |
Fertility by Education by Marriage Status in Ithaca
29.3% of women with births in Ithaca are unmarried. Women with the educational attainment of college or associate's degree are most likely to be married with 100.0% of them married at childbirth, while women with the educational attainment of high school diploma are least likely to be married with 100.0% of them unmarried at childbirth.
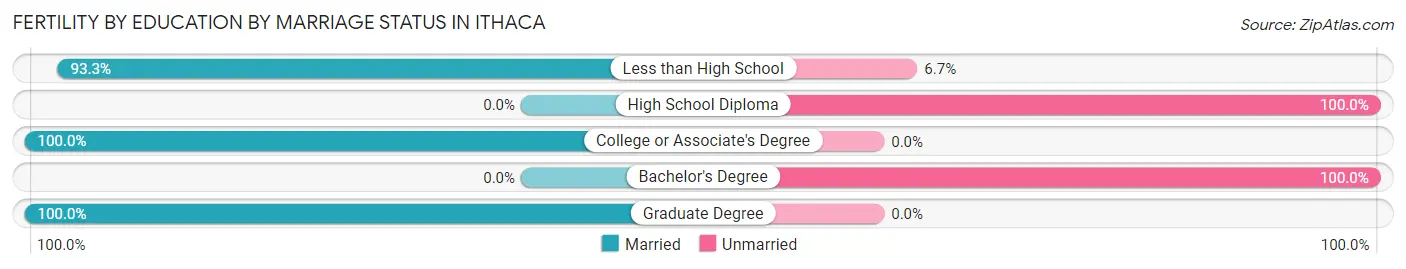
| Educational Attainment | Married | Unmarried |
| Less than High School | 14 (93.3%) | 1 (6.7%) |
| High School Diploma | 0 (0.0%) | 21 (100.0%) |
| College or Associate's Degree | 16 (100.0%) | 0 (0.0%) |
| Bachelor's Degree | 0 (0.0%) | 2 (100.0%) |
| Graduate Degree | 28 (100.0%) | 0 (0.0%) |
| Total | 58 (70.7%) | 24 (29.3%) |
Employment Characteristics in Ithaca
Employment by Class of Employer in Ithaca
Among the 14,443 employed individuals in Ithaca, private company employees (6,621 | 45.8%), not-for-profit organizations (4,483 | 31.0%), and state government employees (1,105 | 7.6%) make up the most common classes of employment.
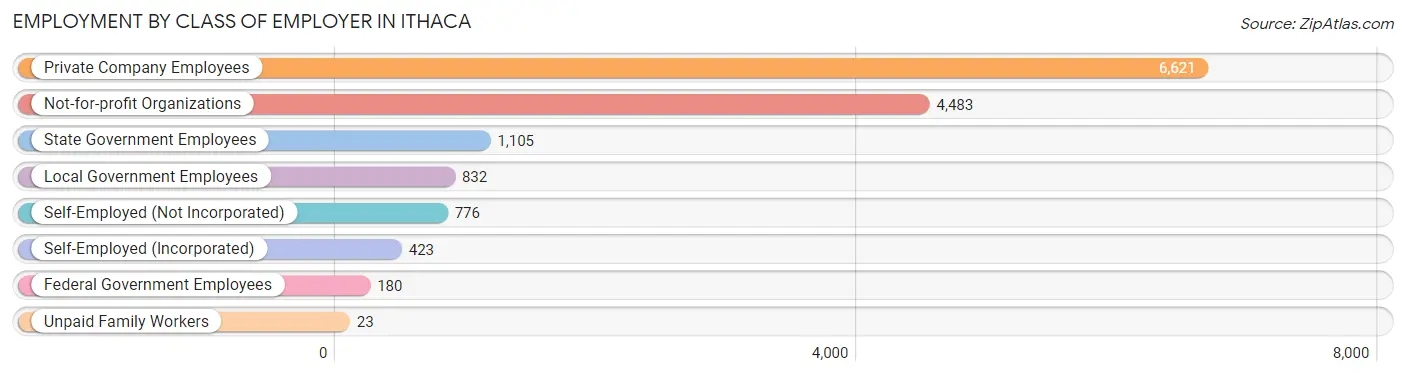
| Employer Class | # Employees | % Employees |
| Private Company Employees | 6,621 | 45.8% |
| Self-Employed (Incorporated) | 423 | 2.9% |
| Self-Employed (Not Incorporated) | 776 | 5.4% |
| Not-for-profit Organizations | 4,483 | 31.0% |
| Local Government Employees | 832 | 5.8% |
| State Government Employees | 1,105 | 7.6% |
| Federal Government Employees | 180 | 1.3% |
| Unpaid Family Workers | 23 | 0.2% |
| Total | 14,443 | 100.0% |
Employment Status by Age in Ithaca
According to the labor force statistics for Ithaca, out of the total population over 16 years of age (29,339), 53.7% or 15,755 individuals are in the labor force, with 5.9% or 930 of them unemployed. The age group with the highest labor force participation rate is 45 to 54 years, with 91.3% or 1,510 individuals in the labor force. Within the labor force, the 75 years and over age range has the highest percentage of unemployed individuals, with 11.5% or 13 of them being unemployed.
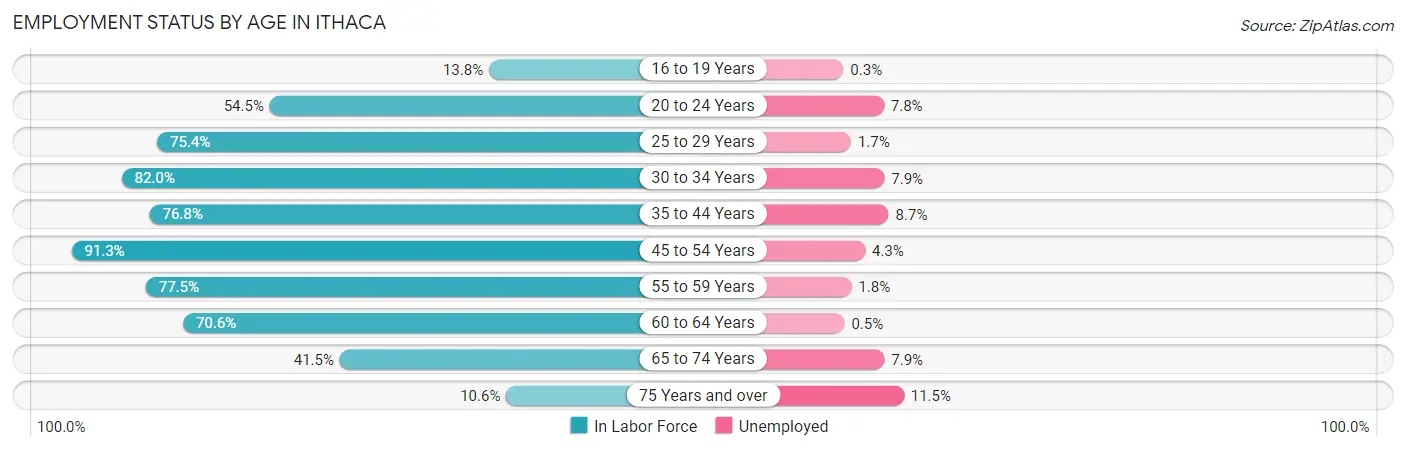
| Age Bracket | In Labor Force | Unemployed |
| 16 to 19 Years | 751 (13.8%) | 2 (0.3%) |
| 20 to 24 Years | 5,813 (54.5%) | 453 (7.8%) |
| 25 to 29 Years | 1,888 (75.4%) | 32 (1.7%) |
| 30 to 34 Years | 1,150 (82.0%) | 91 (7.9%) |
| 35 to 44 Years | 2,289 (76.8%) | 199 (8.7%) |
| 45 to 54 Years | 1,510 (91.3%) | 65 (4.3%) |
| 55 to 59 Years | 894 (77.5%) | 16 (1.8%) |
| 60 to 64 Years | 779 (70.6%) | 4 (0.5%) |
| 65 to 74 Years | 569 (41.5%) | 45 (7.9%) |
| 75 Years and over | 113 (10.6%) | 13 (11.5%) |
| Total | 15,755 (53.7%) | 930 (5.9%) |
Employment Status by Educational Attainment in Ithaca
According to labor force statistics for Ithaca, 78.8% of individuals (8,508) out of the total population between 25 and 64 years of age (10,797) are in the labor force, with 4.8% or 408 of them being unemployed. The group with the highest labor force participation rate are those with the educational attainment of bachelor's degree or higher, with 80.8% or 6,377 individuals in the labor force. Within the labor force, individuals with less than high school education have the highest percentage of unemployment, with 30.6% or 75 of them being unemployed.
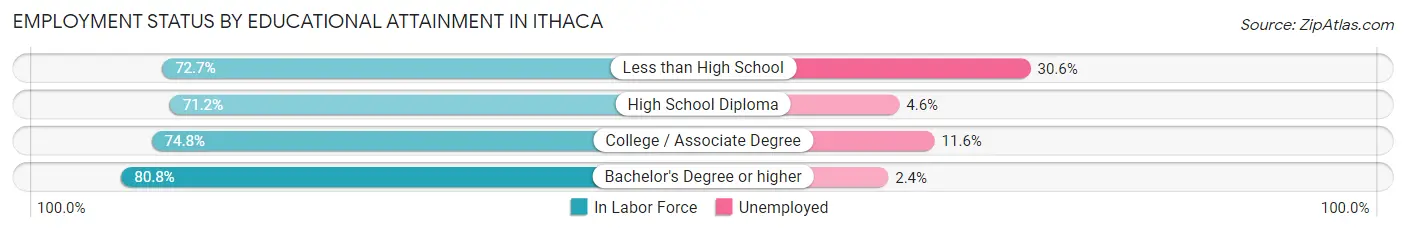
| Educational Attainment | In Labor Force | Unemployed |
| Less than High School | 245 (72.7%) | 103 (30.6%) |
| High School Diploma | 570 (71.2%) | 37 (4.6%) |
| College / Associate Degree | 1,322 (74.8%) | 205 (11.6%) |
| Bachelor's Degree or higher | 6,377 (80.8%) | 189 (2.4%) |
| Total | 8,508 (78.8%) | 518 (4.8%) |
Employment Occupations by Sex in Ithaca
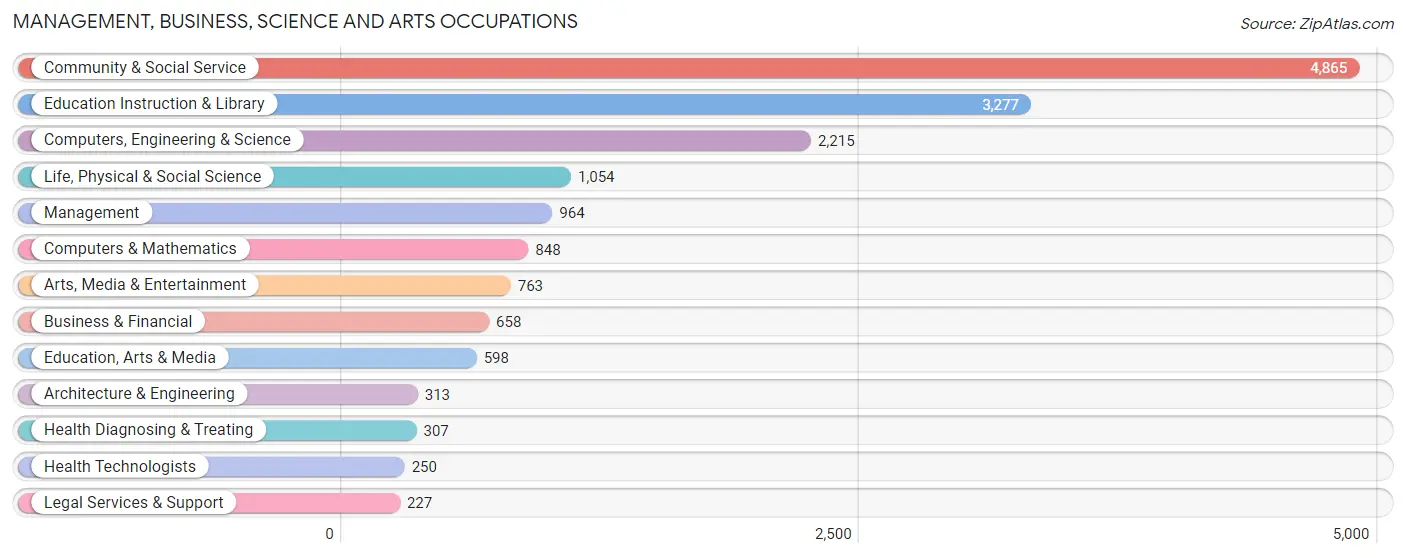
Management, Business, Science and Arts Occupations
The most common Management, Business, Science and Arts occupations in Ithaca are Community & Social Service (4,865 | 32.8%), Education Instruction & Library (3,277 | 22.1%), Computers, Engineering & Science (2,215 | 14.9%), Life, Physical & Social Science (1,054 | 7.1%), and Management (964 | 6.5%).
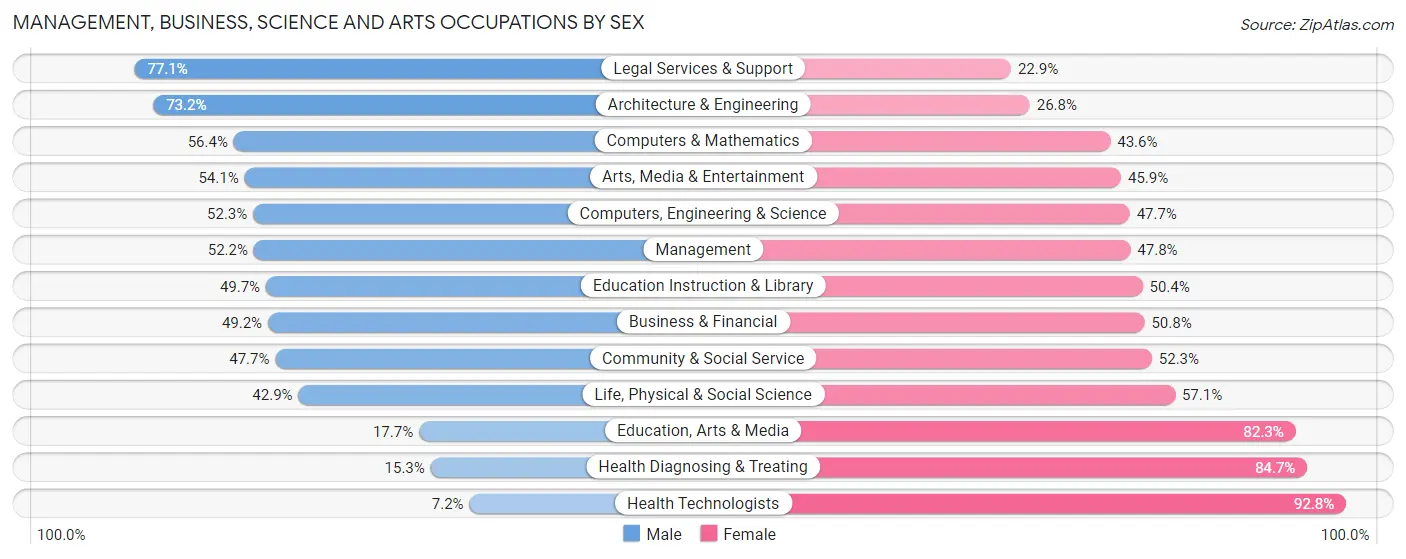
Management, Business, Science and Arts Occupations by Sex
Within the Management, Business, Science and Arts occupations in Ithaca, the most male-oriented occupations are Legal Services & Support (77.1%), Architecture & Engineering (73.2%), and Computers & Mathematics (56.4%), while the most female-oriented occupations are Health Technologists (92.8%), Health Diagnosing & Treating (84.7%), and Education, Arts & Media (82.3%).
| Occupation | Male | Female |
| Management | 503 (52.2%) | 461 (47.8%) |
| Business & Financial | 324 (49.2%) | 334 (50.8%) |
| Computers, Engineering & Science | 1,159 (52.3%) | 1,056 (47.7%) |
| Computers & Mathematics | 478 (56.4%) | 370 (43.6%) |
| Architecture & Engineering | 229 (73.2%) | 84 (26.8%) |
| Life, Physical & Social Science | 452 (42.9%) | 602 (57.1%) |
| Community & Social Service | 2,321 (47.7%) | 2,544 (52.3%) |
| Education, Arts & Media | 106 (17.7%) | 492 (82.3%) |
| Legal Services & Support | 175 (77.1%) | 52 (22.9%) |
| Education Instruction & Library | 1,627 (49.6%) | 1,650 (50.3%) |
| Arts, Media & Entertainment | 413 (54.1%) | 350 (45.9%) |
| Health Diagnosing & Treating | 47 (15.3%) | 260 (84.7%) |
| Health Technologists | 18 (7.2%) | 232 (92.8%) |
| Total (Category) | 4,354 (48.3%) | 4,655 (51.7%) |
| Total (Overall) | 7,394 (49.8%) | 7,440 (50.2%) |
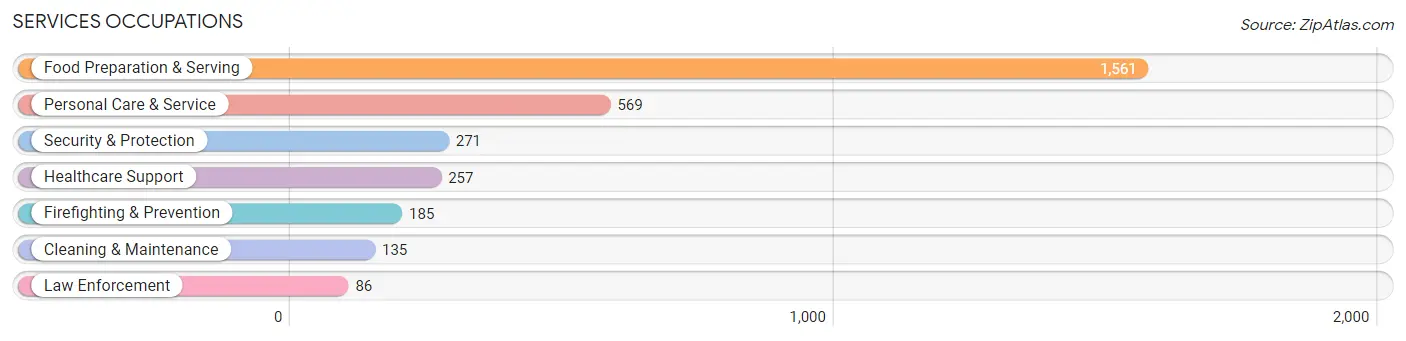
Services Occupations
The most common Services occupations in Ithaca are Food Preparation & Serving (1,561 | 10.5%), Personal Care & Service (569 | 3.8%), Security & Protection (271 | 1.8%), Healthcare Support (257 | 1.7%), and Firefighting & Prevention (185 | 1.3%).
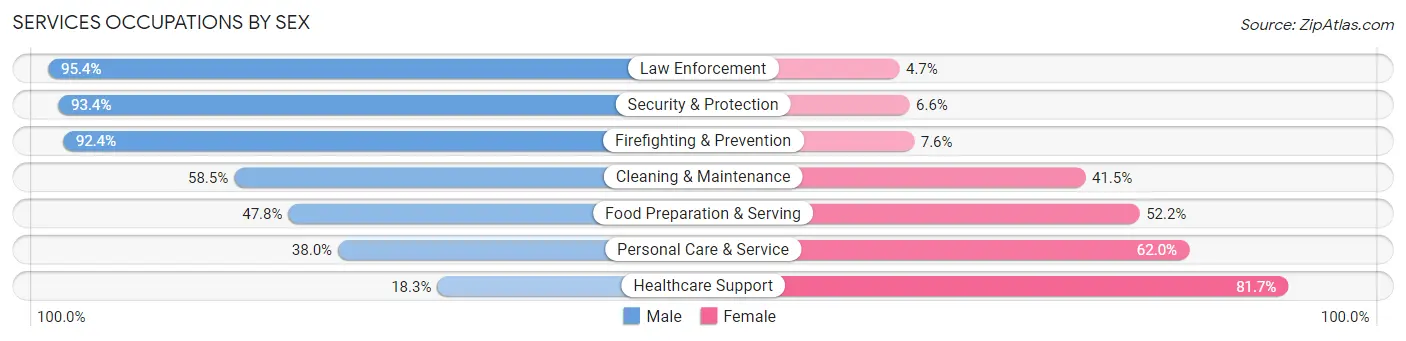
Services Occupations by Sex
Within the Services occupations in Ithaca, the most male-oriented occupations are Law Enforcement (95.4%), Security & Protection (93.4%), and Firefighting & Prevention (92.4%), while the most female-oriented occupations are Healthcare Support (81.7%), Personal Care & Service (62.0%), and Food Preparation & Serving (52.2%).
| Occupation | Male | Female |
| Healthcare Support | 47 (18.3%) | 210 (81.7%) |
| Security & Protection | 253 (93.4%) | 18 (6.6%) |
| Firefighting & Prevention | 171 (92.4%) | 14 (7.6%) |
| Law Enforcement | 82 (95.4%) | 4 (4.6%) |
| Food Preparation & Serving | 746 (47.8%) | 815 (52.2%) |
| Cleaning & Maintenance | 79 (58.5%) | 56 (41.5%) |
| Personal Care & Service | 216 (38.0%) | 353 (62.0%) |
| Total (Category) | 1,341 (48.0%) | 1,452 (52.0%) |
| Total (Overall) | 7,394 (49.8%) | 7,440 (50.2%) |
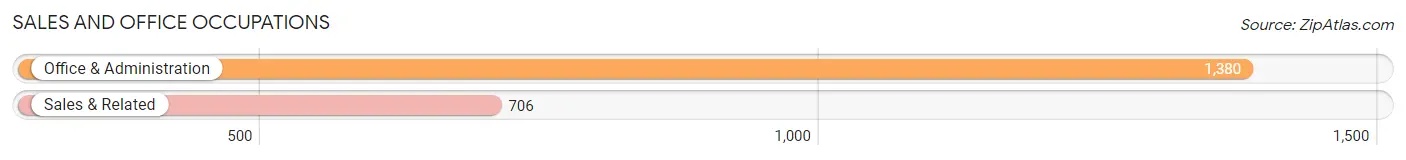
Sales and Office Occupations
The most common Sales and Office occupations in Ithaca are Office & Administration (1,380 | 9.3%), and Sales & Related (706 | 4.8%).
Sales and Office Occupations by Sex
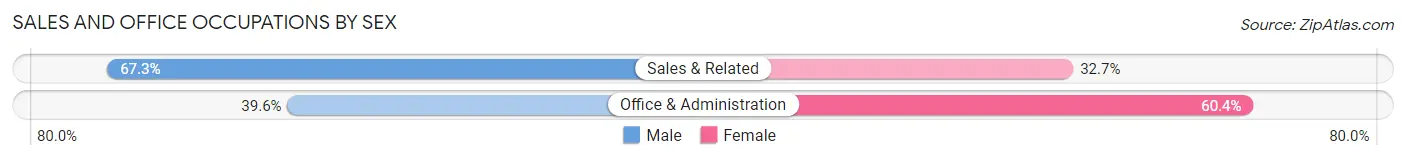
| Occupation | Male | Female |
| Sales & Related | 475 (67.3%) | 231 (32.7%) |
| Office & Administration | 546 (39.6%) | 834 (60.4%) |
| Total (Category) | 1,021 (48.9%) | 1,065 (51.0%) |
| Total (Overall) | 7,394 (49.8%) | 7,440 (50.2%) |
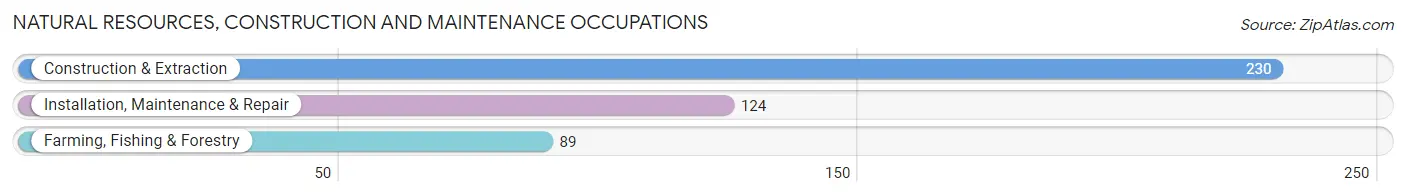
Natural Resources, Construction and Maintenance Occupations
The most common Natural Resources, Construction and Maintenance occupations in Ithaca are Construction & Extraction (230 | 1.5%), Installation, Maintenance & Repair (124 | 0.8%), and Farming, Fishing & Forestry (89 | 0.6%).
Natural Resources, Construction and Maintenance Occupations by Sex
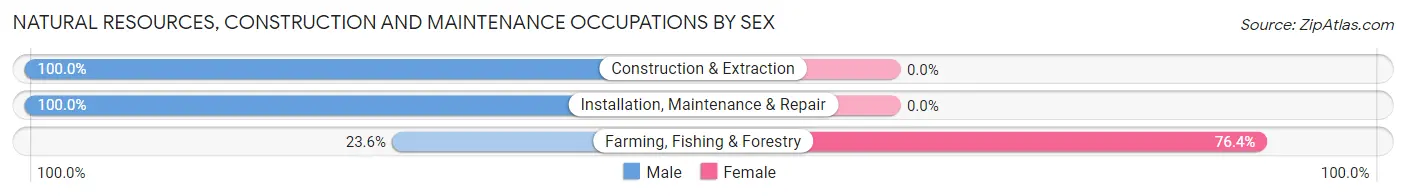
| Occupation | Male | Female |
| Farming, Fishing & Forestry | 21 (23.6%) | 68 (76.4%) |
| Construction & Extraction | 230 (100.0%) | 0 (0.0%) |
| Installation, Maintenance & Repair | 124 (100.0%) | 0 (0.0%) |
| Total (Category) | 375 (84.7%) | 68 (15.3%) |
| Total (Overall) | 7,394 (49.8%) | 7,440 (50.2%) |
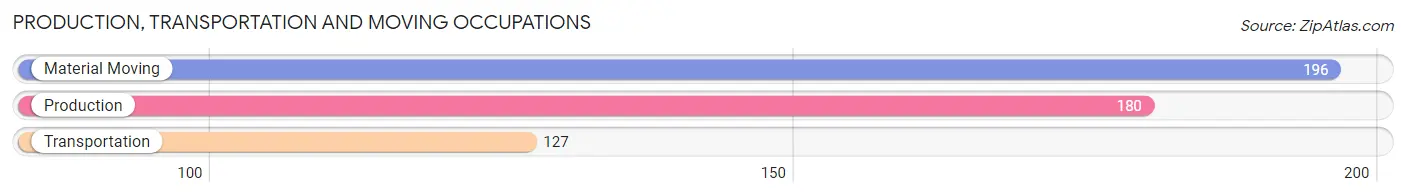
Production, Transportation and Moving Occupations
The most common Production, Transportation and Moving occupations in Ithaca are Material Moving (196 | 1.3%), Production (180 | 1.2%), and Transportation (127 | 0.9%).
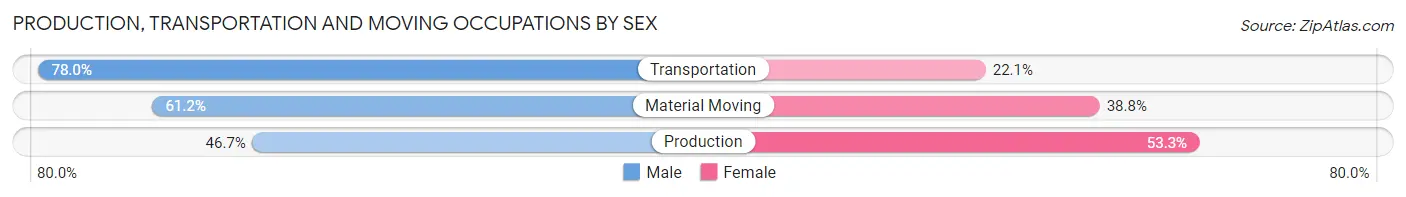
Production, Transportation and Moving Occupations by Sex
| Occupation | Male | Female |
| Production | 84 (46.7%) | 96 (53.3%) |
| Transportation | 99 (77.9%) | 28 (22.1%) |
| Material Moving | 120 (61.2%) | 76 (38.8%) |
| Total (Category) | 303 (60.2%) | 200 (39.8%) |
| Total (Overall) | 7,394 (49.8%) | 7,440 (50.2%) |
Employment Industries by Sex in Ithaca
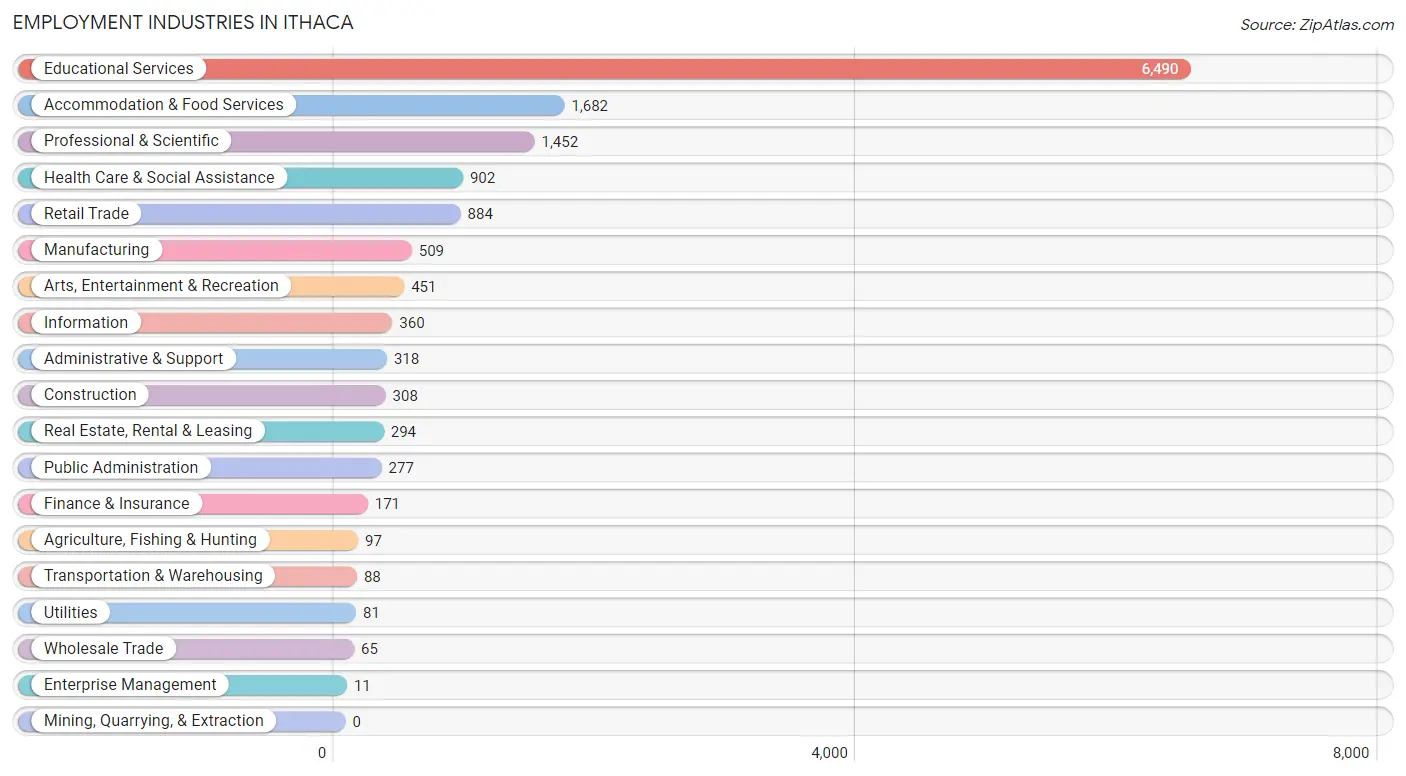
Employment Industries in Ithaca
The major employment industries in Ithaca include Educational Services (6,490 | 43.8%), Accommodation & Food Services (1,682 | 11.3%), Professional & Scientific (1,452 | 9.8%), Health Care & Social Assistance (902 | 6.1%), and Retail Trade (884 | 6.0%).
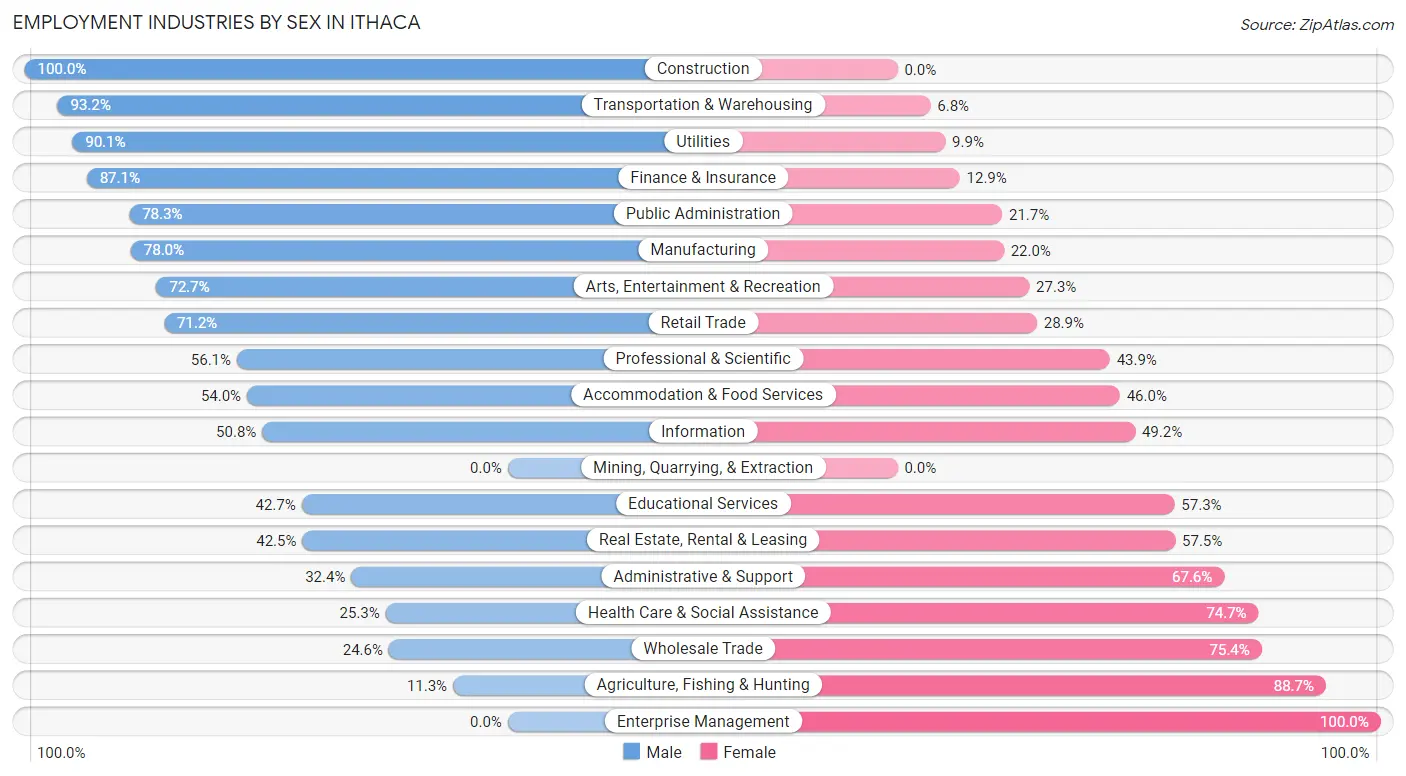
Employment Industries by Sex in Ithaca
The Ithaca industries that see more men than women are Construction (100.0%), Transportation & Warehousing (93.2%), and Utilities (90.1%), whereas the industries that tend to have a higher number of women are Enterprise Management (100.0%), Agriculture, Fishing & Hunting (88.7%), and Wholesale Trade (75.4%).
| Industry | Male | Female |
| Agriculture, Fishing & Hunting | 11 (11.3%) | 86 (88.7%) |
| Mining, Quarrying, & Extraction | 0 (0.0%) | 0 (0.0%) |
| Construction | 308 (100.0%) | 0 (0.0%) |
| Manufacturing | 397 (78.0%) | 112 (22.0%) |
| Wholesale Trade | 16 (24.6%) | 49 (75.4%) |
| Retail Trade | 629 (71.2%) | 255 (28.8%) |
| Transportation & Warehousing | 82 (93.2%) | 6 (6.8%) |
| Utilities | 73 (90.1%) | 8 (9.9%) |
| Information | 183 (50.8%) | 177 (49.2%) |
| Finance & Insurance | 149 (87.1%) | 22 (12.9%) |
| Real Estate, Rental & Leasing | 125 (42.5%) | 169 (57.5%) |
| Professional & Scientific | 814 (56.1%) | 638 (43.9%) |
| Enterprise Management | 0 (0.0%) | 11 (100.0%) |
| Administrative & Support | 103 (32.4%) | 215 (67.6%) |
| Educational Services | 2,769 (42.7%) | 3,721 (57.3%) |
| Health Care & Social Assistance | 228 (25.3%) | 674 (74.7%) |
| Arts, Entertainment & Recreation | 328 (72.7%) | 123 (27.3%) |
| Accommodation & Food Services | 908 (54.0%) | 774 (46.0%) |
| Public Administration | 217 (78.3%) | 60 (21.7%) |
| Total | 7,394 (49.8%) | 7,440 (50.2%) |
Education in Ithaca
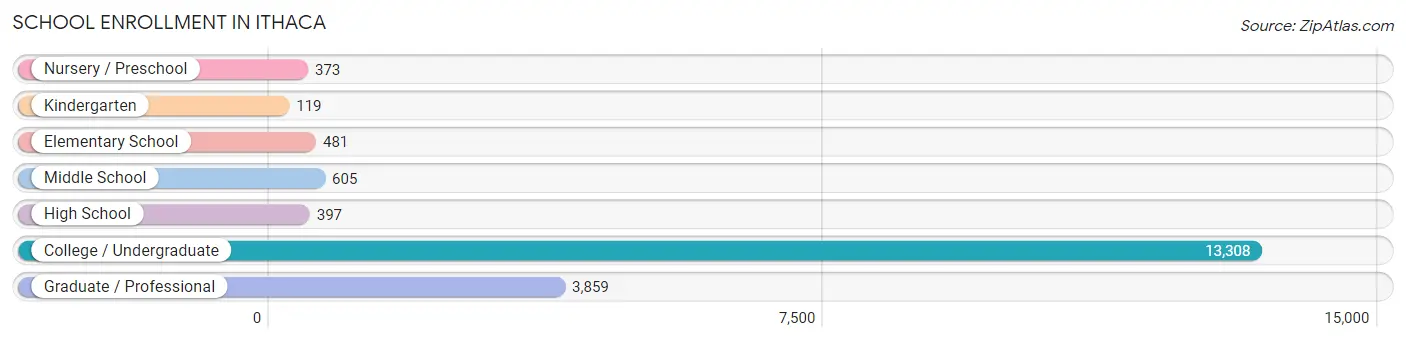
School Enrollment in Ithaca
The most common levels of schooling among the 19,142 students in Ithaca are college / undergraduate (13,308 | 69.5%), graduate / professional (3,859 | 20.2%), and middle school (605 | 3.2%).
| School Level | # Students | % Students |
| Nursery / Preschool | 373 | 1.9% |
| Kindergarten | 119 | 0.6% |
| Elementary School | 481 | 2.5% |
| Middle School | 605 | 3.2% |
| High School | 397 | 2.1% |
| College / Undergraduate | 13,308 | 69.5% |
| Graduate / Professional | 3,859 | 20.2% |
| Total | 19,142 | 100.0% |
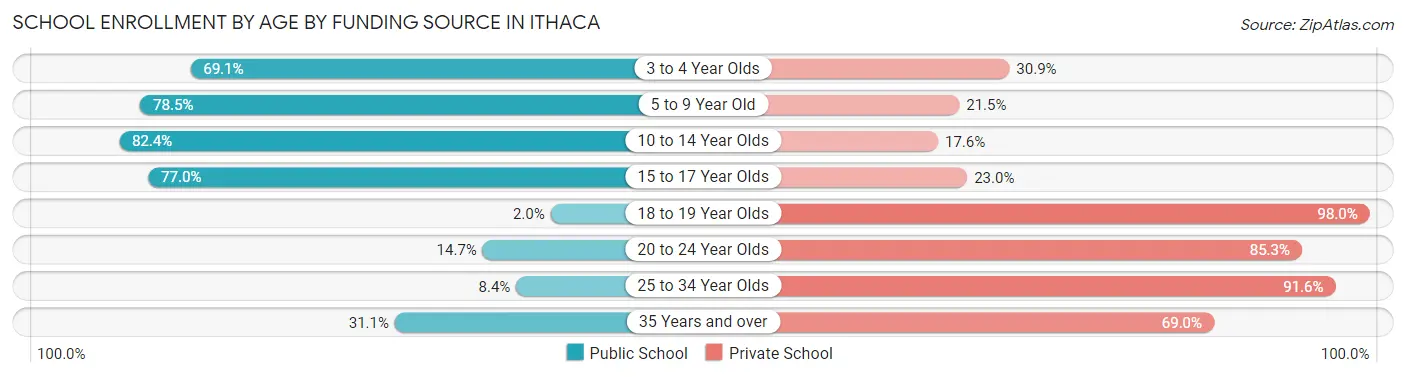
School Enrollment by Age by Funding Source in Ithaca
Out of a total of 19,142 students who are enrolled in schools in Ithaca, 15,735 (82.2%) attend a private institution, while the remaining 3,407 (17.8%) are enrolled in public schools. The age group of 18 to 19 year olds has the highest likelihood of being enrolled in private schools, with 5,044 (98.0% in the age bracket) enrolled. Conversely, the age group of 10 to 14 year olds has the lowest likelihood of being enrolled in a private school, with 572 (82.4% in the age bracket) attending a public institution.
| Age Bracket | Public School | Private School |
| 3 to 4 Year Olds | 215 (69.1%) | 96 (30.9%) |
| 5 to 9 Year Old | 503 (78.5%) | 138 (21.5%) |
| 10 to 14 Year Olds | 572 (82.4%) | 122 (17.6%) |
| 15 to 17 Year Olds | 291 (77.0%) | 87 (23.0%) |
| 18 to 19 Year Olds | 105 (2.0%) | 5,044 (98.0%) |
| 20 to 24 Year Olds | 1,420 (14.7%) | 8,253 (85.3%) |
| 25 to 34 Year Olds | 152 (8.4%) | 1,648 (91.6%) |
| 35 Years and over | 154 (31.0%) | 342 (69.0%) |
| Total | 3,407 (17.8%) | 15,735 (82.2%) |
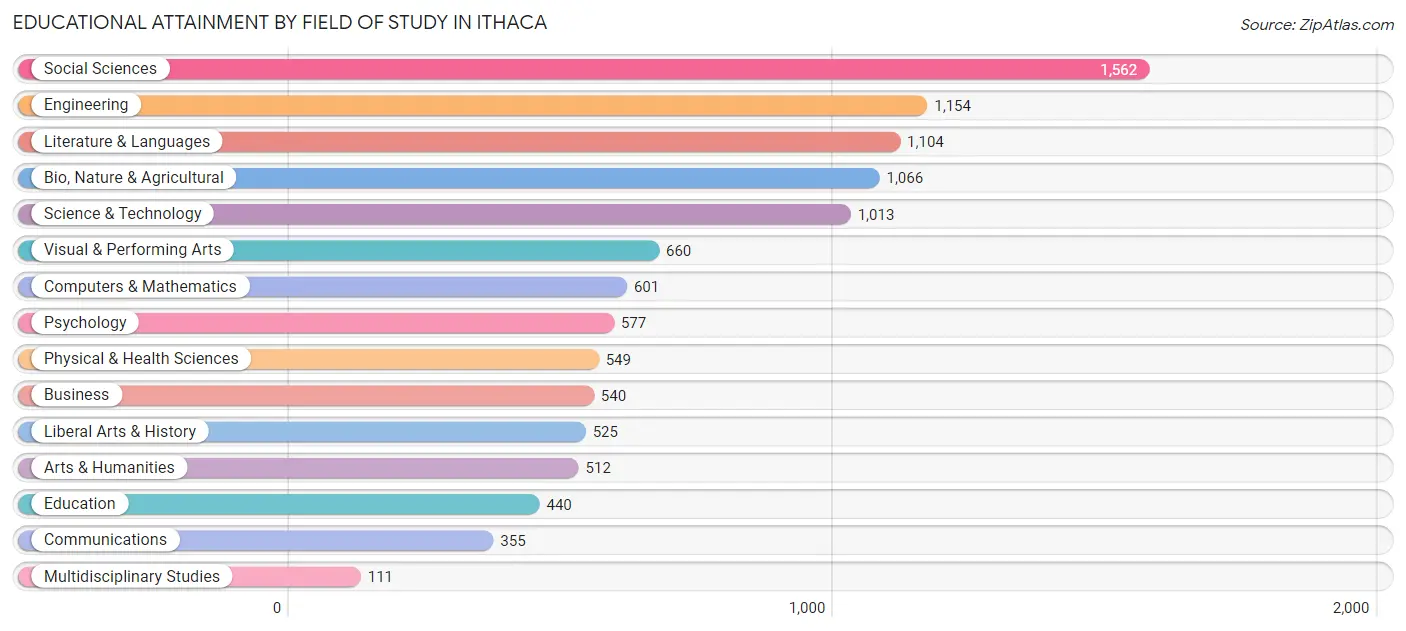
Educational Attainment by Field of Study in Ithaca
Social sciences (1,562 | 14.5%), engineering (1,154 | 10.7%), literature & languages (1,104 | 10.2%), bio, nature & agricultural (1,066 | 9.9%), and science & technology (1,013 | 9.4%) are the most common fields of study among 10,769 individuals in Ithaca who have obtained a bachelor's degree or higher.
| Field of Study | # Graduates | % Graduates |
| Computers & Mathematics | 601 | 5.6% |
| Bio, Nature & Agricultural | 1,066 | 9.9% |
| Physical & Health Sciences | 549 | 5.1% |
| Psychology | 577 | 5.4% |
| Social Sciences | 1,562 | 14.5% |
| Engineering | 1,154 | 10.7% |
| Multidisciplinary Studies | 111 | 1.0% |
| Science & Technology | 1,013 | 9.4% |
| Business | 540 | 5.0% |
| Education | 440 | 4.1% |
| Literature & Languages | 1,104 | 10.2% |
| Liberal Arts & History | 525 | 4.9% |
| Visual & Performing Arts | 660 | 6.1% |
| Communications | 355 | 3.3% |
| Arts & Humanities | 512 | 4.8% |
| Total | 10,769 | 100.0% |
Transportation & Commute in Ithaca
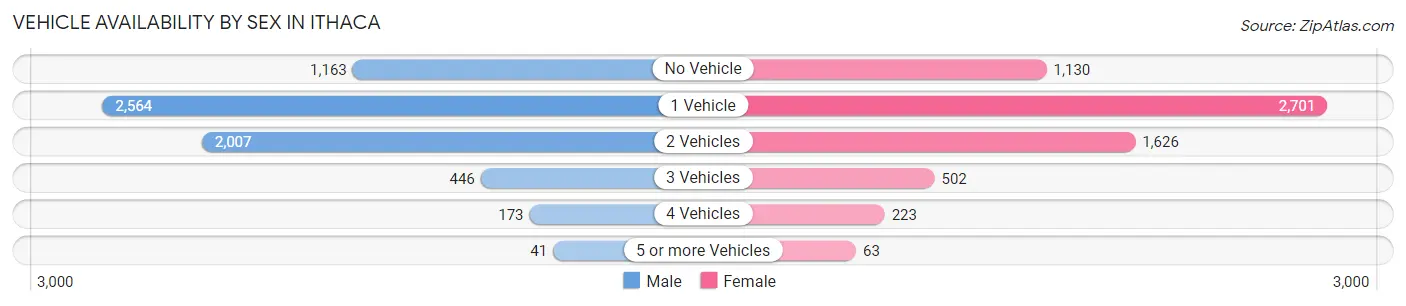
Vehicle Availability by Sex in Ithaca
The most prevalent vehicle ownership categories in Ithaca are males with 1 vehicle (2,564, accounting for 40.1%) and females with 1 vehicle (2,701, making up 41.1%).
| Vehicles Available | Male | Female |
| No Vehicle | 1,163 (18.2%) | 1,130 (18.1%) |
| 1 Vehicle | 2,564 (40.1%) | 2,701 (43.2%) |
| 2 Vehicles | 2,007 (31.4%) | 1,626 (26.0%) |
| 3 Vehicles | 446 (7.0%) | 502 (8.0%) |
| 4 Vehicles | 173 (2.7%) | 223 (3.6%) |
| 5 or more Vehicles | 41 (0.6%) | 63 (1.0%) |
| Total | 6,394 (100.0%) | 6,245 (100.0%) |
Commute Time in Ithaca
The most frequently occuring commute durations in Ithaca are 10 to 14 minutes (2,787 commuters, 25.1%), 15 to 19 minutes (2,247 commuters, 20.3%), and 5 to 9 minutes (1,762 commuters, 15.9%).
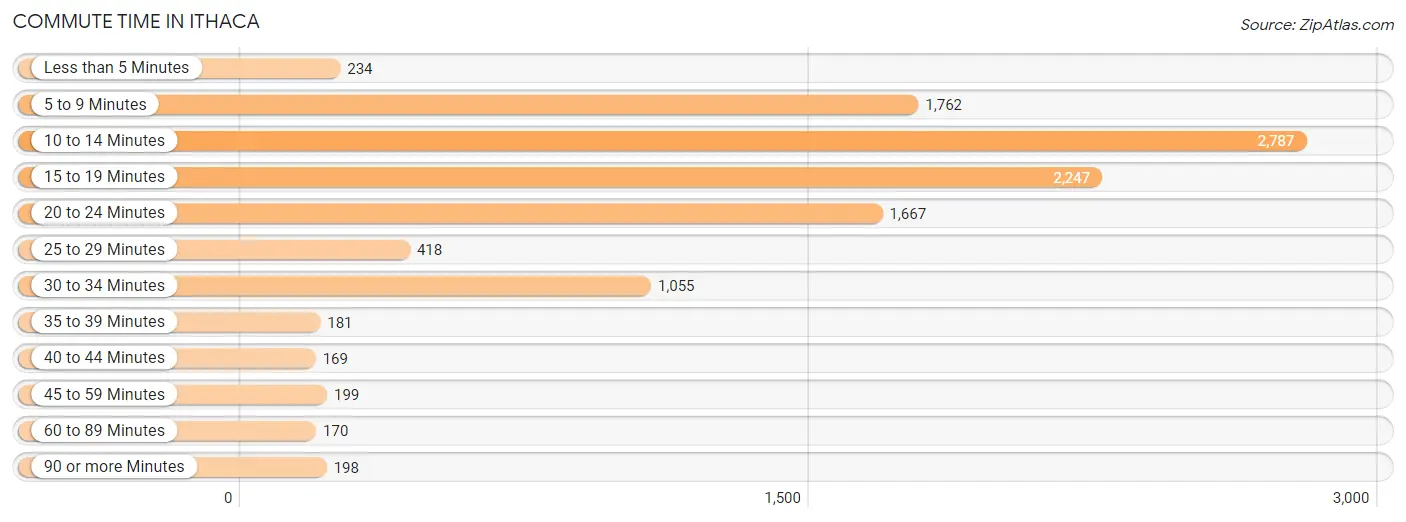
| Commute Time | # Commuters | % Commuters |
| Less than 5 Minutes | 234 | 2.1% |
| 5 to 9 Minutes | 1,762 | 15.9% |
| 10 to 14 Minutes | 2,787 | 25.1% |
| 15 to 19 Minutes | 2,247 | 20.3% |
| 20 to 24 Minutes | 1,667 | 15.0% |
| 25 to 29 Minutes | 418 | 3.8% |
| 30 to 34 Minutes | 1,055 | 9.5% |
| 35 to 39 Minutes | 181 | 1.6% |
| 40 to 44 Minutes | 169 | 1.5% |
| 45 to 59 Minutes | 199 | 1.8% |
| 60 to 89 Minutes | 170 | 1.5% |
| 90 or more Minutes | 198 | 1.8% |
Commute Time by Sex in Ithaca
The most common commute times in Ithaca are 10 to 14 minutes (1,500 commuters, 27.6%) for males and 10 to 14 minutes (1,287 commuters, 22.8%) for females.
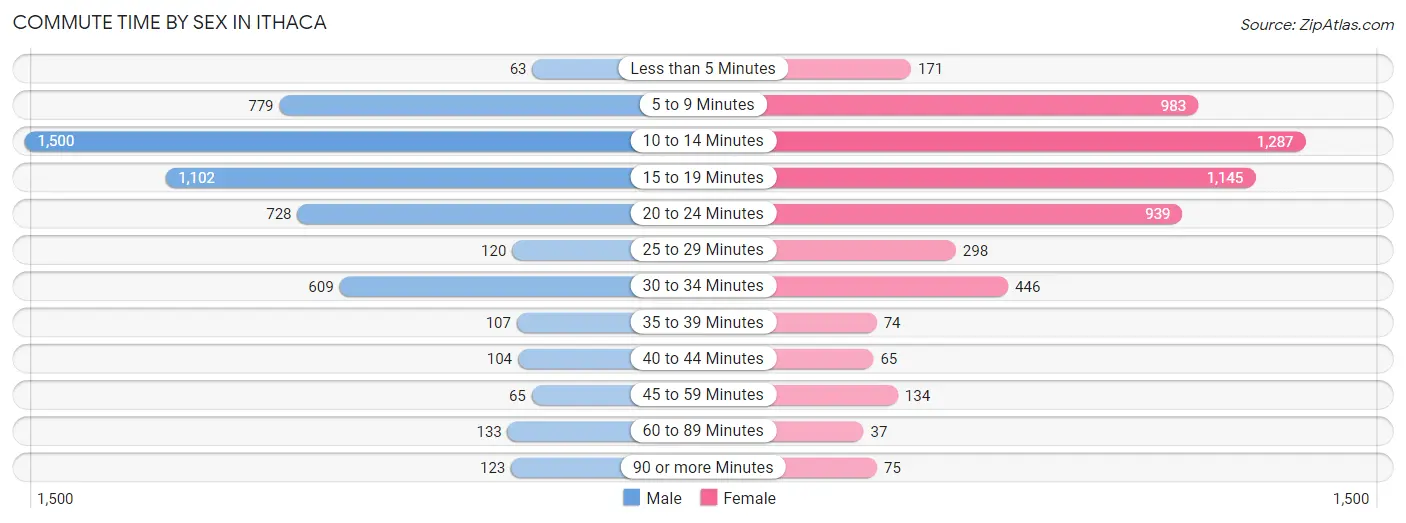
| Commute Time | Male | Female |
| Less than 5 Minutes | 63 (1.2%) | 171 (3.0%) |
| 5 to 9 Minutes | 779 (14.3%) | 983 (17.4%) |
| 10 to 14 Minutes | 1,500 (27.6%) | 1,287 (22.8%) |
| 15 to 19 Minutes | 1,102 (20.3%) | 1,145 (20.3%) |
| 20 to 24 Minutes | 728 (13.4%) | 939 (16.6%) |
| 25 to 29 Minutes | 120 (2.2%) | 298 (5.3%) |
| 30 to 34 Minutes | 609 (11.2%) | 446 (7.9%) |
| 35 to 39 Minutes | 107 (2.0%) | 74 (1.3%) |
| 40 to 44 Minutes | 104 (1.9%) | 65 (1.1%) |
| 45 to 59 Minutes | 65 (1.2%) | 134 (2.4%) |
| 60 to 89 Minutes | 133 (2.5%) | 37 (0.6%) |
| 90 or more Minutes | 123 (2.3%) | 75 (1.3%) |
Time of Departure to Work by Sex in Ithaca
The most frequent times of departure to work in Ithaca are 9:00 AM to 9:59 AM (1,101, 20.3%) for males and 8:30 AM to 8:59 AM (896, 15.9%) for females.
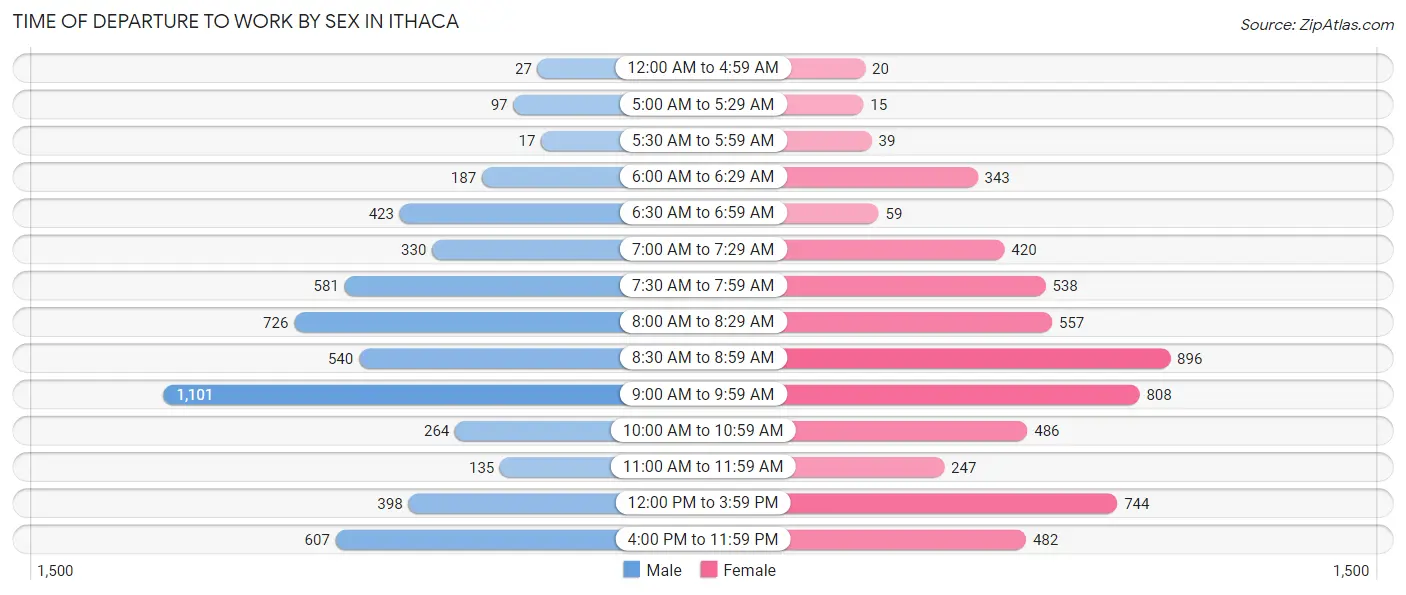
| Time of Departure | Male | Female |
| 12:00 AM to 4:59 AM | 27 (0.5%) | 20 (0.4%) |
| 5:00 AM to 5:29 AM | 97 (1.8%) | 15 (0.3%) |
| 5:30 AM to 5:59 AM | 17 (0.3%) | 39 (0.7%) |
| 6:00 AM to 6:29 AM | 187 (3.4%) | 343 (6.1%) |
| 6:30 AM to 6:59 AM | 423 (7.8%) | 59 (1.0%) |
| 7:00 AM to 7:29 AM | 330 (6.1%) | 420 (7.4%) |
| 7:30 AM to 7:59 AM | 581 (10.7%) | 538 (9.5%) |
| 8:00 AM to 8:29 AM | 726 (13.4%) | 557 (9.9%) |
| 8:30 AM to 8:59 AM | 540 (9.9%) | 896 (15.9%) |
| 9:00 AM to 9:59 AM | 1,101 (20.3%) | 808 (14.3%) |
| 10:00 AM to 10:59 AM | 264 (4.9%) | 486 (8.6%) |
| 11:00 AM to 11:59 AM | 135 (2.5%) | 247 (4.4%) |
| 12:00 PM to 3:59 PM | 398 (7.3%) | 744 (13.2%) |
| 4:00 PM to 11:59 PM | 607 (11.2%) | 482 (8.5%) |
| Total | 5,433 (100.0%) | 5,654 (100.0%) |
Housing Occupancy in Ithaca
Occupancy by Ownership in Ithaca
Of the total 13,233 dwellings in Ithaca, owner-occupied units account for 3,603 (27.2%), while renter-occupied units make up 9,630 (72.8%).
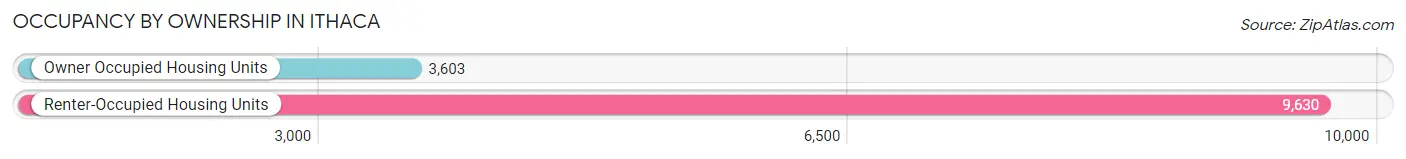
| Occupancy | # Housing Units | % Housing Units |
| Owner Occupied Housing Units | 3,603 | 27.2% |
| Renter-Occupied Housing Units | 9,630 | 72.8% |
| Total Occupied Housing Units | 13,233 | 100.0% |
Occupancy by Household Size in Ithaca
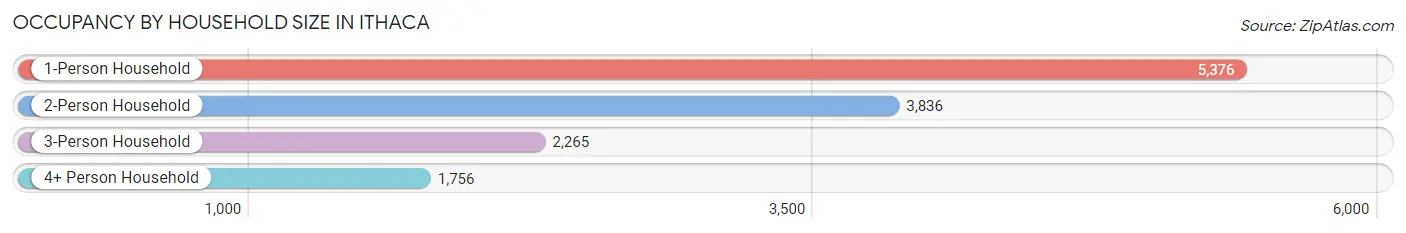
| Household Size | # Housing Units | % Housing Units |
| 1-Person Household | 5,376 | 40.6% |
| 2-Person Household | 3,836 | 29.0% |
| 3-Person Household | 2,265 | 17.1% |
| 4+ Person Household | 1,756 | 13.3% |
| Total Housing Units | 13,233 | 100.0% |
Occupancy by Ownership by Household Size in Ithaca
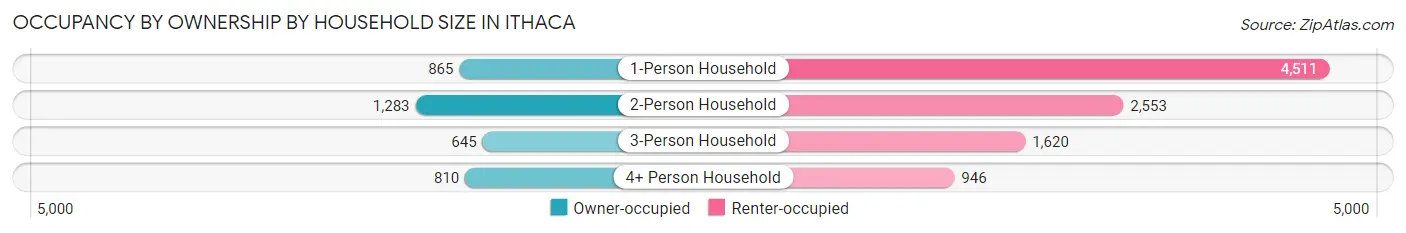
| Household Size | Owner-occupied | Renter-occupied |
| 1-Person Household | 865 (16.1%) | 4,511 (83.9%) |
| 2-Person Household | 1,283 (33.5%) | 2,553 (66.5%) |
| 3-Person Household | 645 (28.5%) | 1,620 (71.5%) |
| 4+ Person Household | 810 (46.1%) | 946 (53.9%) |
| Total Housing Units | 3,603 (27.2%) | 9,630 (72.8%) |
Occupancy by Educational Attainment in Ithaca
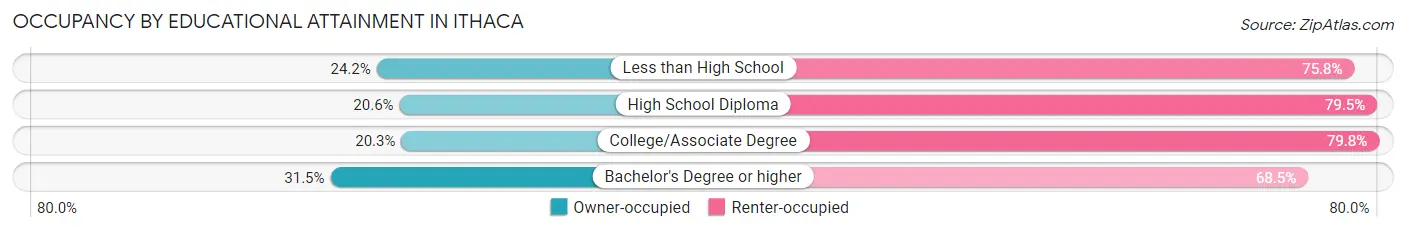
| Household Size | Owner-occupied | Renter-occupied |
| Less than High School | 58 (24.2%) | 182 (75.8%) |
| High School Diploma | 238 (20.5%) | 920 (79.4%) |
| College/Associate Degree | 758 (20.3%) | 2,985 (79.7%) |
| Bachelor's Degree or higher | 2,549 (31.5%) | 5,543 (68.5%) |
Occupancy by Age of Householder in Ithaca
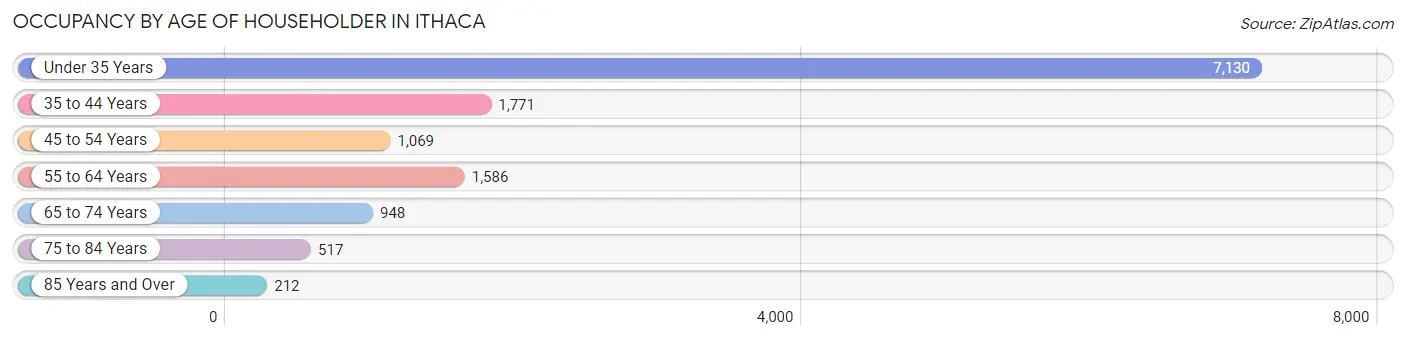
| Age Bracket | # Households | % Households |
| Under 35 Years | 7,130 | 53.9% |
| 35 to 44 Years | 1,771 | 13.4% |
| 45 to 54 Years | 1,069 | 8.1% |
| 55 to 64 Years | 1,586 | 12.0% |
| 65 to 74 Years | 948 | 7.2% |
| 75 to 84 Years | 517 | 3.9% |
| 85 Years and Over | 212 | 1.6% |
| Total | 13,233 | 100.0% |
Housing Finances in Ithaca
Median Income by Occupancy in Ithaca
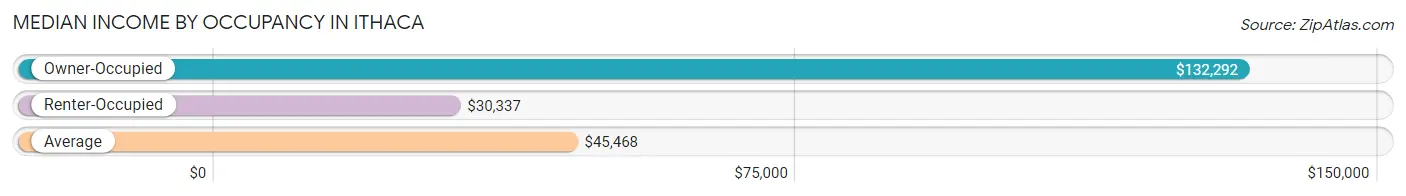
| Occupancy Type | # Households | Median Income |
| Owner-Occupied | 3,603 (27.2%) | $132,292 |
| Renter-Occupied | 9,630 (72.8%) | $30,337 |
| Average | 13,233 (100.0%) | $45,468 |
Occupancy by Householder Income Bracket in Ithaca
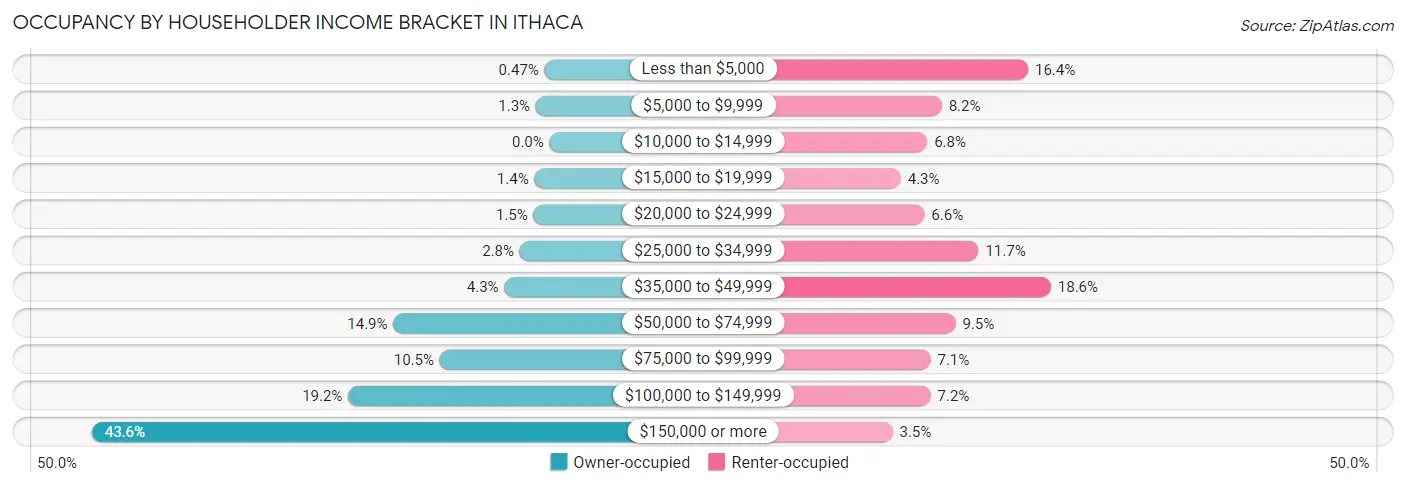
| Income Bracket | Owner-occupied | Renter-occupied |
| Less than $5,000 | 17 (0.5%) | 1,582 (16.4%) |
| $5,000 to $9,999 | 47 (1.3%) | 791 (8.2%) |
| $10,000 to $14,999 | 0 (0.0%) | 658 (6.8%) |
| $15,000 to $19,999 | 52 (1.4%) | 415 (4.3%) |
| $20,000 to $24,999 | 55 (1.5%) | 632 (6.6%) |
| $25,000 to $34,999 | 102 (2.8%) | 1,128 (11.7%) |
| $35,000 to $49,999 | 155 (4.3%) | 1,791 (18.6%) |
| $50,000 to $74,999 | 536 (14.9%) | 917 (9.5%) |
| $75,000 to $99,999 | 377 (10.5%) | 688 (7.1%) |
| $100,000 to $149,999 | 691 (19.2%) | 689 (7.1%) |
| $150,000 or more | 1,571 (43.6%) | 339 (3.5%) |
| Total | 3,603 (100.0%) | 9,630 (100.0%) |
Monthly Housing Cost Tiers in Ithaca
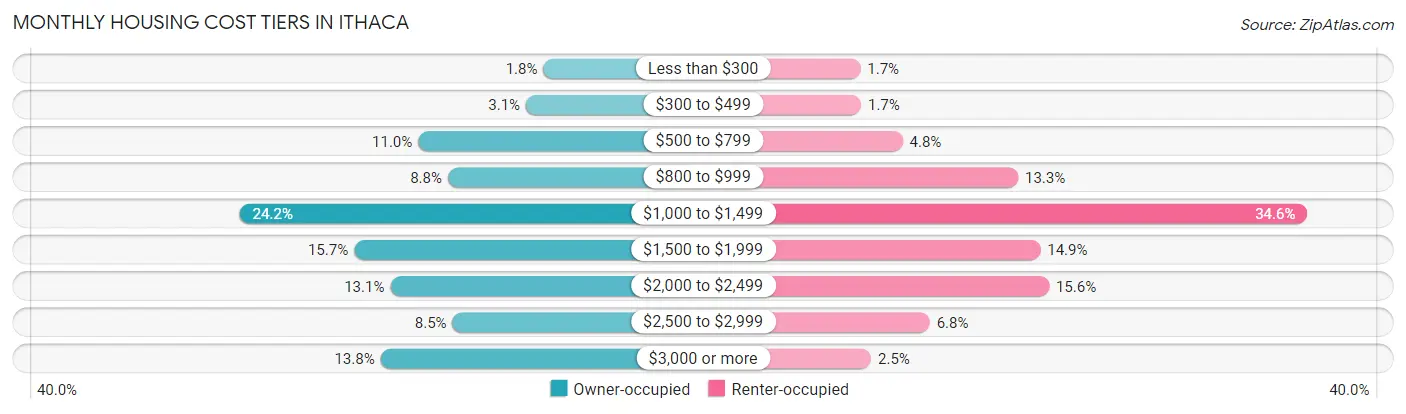
| Monthly Cost | Owner-occupied | Renter-occupied |
| Less than $300 | 65 (1.8%) | 163 (1.7%) |
| $300 to $499 | 111 (3.1%) | 168 (1.7%) |
| $500 to $799 | 397 (11.0%) | 462 (4.8%) |
| $800 to $999 | 318 (8.8%) | 1,281 (13.3%) |
| $1,000 to $1,499 | 871 (24.2%) | 3,332 (34.6%) |
| $1,500 to $1,999 | 567 (15.7%) | 1,439 (14.9%) |
| $2,000 to $2,499 | 471 (13.1%) | 1,500 (15.6%) |
| $2,500 to $2,999 | 306 (8.5%) | 655 (6.8%) |
| $3,000 or more | 497 (13.8%) | 239 (2.5%) |
| Total | 3,603 (100.0%) | 9,630 (100.0%) |
Physical Housing Characteristics in Ithaca
Housing Structures in Ithaca
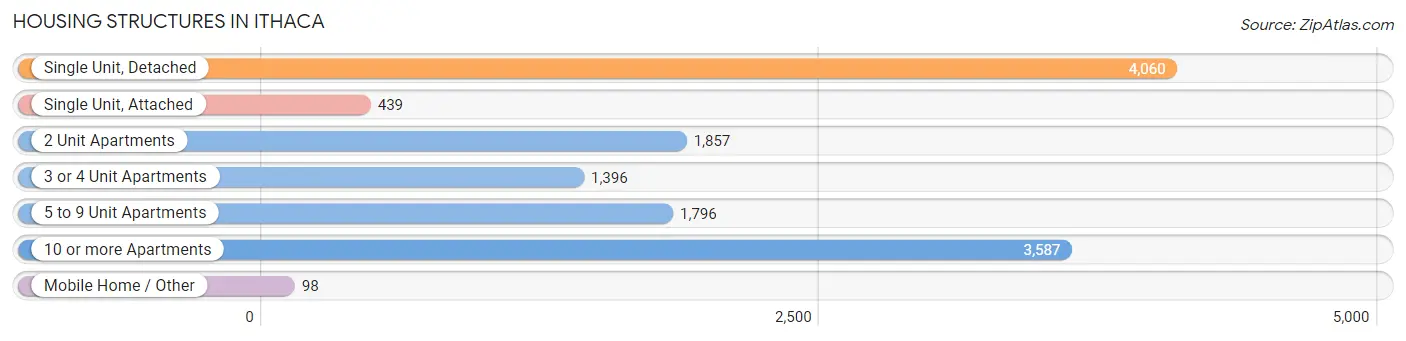
| Structure Type | # Housing Units | % Housing Units |
| Single Unit, Detached | 4,060 | 30.7% |
| Single Unit, Attached | 439 | 3.3% |
| 2 Unit Apartments | 1,857 | 14.0% |
| 3 or 4 Unit Apartments | 1,396 | 10.5% |
| 5 to 9 Unit Apartments | 1,796 | 13.6% |
| 10 or more Apartments | 3,587 | 27.1% |
| Mobile Home / Other | 98 | 0.7% |
| Total | 13,233 | 100.0% |
Housing Structures by Occupancy in Ithaca
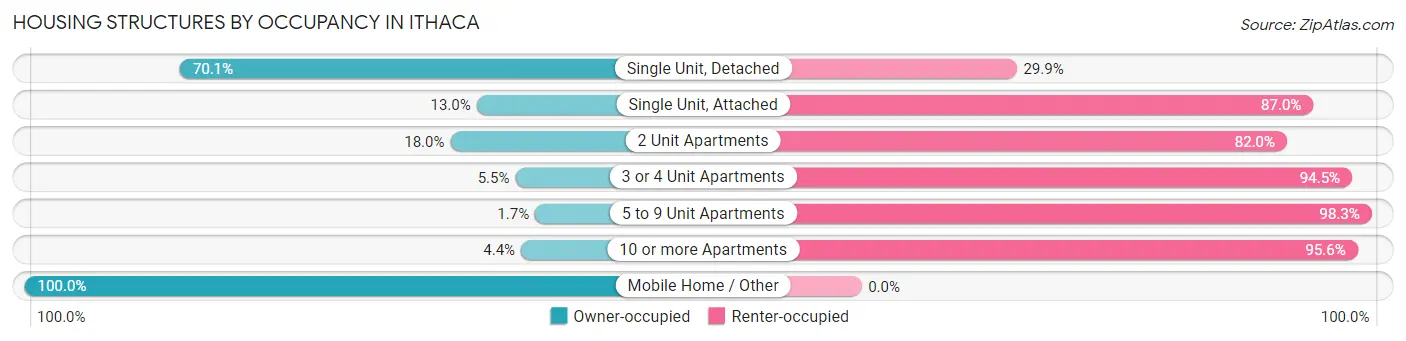
| Structure Type | Owner-occupied | Renter-occupied |
| Single Unit, Detached | 2,846 (70.1%) | 1,214 (29.9%) |
| Single Unit, Attached | 57 (13.0%) | 382 (87.0%) |
| 2 Unit Apartments | 335 (18.0%) | 1,522 (82.0%) |
| 3 or 4 Unit Apartments | 77 (5.5%) | 1,319 (94.5%) |
| 5 to 9 Unit Apartments | 31 (1.7%) | 1,765 (98.3%) |
| 10 or more Apartments | 159 (4.4%) | 3,428 (95.6%) |
| Mobile Home / Other | 98 (100.0%) | 0 (0.0%) |
| Total | 3,603 (27.2%) | 9,630 (72.8%) |
Housing Structures by Number of Rooms in Ithaca
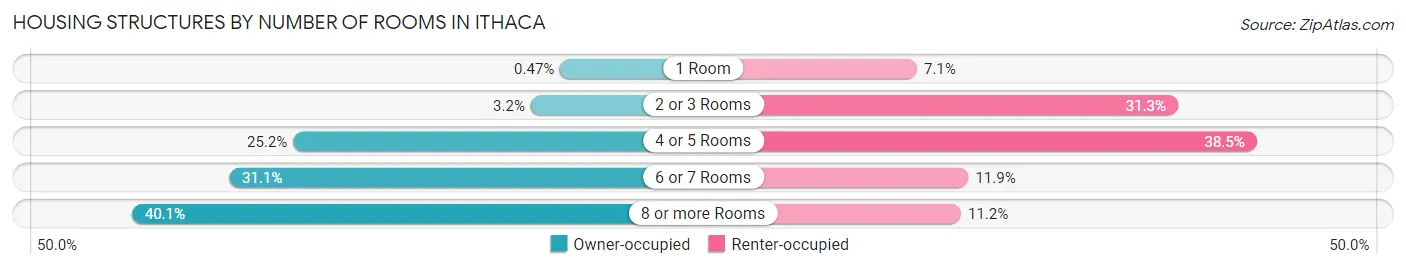
| Number of Rooms | Owner-occupied | Renter-occupied |
| 1 Room | 17 (0.5%) | 687 (7.1%) |
| 2 or 3 Rooms | 115 (3.2%) | 3,009 (31.2%) |
| 4 or 5 Rooms | 907 (25.2%) | 3,710 (38.5%) |
| 6 or 7 Rooms | 1,120 (31.1%) | 1,145 (11.9%) |
| 8 or more Rooms | 1,444 (40.1%) | 1,079 (11.2%) |
| Total | 3,603 (100.0%) | 9,630 (100.0%) |
Housing Structure by Heating Type in Ithaca
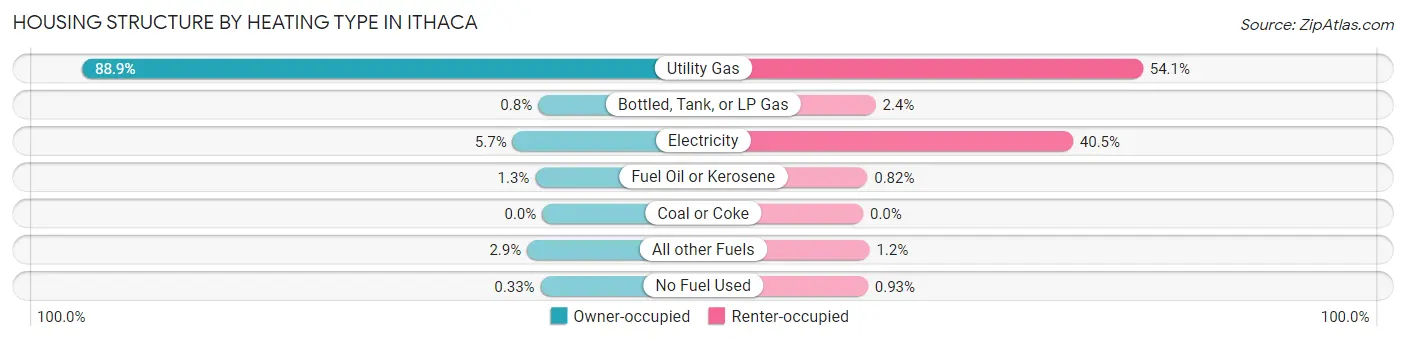
| Heating Type | Owner-occupied | Renter-occupied |
| Utility Gas | 3,203 (88.9%) | 5,206 (54.1%) |
| Bottled, Tank, or LP Gas | 29 (0.8%) | 232 (2.4%) |
| Electricity | 206 (5.7%) | 3,904 (40.5%) |
| Fuel Oil or Kerosene | 48 (1.3%) | 79 (0.8%) |
| Coal or Coke | 0 (0.0%) | 0 (0.0%) |
| All other Fuels | 105 (2.9%) | 119 (1.2%) |
| No Fuel Used | 12 (0.3%) | 90 (0.9%) |
| Total | 3,603 (100.0%) | 9,630 (100.0%) |
Household Vehicle Usage in Ithaca
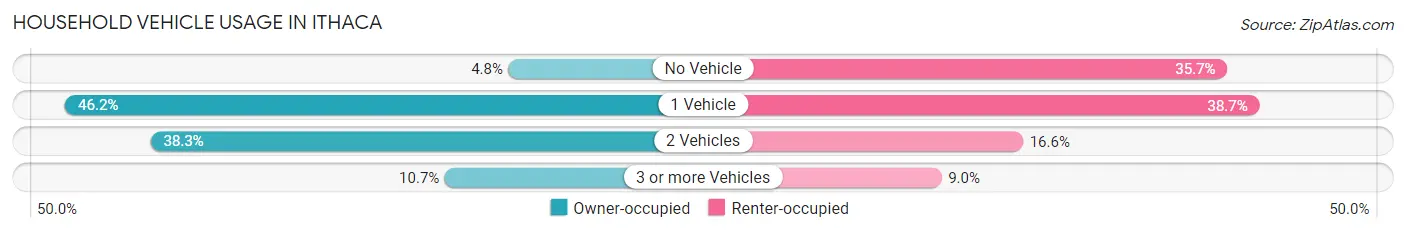
| Vehicles per Household | Owner-occupied | Renter-occupied |
| No Vehicle | 173 (4.8%) | 3,438 (35.7%) |
| 1 Vehicle | 1,665 (46.2%) | 3,727 (38.7%) |
| 2 Vehicles | 1,378 (38.3%) | 1,599 (16.6%) |
| 3 or more Vehicles | 387 (10.7%) | 866 (9.0%) |
| Total | 3,603 (100.0%) | 9,630 (100.0%) |
Real Estate & Mortgages in Ithaca
Real Estate and Mortgage Overview in Ithaca
| Characteristic | Without Mortgage | With Mortgage |
| Housing Units | 1,527 | 2,076 |
| Median Property Value | $290,400 | $345,300 |
| Median Household Income | $80,313 | $1,167 |
| Monthly Housing Costs | $968 | $497 |
| Real Estate Taxes | $7,389 | $22 |
Property Value by Mortgage Status in Ithaca
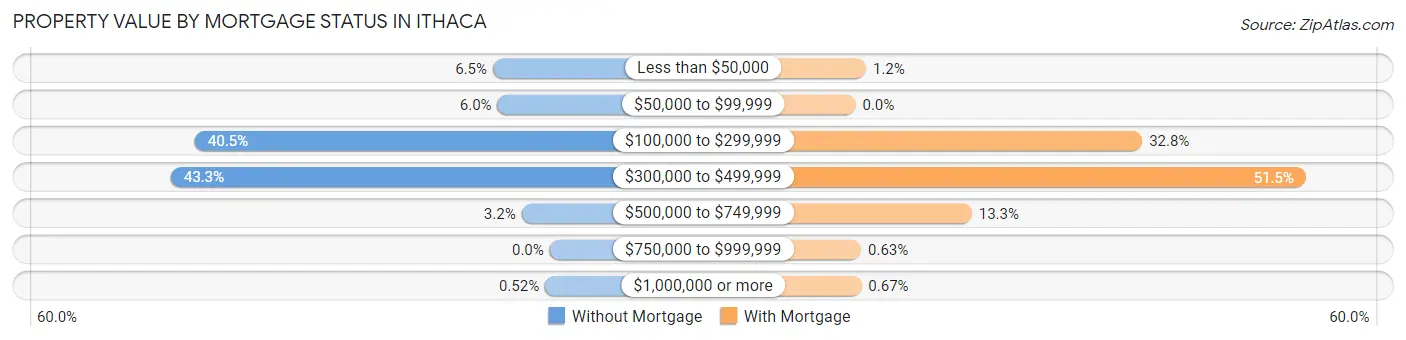
| Property Value | Without Mortgage | With Mortgage |
| Less than $50,000 | 99 (6.5%) | 25 (1.2%) |
| $50,000 to $99,999 | 91 (6.0%) | 0 (0.0%) |
| $100,000 to $299,999 | 619 (40.5%) | 680 (32.8%) |
| $300,000 to $499,999 | 661 (43.3%) | 1,068 (51.4%) |
| $500,000 to $749,999 | 49 (3.2%) | 276 (13.3%) |
| $750,000 to $999,999 | 0 (0.0%) | 13 (0.6%) |
| $1,000,000 or more | 8 (0.5%) | 14 (0.7%) |
| Total | 1,527 (100.0%) | 2,076 (100.0%) |
Household Income by Mortgage Status in Ithaca

| Household Income | Without Mortgage | With Mortgage |
| Less than $10,000 | 64 (4.2%) | 99 (4.8%) |
| $10,000 to $24,999 | 72 (4.7%) | 0 (0.0%) |
| $25,000 to $34,999 | 88 (5.8%) | 35 (1.7%) |
| $35,000 to $49,999 | 59 (3.9%) | 14 (0.7%) |
| $50,000 to $74,999 | 376 (24.6%) | 96 (4.6%) |
| $75,000 to $99,999 | 209 (13.7%) | 160 (7.7%) |
| $100,000 to $149,999 | 255 (16.7%) | 168 (8.1%) |
| $150,000 or more | 404 (26.5%) | 436 (21.0%) |
| Total | 1,527 (100.0%) | 2,076 (100.0%) |
Property Value to Household Income Ratio in Ithaca
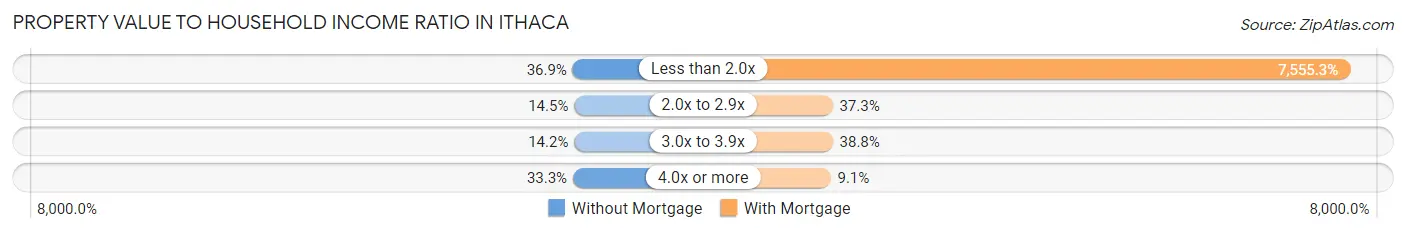
| Value-to-Income Ratio | Without Mortgage | With Mortgage |
| Less than 2.0x | 563 (36.9%) | 156,847 (7,555.2%) |
| 2.0x to 2.9x | 222 (14.5%) | 775 (37.3%) |
| 3.0x to 3.9x | 217 (14.2%) | 806 (38.8%) |
| 4.0x or more | 508 (33.3%) | 189 (9.1%) |
| Total | 1,527 (100.0%) | 2,076 (100.0%) |
Real Estate Taxes by Mortgage Status in Ithaca
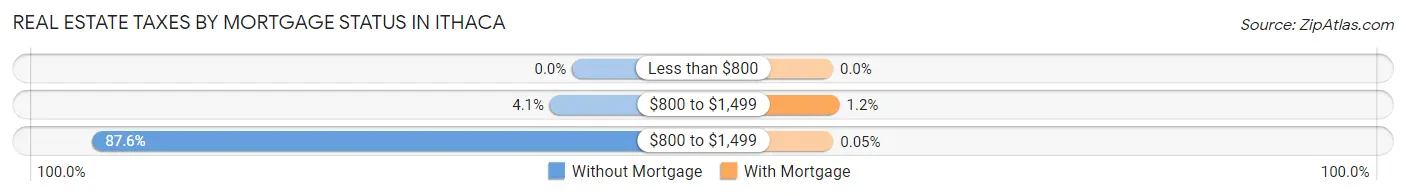
| Property Taxes | Without Mortgage | With Mortgage |
| Less than $800 | 0 (0.0%) | 0 (0.0%) |
| $800 to $1,499 | 62 (4.1%) | 25 (1.2%) |
| $800 to $1,499 | 1,338 (87.6%) | 1 (0.1%) |
| Total | 1,527 (100.0%) | 2,076 (100.0%) |
Health & Disability in Ithaca
Health Insurance Coverage by Age in Ithaca
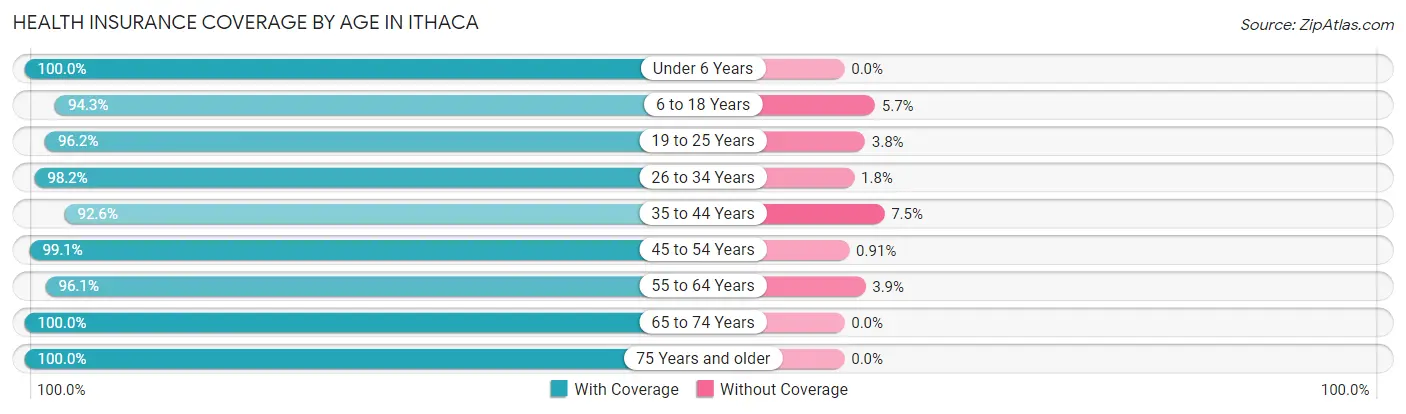
| Age Bracket | With Coverage | Without Coverage |
| Under 6 Years | 713 (100.0%) | 0 (0.0%) |
| 6 to 18 Years | 3,529 (94.3%) | 213 (5.7%) |
| 19 to 25 Years | 13,699 (96.2%) | 546 (3.8%) |
| 26 to 34 Years | 3,271 (98.2%) | 61 (1.8%) |
| 35 to 44 Years | 2,758 (92.5%) | 222 (7.4%) |
| 45 to 54 Years | 1,639 (99.1%) | 15 (0.9%) |
| 55 to 64 Years | 2,162 (96.1%) | 88 (3.9%) |
| 65 to 74 Years | 1,339 (100.0%) | 0 (0.0%) |
| 75 Years and older | 961 (100.0%) | 0 (0.0%) |
| Total | 30,071 (96.3%) | 1,145 (3.7%) |
Health Insurance Coverage by Citizenship Status in Ithaca
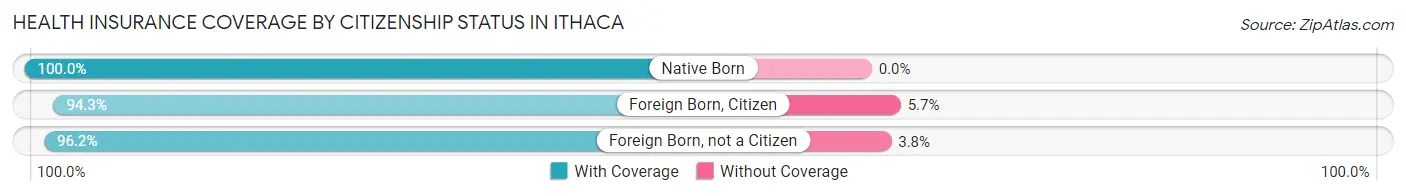
| Citizenship Status | With Coverage | Without Coverage |
| Native Born | 713 (100.0%) | 0 (0.0%) |
| Foreign Born, Citizen | 3,529 (94.3%) | 213 (5.7%) |
| Foreign Born, not a Citizen | 13,699 (96.2%) | 546 (3.8%) |
Health Insurance Coverage by Household Income in Ithaca
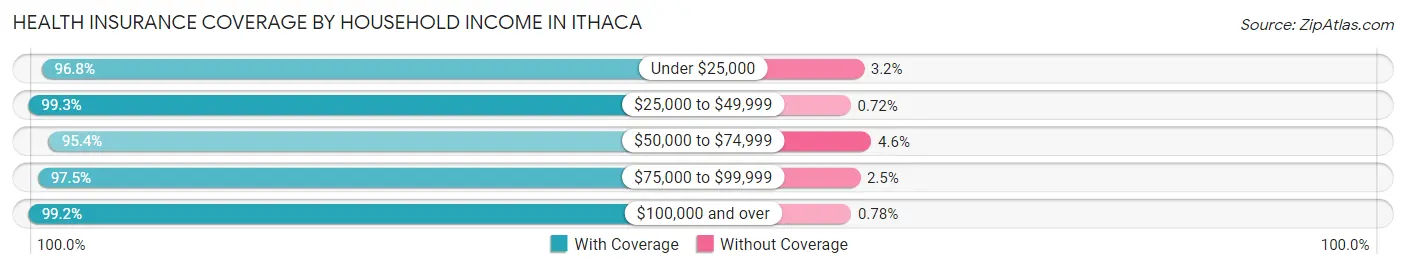
| Household Income | With Coverage | Without Coverage |
| Under $25,000 | 6,150 (96.8%) | 202 (3.2%) |
| $25,000 to $49,999 | 4,968 (99.3%) | 36 (0.7%) |
| $50,000 to $74,999 | 2,303 (95.4%) | 110 (4.6%) |
| $75,000 to $99,999 | 1,943 (97.5%) | 49 (2.5%) |
| $100,000 and over | 7,969 (99.2%) | 63 (0.8%) |
Public vs Private Health Insurance Coverage by Age in Ithaca
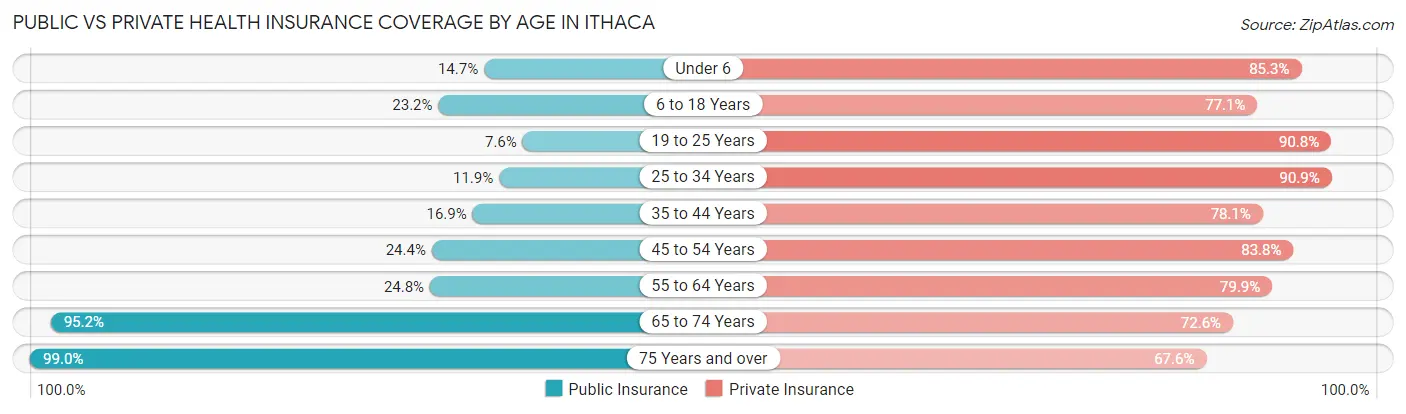
| Age Bracket | Public Insurance | Private Insurance |
| Under 6 | 105 (14.7%) | 608 (85.3%) |
| 6 to 18 Years | 868 (23.2%) | 2,886 (77.1%) |
| 19 to 25 Years | 1,077 (7.6%) | 12,934 (90.8%) |
| 25 to 34 Years | 398 (11.9%) | 3,029 (90.9%) |
| 35 to 44 Years | 502 (16.9%) | 2,328 (78.1%) |
| 45 to 54 Years | 404 (24.4%) | 1,386 (83.8%) |
| 55 to 64 Years | 557 (24.8%) | 1,797 (79.9%) |
| 65 to 74 Years | 1,274 (95.2%) | 972 (72.6%) |
| 75 Years and over | 951 (99.0%) | 650 (67.6%) |
| Total | 6,136 (19.7%) | 26,590 (85.2%) |
Disability Status by Sex by Age in Ithaca
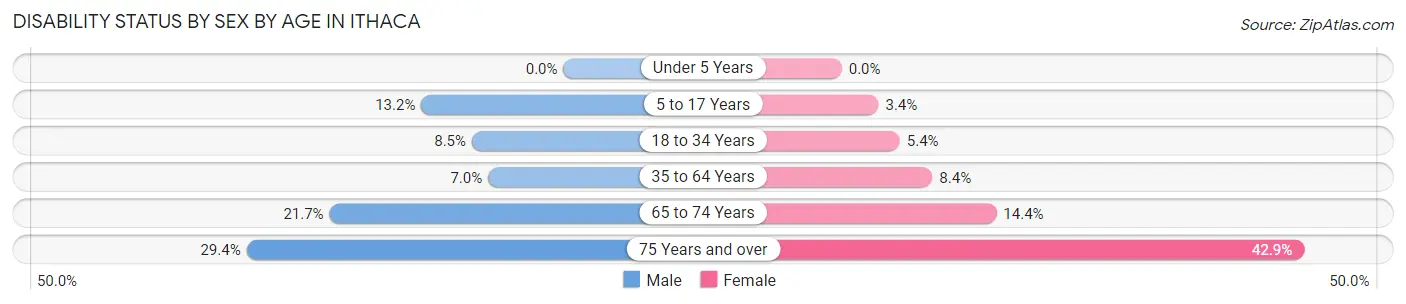
| Age Bracket | Male | Female |
| Under 5 Years | 0 (0.0%) | 0 (0.0%) |
| 5 to 17 Years | 108 (13.2%) | 32 (3.4%) |
| 18 to 34 Years | 857 (8.5%) | 521 (5.4%) |
| 35 to 64 Years | 241 (7.0%) | 289 (8.4%) |
| 65 to 74 Years | 150 (21.7%) | 93 (14.3%) |
| 75 Years and over | 90 (29.4%) | 281 (42.9%) |
Disability Class by Sex by Age in Ithaca
Disability Class: Hearing Difficulty
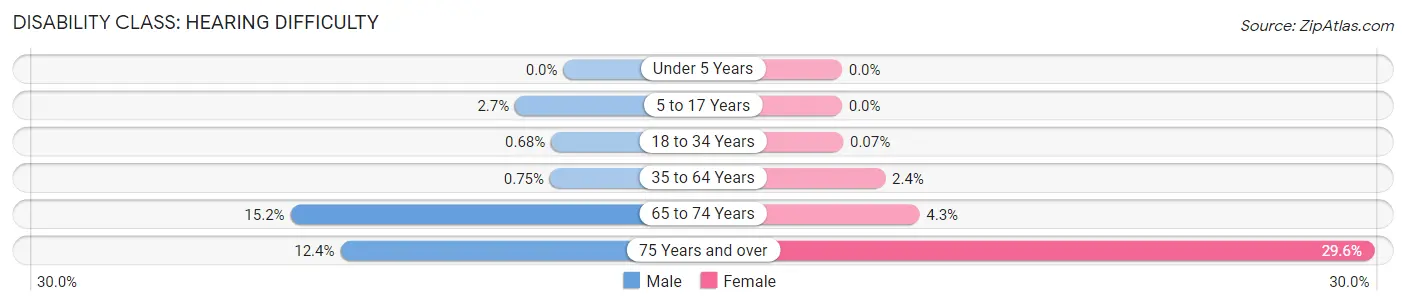
| Age Bracket | Male | Female |
| Under 5 Years | 0 (0.0%) | 0 (0.0%) |
| 5 to 17 Years | 22 (2.7%) | 0 (0.0%) |
| 18 to 34 Years | 69 (0.7%) | 7 (0.1%) |
| 35 to 64 Years | 26 (0.7%) | 83 (2.4%) |
| 65 to 74 Years | 105 (15.2%) | 28 (4.3%) |
| 75 Years and over | 38 (12.4%) | 194 (29.6%) |
Disability Class: Vision Difficulty
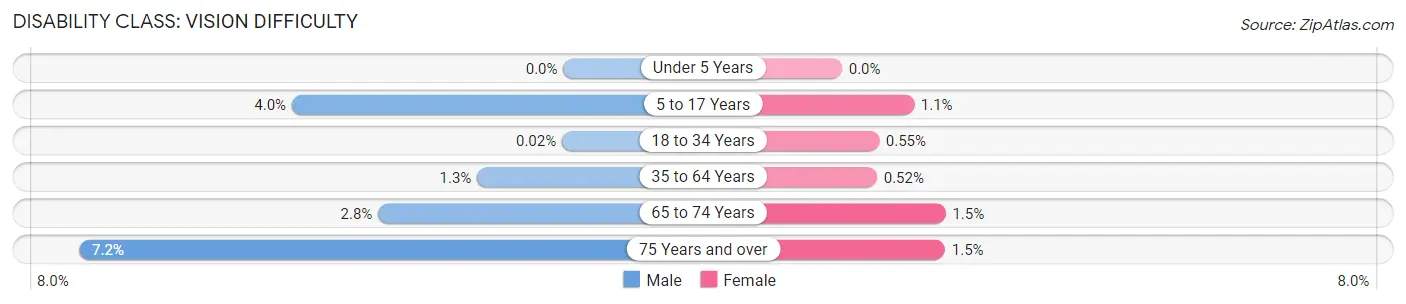
| Age Bracket | Male | Female |
| Under 5 Years | 0 (0.0%) | 0 (0.0%) |
| 5 to 17 Years | 33 (4.0%) | 10 (1.1%) |
| 18 to 34 Years | 2 (0.0%) | 53 (0.5%) |
| 35 to 64 Years | 44 (1.3%) | 18 (0.5%) |
| 65 to 74 Years | 19 (2.8%) | 10 (1.5%) |
| 75 Years and over | 22 (7.2%) | 10 (1.5%) |
Disability Class: Cognitive Difficulty
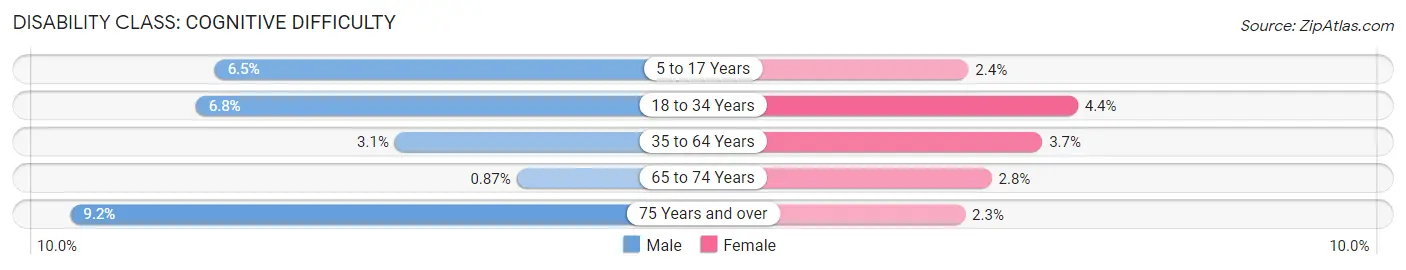
| Age Bracket | Male | Female |
| 5 to 17 Years | 53 (6.5%) | 22 (2.4%) |
| 18 to 34 Years | 688 (6.8%) | 423 (4.4%) |
| 35 to 64 Years | 108 (3.1%) | 128 (3.7%) |
| 65 to 74 Years | 6 (0.9%) | 18 (2.8%) |
| 75 Years and over | 28 (9.1%) | 15 (2.3%) |
Disability Class: Ambulatory Difficulty
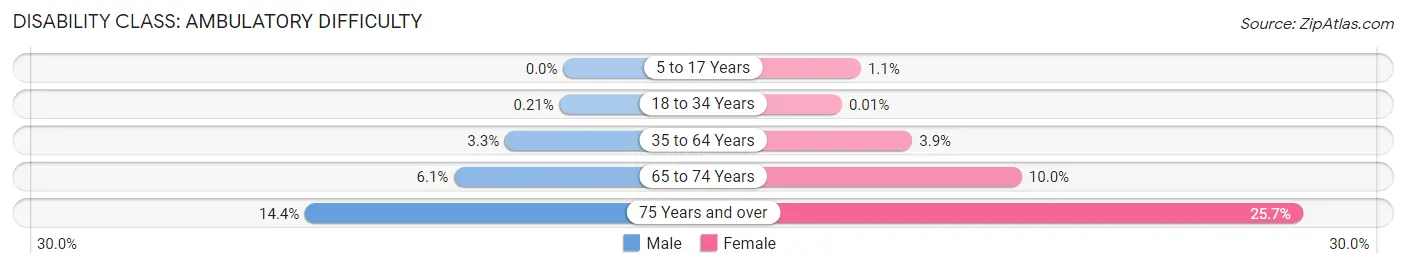
| Age Bracket | Male | Female |
| 5 to 17 Years | 0 (0.0%) | 10 (1.1%) |
| 18 to 34 Years | 21 (0.2%) | 1 (0.0%) |
| 35 to 64 Years | 112 (3.3%) | 135 (3.9%) |
| 65 to 74 Years | 42 (6.1%) | 65 (10.0%) |
| 75 Years and over | 44 (14.4%) | 168 (25.7%) |
Disability Class: Self-Care Difficulty
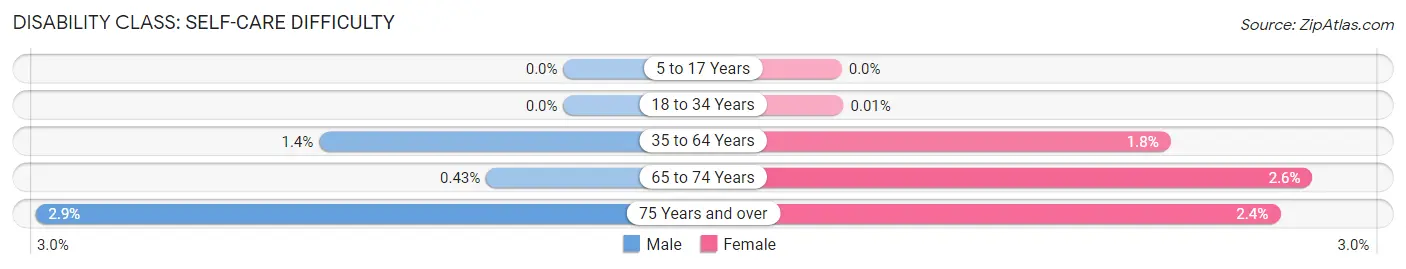
| Age Bracket | Male | Female |
| 5 to 17 Years | 0 (0.0%) | 0 (0.0%) |
| 18 to 34 Years | 0 (0.0%) | 1 (0.0%) |
| 35 to 64 Years | 47 (1.4%) | 63 (1.8%) |
| 65 to 74 Years | 3 (0.4%) | 17 (2.6%) |
| 75 Years and over | 9 (2.9%) | 16 (2.4%) |
Technology Access in Ithaca
Computing Device Access in Ithaca
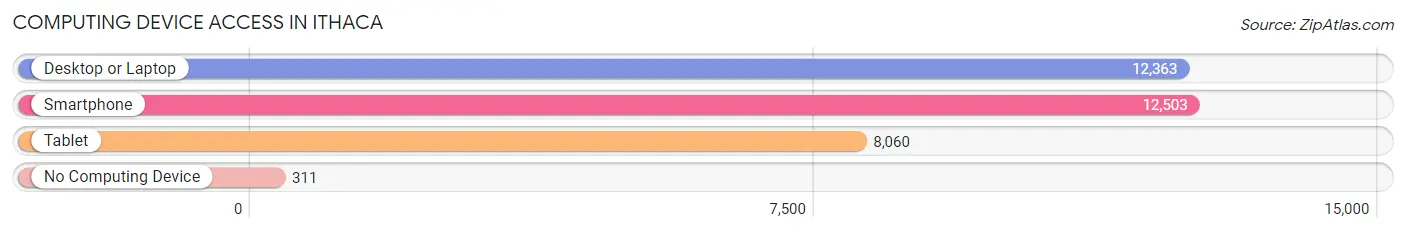
| Device Type | # Households | % Households |
| Desktop or Laptop | 12,363 | 93.4% |
| Smartphone | 12,503 | 94.5% |
| Tablet | 8,060 | 60.9% |
| No Computing Device | 311 | 2.4% |
| Total | 13,233 | 100.0% |
Internet Access in Ithaca
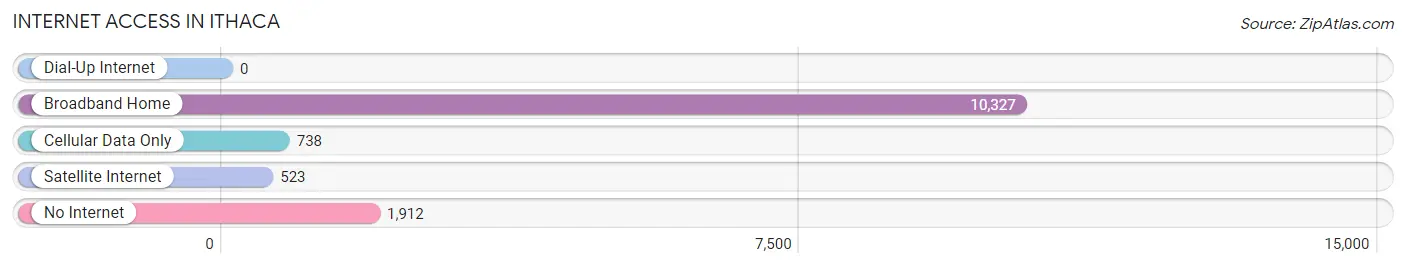
| Internet Type | # Households | % Households |
| Dial-Up Internet | 0 | 0.0% |
| Broadband Home | 10,327 | 78.0% |
| Cellular Data Only | 738 | 5.6% |
| Satellite Internet | 523 | 4.0% |
| No Internet | 1,912 | 14.4% |
| Total | 13,233 | 100.0% |
Ithaca Summary
Ithaca, NY is a city located in the Finger Lakes region of New York State. It is the county seat of Tompkins County and is home to Cornell University and Ithaca College. The city has a population of approximately 30,000 people and is known for its natural beauty, vibrant culture, and progressive politics.
History
The area that is now Ithaca was originally inhabited by the Cayuga Nation, a member of the Iroquois Confederacy. The first European settlers arrived in the area in the late 1700s, and the city was officially founded in 1788. In the early 1800s, Ithaca became an important stop on the Underground Railroad, providing a safe haven for escaped slaves. In 1865, Cornell University was founded in Ithaca, and the city quickly became a center of education and culture.
Geography
Ithaca is located in the Finger Lakes region of New York State, about halfway between Syracuse and Binghamton. The city is situated on the southern shore of Cayuga Lake, the longest of the Finger Lakes. The city is surrounded by rolling hills and is known for its natural beauty.
Economy
Ithaca’s economy is largely driven by education and tourism. Cornell University and Ithaca College are two of the city’s largest employers, and the city is also home to several other colleges and universities. Tourism is also an important part of the local economy, with visitors drawn to the city’s natural beauty and vibrant culture.
Demographics
As of the 2010 census, Ithaca had a population of 30,014 people. The city is racially and ethnically diverse, with the largest racial groups being White (77.2%), African American (7.2%), Asian (5.3%), and Hispanic or Latino (4.7%). The median household income in Ithaca is $41,945, and the median age is 24.7 years.
Ithaca is a vibrant and diverse city with a rich history and a bright future. The city is known for its natural beauty, progressive politics, and vibrant culture, and it is home to two of the most prestigious universities in the country. Ithaca is a great place to live, work, and visit, and it is sure to remain an important part of the Finger Lakes region for many years to come.
Common Questions
What is Per Capita Income in Ithaca?
Per Capita income in Ithaca is $28,566.
What is the Median Family Income in Ithaca?
Median Family Income in Ithaca is $122,929.
What is the Median Household income in Ithaca?
Median Household Income in Ithaca is $45,468.
What is Income or Wage Gap in Ithaca?
Income or Wage Gap in Ithaca is 26.4%.
Women in Ithaca earn 73.6 cents for every dollar earned by a man.
What is Inequality or Gini Index in Ithaca?
Inequality or Gini Index in Ithaca is 0.56.
What is the Total Population of Ithaca?
Total Population of Ithaca is 31,359.
What is the Total Male Population of Ithaca?
Total Male Population of Ithaca is 15,721.
What is the Total Female Population of Ithaca?
Total Female Population of Ithaca is 15,638.
What is the Ratio of Males per 100 Females in Ithaca?
There are 100.53 Males per 100 Females in Ithaca.
What is the Ratio of Females per 100 Males in Ithaca?
There are 99.47 Females per 100 Males in Ithaca.
What is the Median Population Age in Ithaca?
Median Population Age in Ithaca is 22.8 Years.
What is the Average Family Size in Ithaca
Average Family Size in Ithaca is 2.5 People.
What is the Average Household Size in Ithaca
Average Household Size in Ithaca is 1.8 People.
How Large is the Labor Force in Ithaca?
There are 15,755 People in the Labor Forcein in Ithaca.
What is the Percentage of People in the Labor Force in Ithaca?
53.7% of People are in the Labor Force in Ithaca.
What is the Unemployment Rate in Ithaca?
Unemployment Rate in Ithaca is 5.9%.