Chester, NY Map & Demographics
Chester Map
Chester Overview
$46,502
PER CAPITA INCOME
$140,048
AVG FAMILY INCOME
$102,105
AVG HOUSEHOLD INCOME
38.2%
WAGE / INCOME GAP [ % ]
61.8¢/ $1
WAGE / INCOME GAP [ $ ]
0.43
INEQUALITY / GINI INDEX
4,064
TOTAL POPULATION
1,965
MALE POPULATION
2,099
FEMALE POPULATION
93.62
MALES / 100 FEMALES
106.82
FEMALES / 100 MALES
40.0
MEDIAN AGE
3.4
AVG FAMILY SIZE
2.6
AVG HOUSEHOLD SIZE
2,385
LABOR FORCE [ PEOPLE ]
67.7%
PERCENT IN LABOR FORCE
2.2%
UNEMPLOYMENT RATE
Chester Zip Codes
Chester Area Codes
Income in Chester
Income Overview in Chester
Per Capita Income in Chester is $46,502, while median incomes of families and households are $140,048 and $102,105 respectively.
| Characteristic | Number | Measure |
| Per Capita Income | 4,064 | $46,502 |
| Median Family Income | 945 | $140,048 |
| Mean Family Income | 945 | $144,888 |
| Median Household Income | 1,554 | $102,105 |
| Mean Household Income | 1,554 | $115,467 |
| Income Deficit | 945 | $0 |
| Wage / Income Gap (%) | 4,064 | 38.22% |
| Wage / Income Gap ($) | 4,064 | 61.78¢ per $1 |
| Gini / Inequality Index | 4,064 | 0.43 |
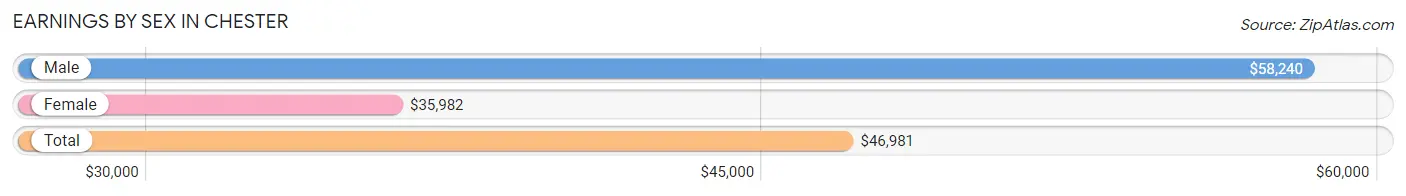
Earnings by Sex in Chester
Average Earnings in Chester are $46,981, $58,240 for men and $35,982 for women, a difference of 38.2%.
| Sex | Number | Average Earnings |
| Male | 1,521 (57.1%) | $58,240 |
| Female | 1,145 (42.9%) | $35,982 |
| Total | 2,666 (100.0%) | $46,981 |
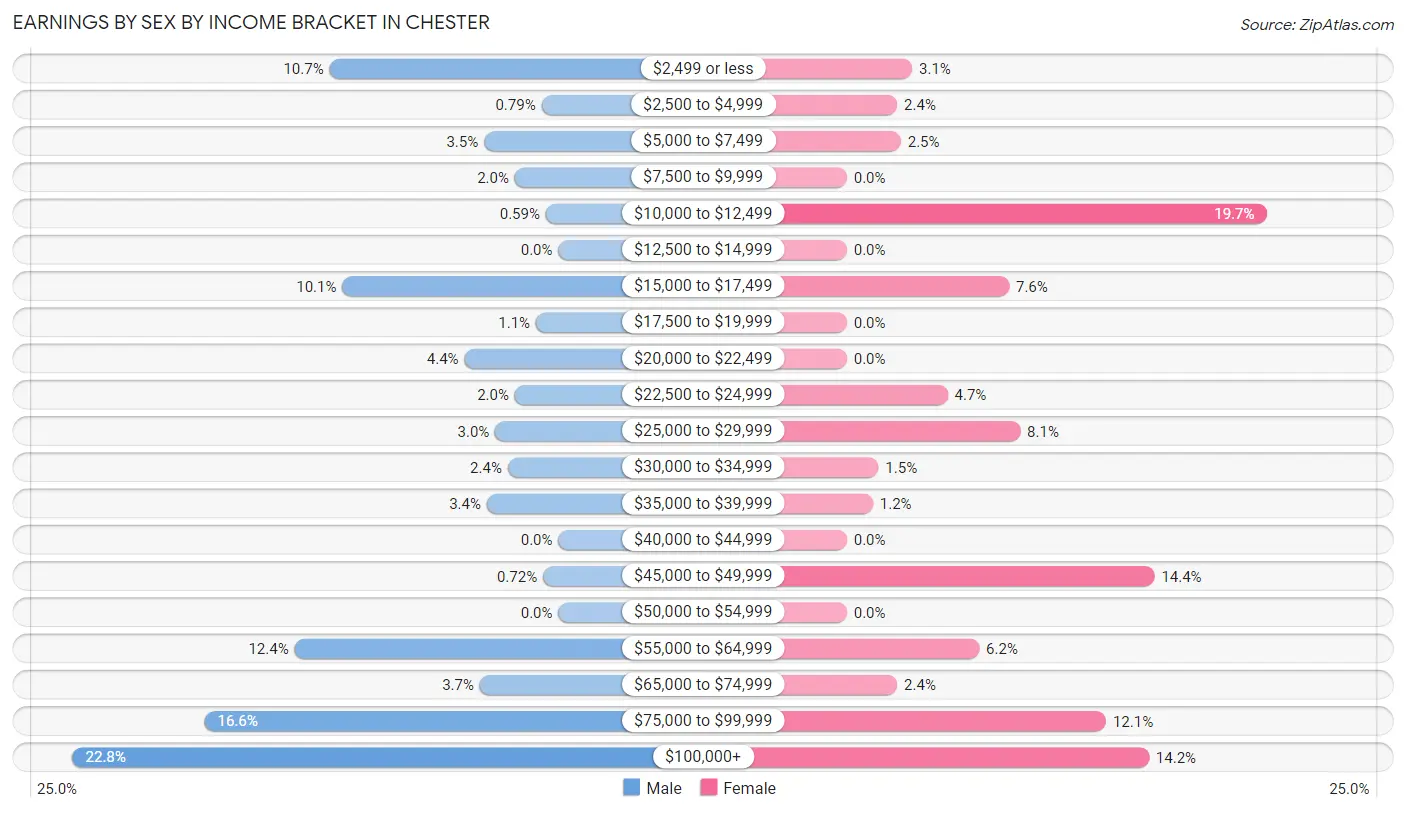
Earnings by Sex by Income Bracket in Chester
The most common earnings brackets in Chester are $100,000+ for men (346 | 22.8%) and $10,000 to $12,499 for women (225 | 19.7%).
| Income | Male | Female |
| $2,499 or less | 163 (10.7%) | 35 (3.1%) |
| $2,500 to $4,999 | 12 (0.8%) | 27 (2.4%) |
| $5,000 to $7,499 | 53 (3.5%) | 29 (2.5%) |
| $7,500 to $9,999 | 31 (2.0%) | 0 (0.0%) |
| $10,000 to $12,499 | 9 (0.6%) | 225 (19.7%) |
| $12,500 to $14,999 | 0 (0.0%) | 0 (0.0%) |
| $15,000 to $17,499 | 154 (10.1%) | 87 (7.6%) |
| $17,500 to $19,999 | 16 (1.1%) | 0 (0.0%) |
| $20,000 to $22,499 | 67 (4.4%) | 0 (0.0%) |
| $22,500 to $24,999 | 31 (2.0%) | 54 (4.7%) |
| $25,000 to $29,999 | 45 (3.0%) | 93 (8.1%) |
| $30,000 to $34,999 | 36 (2.4%) | 17 (1.5%) |
| $35,000 to $39,999 | 51 (3.4%) | 14 (1.2%) |
| $40,000 to $44,999 | 0 (0.0%) | 0 (0.0%) |
| $45,000 to $49,999 | 11 (0.7%) | 165 (14.4%) |
| $50,000 to $54,999 | 0 (0.0%) | 0 (0.0%) |
| $55,000 to $64,999 | 188 (12.4%) | 71 (6.2%) |
| $65,000 to $74,999 | 56 (3.7%) | 27 (2.4%) |
| $75,000 to $99,999 | 252 (16.6%) | 139 (12.1%) |
| $100,000+ | 346 (22.8%) | 162 (14.1%) |
| Total | 1,521 (100.0%) | 1,145 (100.0%) |
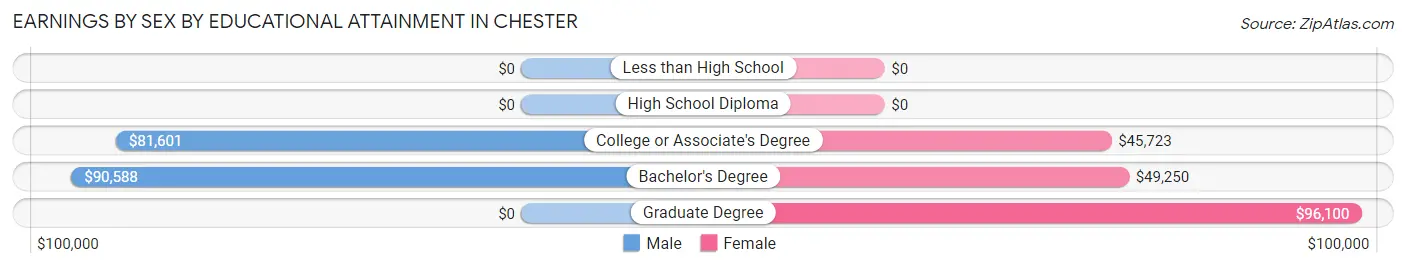
Earnings by Sex by Educational Attainment in Chester
Average earnings in Chester are $75,700 for men and $46,908 for women, a difference of 38.0%. Men with an educational attainment of bachelor's degree enjoy the highest average annual earnings of $90,588, while those with college or associate's degree education earn the least with $81,601. Women with an educational attainment of graduate degree earn the most with the average annual earnings of $96,100, while those with college or associate's degree education have the smallest earnings of $45,723.
| Educational Attainment | Male Income | Female Income |
| Less than High School | - | - |
| High School Diploma | - | - |
| College or Associate's Degree | $81,601 | $45,723 |
| Bachelor's Degree | $90,588 | $49,250 |
| Graduate Degree | - | - |
| Total | $75,700 | $46,908 |
Family Income in Chester
Family Income Brackets in Chester
According to the Chester family income data, there are 240 families falling into the $150,000 to $199,999 income range, which is the most common income bracket and makes up 25.4% of all families.
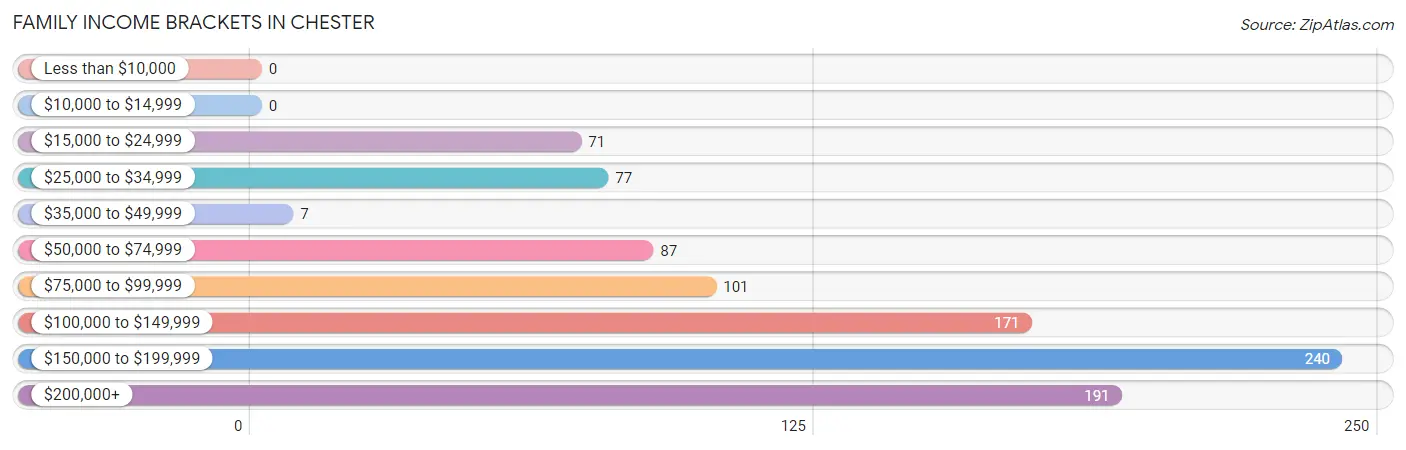
| Income Bracket | # Families | % Families |
| Less than $10,000 | 0 | 0.0% |
| $10,000 to $14,999 | 0 | 0.0% |
| $15,000 to $24,999 | 71 | 7.5% |
| $25,000 to $34,999 | 77 | 8.1% |
| $35,000 to $49,999 | 7 | 0.7% |
| $50,000 to $74,999 | 87 | 9.2% |
| $75,000 to $99,999 | 101 | 10.7% |
| $100,000 to $149,999 | 171 | 18.1% |
| $150,000 to $199,999 | 240 | 25.4% |
| $200,000+ | 191 | 20.2% |
Family Income by Famaliy Size in Chester
3-person families (227 | 24.0%) account for the highest median family income in Chester with $203,052 per family, while 3-person families (227 | 24.0%) have the highest median income of $67,684 per family member.
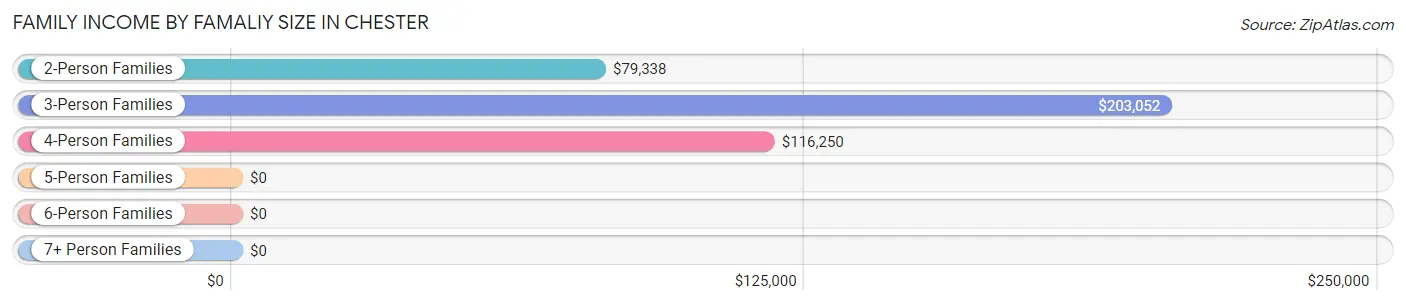
| Income Bracket | # Families | Median Income |
| 2-Person Families | 329 (34.8%) | $79,338 |
| 3-Person Families | 227 (24.0%) | $203,052 |
| 4-Person Families | 336 (35.6%) | $116,250 |
| 5-Person Families | 27 (2.9%) | $0 |
| 6-Person Families | 26 (2.8%) | $0 |
| 7+ Person Families | 0 (0.0%) | $0 |
| Total | 945 (100.0%) | $140,048 |
Family Income by Number of Earners in Chester
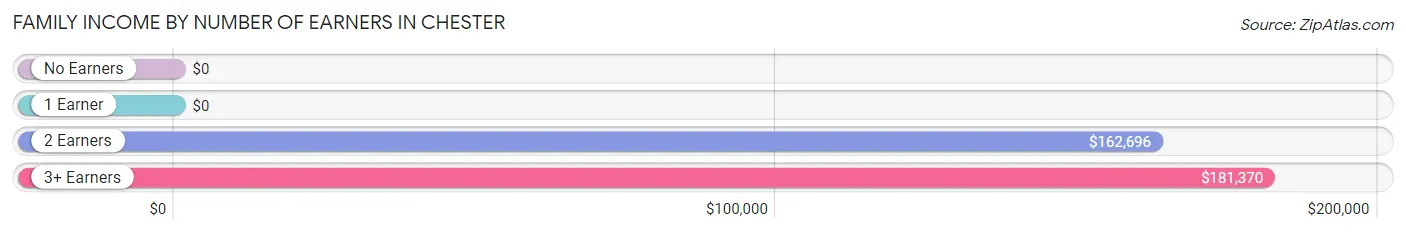
| Number of Earners | # Families | Median Income |
| No Earners | 9 (0.9%) | $0 |
| 1 Earner | 270 (28.6%) | $0 |
| 2 Earners | 420 (44.4%) | $162,696 |
| 3+ Earners | 246 (26.0%) | $181,370 |
| Total | 945 (100.0%) | $140,048 |
Household Income in Chester
Household Income Brackets in Chester
With 284 households falling in the category, the $100,000 to $149,999 income range is the most frequent in Chester, accounting for 18.3% of all households. In contrast, only 14 households (0.9%) fall into the less than $10,000 income bracket, making it the least populous group.
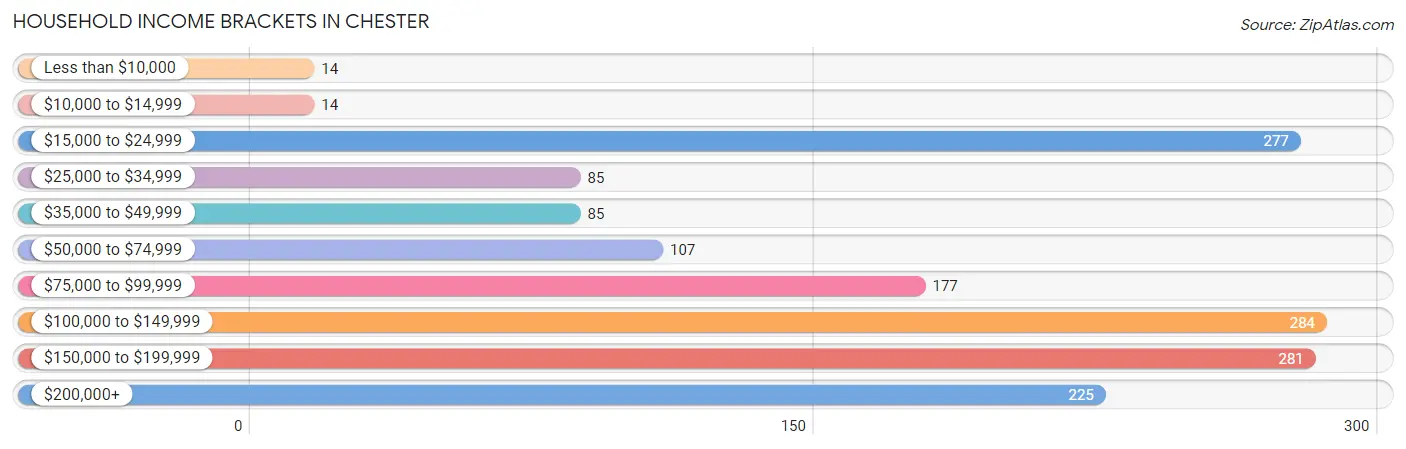
| Income Bracket | # Households | % Households |
| Less than $10,000 | 14 | 0.9% |
| $10,000 to $14,999 | 14 | 0.9% |
| $15,000 to $24,999 | 277 | 17.8% |
| $25,000 to $34,999 | 85 | 5.5% |
| $35,000 to $49,999 | 85 | 5.5% |
| $50,000 to $74,999 | 107 | 6.9% |
| $75,000 to $99,999 | 177 | 11.4% |
| $100,000 to $149,999 | 284 | 18.3% |
| $150,000 to $199,999 | 281 | 18.1% |
| $200,000+ | 225 | 14.5% |
Household Income by Householder Age in Chester
The median household income in Chester is $102,105, with the highest median household income of $141,202 found in the 45 to 64 years age bracket for the primary householder. A total of 709 households (45.6%) fall into this category. Meanwhile, the 15 to 24 years age bracket for the primary householder has the lowest median household income of $0, with 11 households (0.7%) in this group.
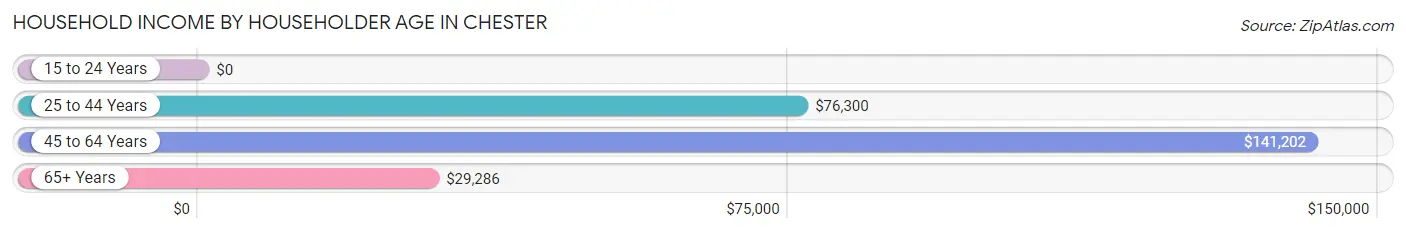
| Income Bracket | # Households | Median Income |
| 15 to 24 Years | 11 (0.7%) | $0 |
| 25 to 44 Years | 408 (26.3%) | $76,300 |
| 45 to 64 Years | 709 (45.6%) | $141,202 |
| 65+ Years | 426 (27.4%) | $29,286 |
| Total | 1,554 (100.0%) | $102,105 |
Poverty in Chester
Income Below Poverty by Sex and Age in Chester
With 5.1% poverty level for males and 6.1% for females among the residents of Chester, 25 to 34 year old males and 25 to 34 year old females are the most vulnerable to poverty, with 71 males (17.7%) and 92 females (25.1%) in their respective age groups living below the poverty level.
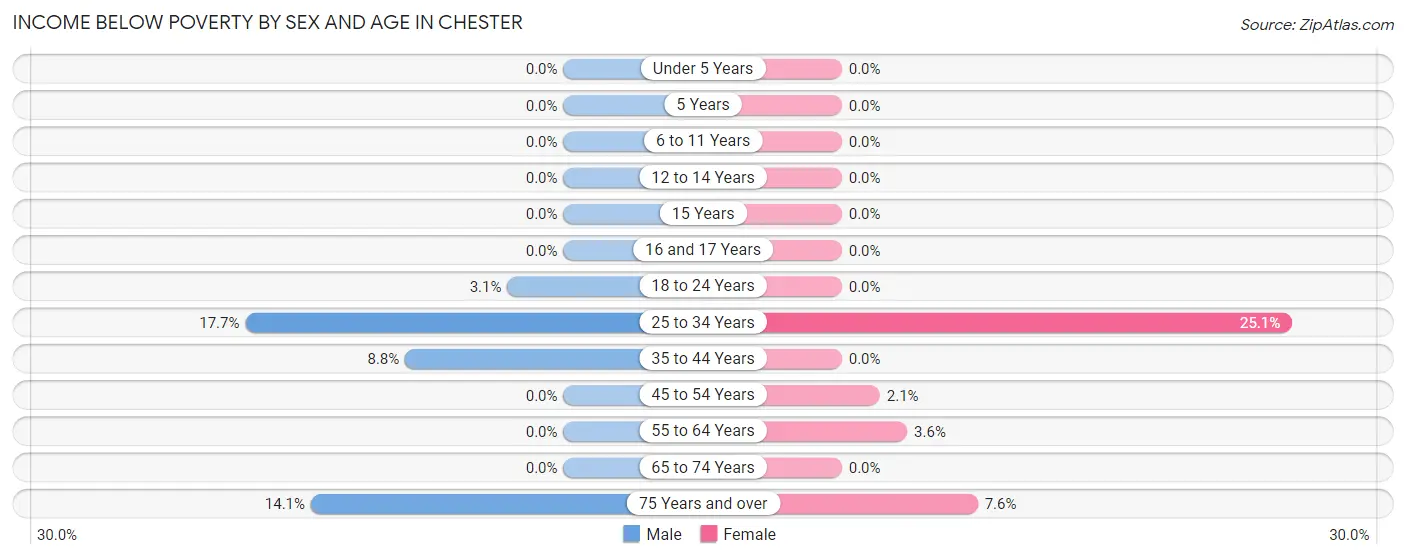
| Age Bracket | Male | Female |
| Under 5 Years | 0 (0.0%) | 0 (0.0%) |
| 5 Years | 0 (0.0%) | 0 (0.0%) |
| 6 to 11 Years | 0 (0.0%) | 0 (0.0%) |
| 12 to 14 Years | 0 (0.0%) | 0 (0.0%) |
| 15 Years | 0 (0.0%) | 0 (0.0%) |
| 16 and 17 Years | 0 (0.0%) | 0 (0.0%) |
| 18 to 24 Years | 6 (3.1%) | 0 (0.0%) |
| 25 to 34 Years | 71 (17.7%) | 92 (25.1%) |
| 35 to 44 Years | 14 (8.8%) | 0 (0.0%) |
| 45 to 54 Years | 0 (0.0%) | 6 (2.1%) |
| 55 to 64 Years | 0 (0.0%) | 17 (3.6%) |
| 65 to 74 Years | 0 (0.0%) | 0 (0.0%) |
| 75 Years and over | 9 (14.1%) | 14 (7.6%) |
| Total | 100 (5.1%) | 129 (6.1%) |
Income Above Poverty by Sex and Age in Chester
According to the poverty statistics in Chester, males aged under 5 years and females aged 6 to 11 years are the age groups that are most secure financially, with 100.0% of males and 100.0% of females in these age groups living above the poverty line.
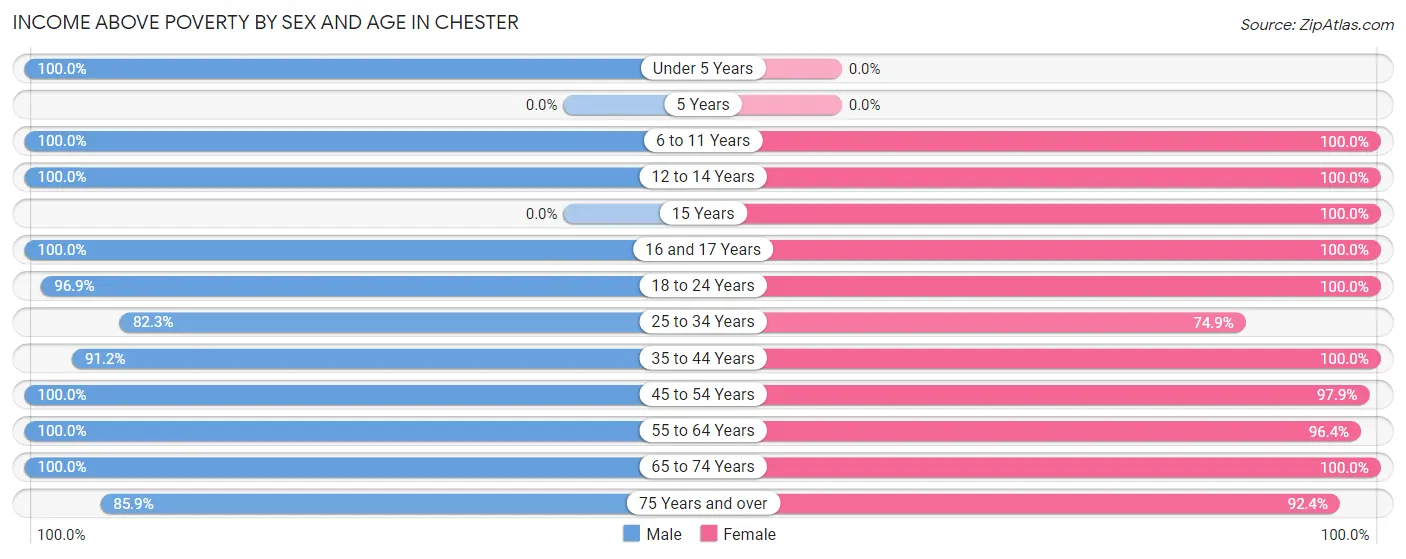
| Age Bracket | Male | Female |
| Under 5 Years | 26 (100.0%) | 0 (0.0%) |
| 5 Years | 0 (0.0%) | 0 (0.0%) |
| 6 to 11 Years | 121 (100.0%) | 199 (100.0%) |
| 12 to 14 Years | 107 (100.0%) | 48 (100.0%) |
| 15 Years | 0 (0.0%) | 39 (100.0%) |
| 16 and 17 Years | 153 (100.0%) | 25 (100.0%) |
| 18 to 24 Years | 186 (96.9%) | 162 (100.0%) |
| 25 to 34 Years | 330 (82.3%) | 275 (74.9%) |
| 35 to 44 Years | 145 (91.2%) | 147 (100.0%) |
| 45 to 54 Years | 379 (100.0%) | 277 (97.9%) |
| 55 to 64 Years | 244 (100.0%) | 450 (96.4%) |
| 65 to 74 Years | 119 (100.0%) | 176 (100.0%) |
| 75 Years and over | 55 (85.9%) | 171 (92.4%) |
| Total | 1,865 (94.9%) | 1,969 (93.9%) |
Income Below Poverty Among Married-Couple Families in Chester
The poverty statistics for married-couple families in Chester show that 9.1% or 71 of the total 778 families live below the poverty line. Families with no children have the highest poverty rate of 17.0%, comprising of 71 families. On the other hand, families with 1 or 2 children have the lowest poverty rate of 0.0%, which includes 0 families.
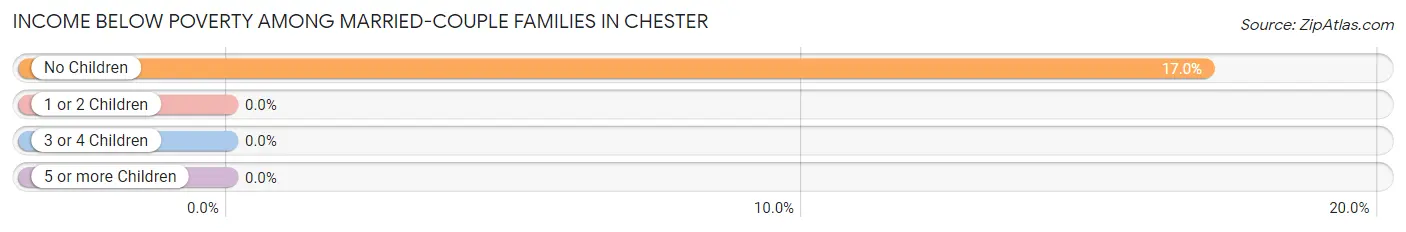
| Children | Above Poverty | Below Poverty |
| No Children | 347 (83.0%) | 71 (17.0%) |
| 1 or 2 Children | 360 (100.0%) | 0 (0.0%) |
| 3 or 4 Children | 0 (0.0%) | 0 (0.0%) |
| 5 or more Children | 0 (0.0%) | 0 (0.0%) |
| Total | 707 (90.9%) | 71 (9.1%) |
Income Below Poverty Among Single-Parent Households in Chester
| Children | Single Father | Single Mother |
| No Children | 0 (0.0%) | 0 (0.0%) |
| 1 or 2 Children | 0 (0.0%) | 0 (0.0%) |
| 3 or 4 Children | 0 (0.0%) | 0 (0.0%) |
| 5 or more Children | 0 (0.0%) | 0 (0.0%) |
| Total | 0 (0.0%) | 0 (0.0%) |
Income Below Poverty Among Married-Couple vs Single-Parent Households in Chester
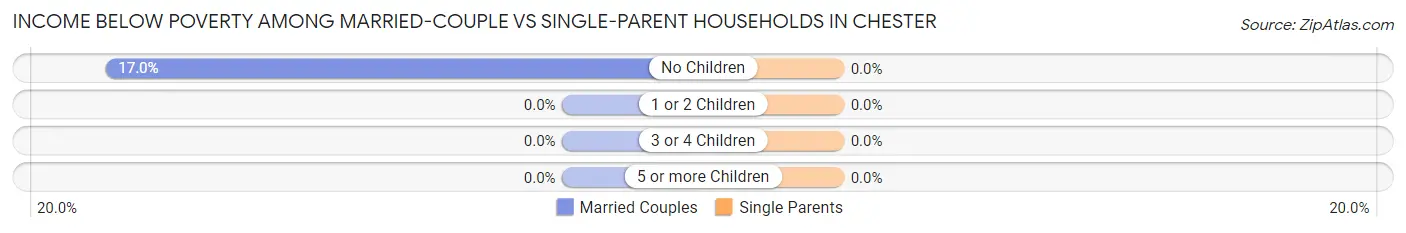
| Children | Married-Couple Families | Single-Parent Households |
| No Children | 71 (17.0%) | 0 (0.0%) |
| 1 or 2 Children | 0 (0.0%) | 0 (0.0%) |
| 3 or 4 Children | 0 (0.0%) | 0 (0.0%) |
| 5 or more Children | 0 (0.0%) | 0 (0.0%) |
| Total | 71 (9.1%) | 0 (0.0%) |
Race in Chester
The most populous races in Chester are White / Caucasian (2,540 | 62.5%), Hispanic or Latino (782 | 19.2%), and Some other Race (412 | 10.1%).
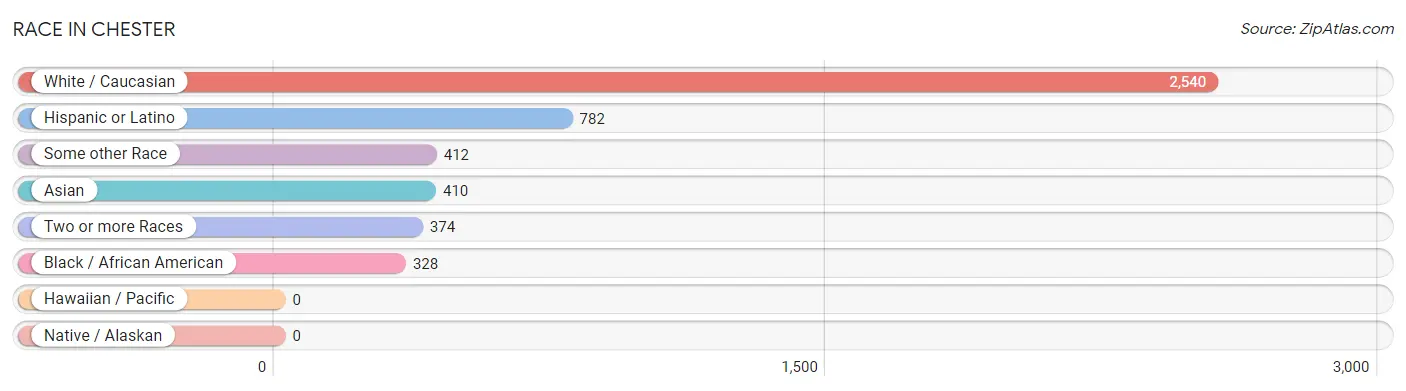
| Race | # Population | % Population |
| Asian | 410 | 10.1% |
| Black / African American | 328 | 8.1% |
| Hawaiian / Pacific | 0 | 0.0% |
| Hispanic or Latino | 782 | 19.2% |
| Native / Alaskan | 0 | 0.0% |
| White / Caucasian | 2,540 | 62.5% |
| Two or more Races | 374 | 9.2% |
| Some other Race | 412 | 10.1% |
| Total | 4,064 | 100.0% |
Ancestry in Chester
The most populous ancestries reported in Chester are Italian (904 | 22.2%), Puerto Rican (691 | 17.0%), German (591 | 14.5%), Vietnamese (330 | 8.1%), and Irish (321 | 7.9%), together accounting for 69.8% of all Chester residents.
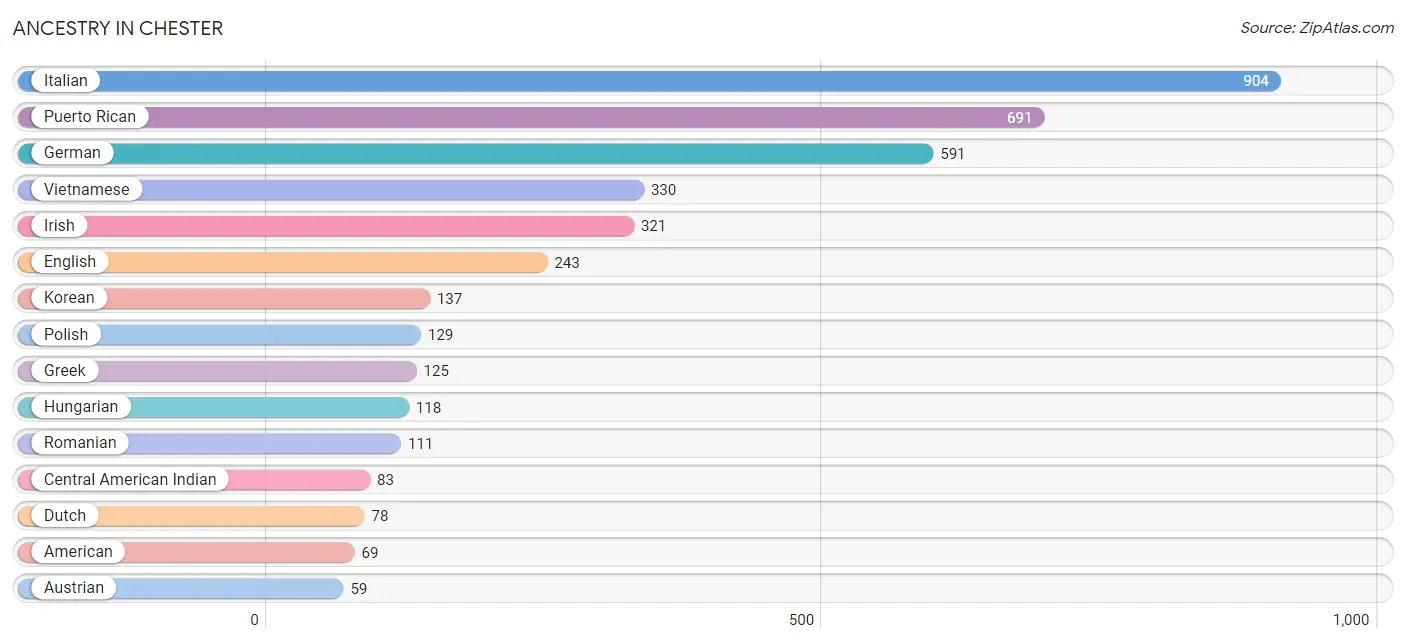
| Ancestry | # Population | % Population |
| American | 69 | 1.7% |
| Austrian | 59 | 1.5% |
| British | 43 | 1.1% |
| Burmese | 11 | 0.3% |
| Central American Indian | 83 | 2.0% |
| Cuban | 35 | 0.9% |
| Dominican | 56 | 1.4% |
| Dutch | 78 | 1.9% |
| Eastern European | 35 | 0.9% |
| English | 243 | 6.0% |
| European | 10 | 0.3% |
| French Canadian | 22 | 0.5% |
| German | 591 | 14.5% |
| Greek | 125 | 3.1% |
| Haitian | 15 | 0.4% |
| Hungarian | 118 | 2.9% |
| Irish | 321 | 7.9% |
| Italian | 904 | 22.2% |
| Jamaican | 20 | 0.5% |
| Korean | 137 | 3.4% |
| Northern European | 10 | 0.3% |
| Norwegian | 59 | 1.5% |
| Pennsylvania German | 32 | 0.8% |
| Polish | 129 | 3.2% |
| Puerto Rican | 691 | 17.0% |
| Romanian | 111 | 2.7% |
| Russian | 32 | 0.8% |
| Swedish | 35 | 0.9% |
| Ukrainian | 43 | 1.1% |
| Vietnamese | 330 | 8.1% | View All 30 Rows |
Immigrants in Chester
The most numerous immigrant groups reported in Chester came from Asia (201 | 5.0%), South Central Asia (163 | 4.0%), Bangladesh (121 | 3.0%), Latin America (105 | 2.6%), and Europe (70 | 1.7%), together accounting for 16.2% of all Chester residents.
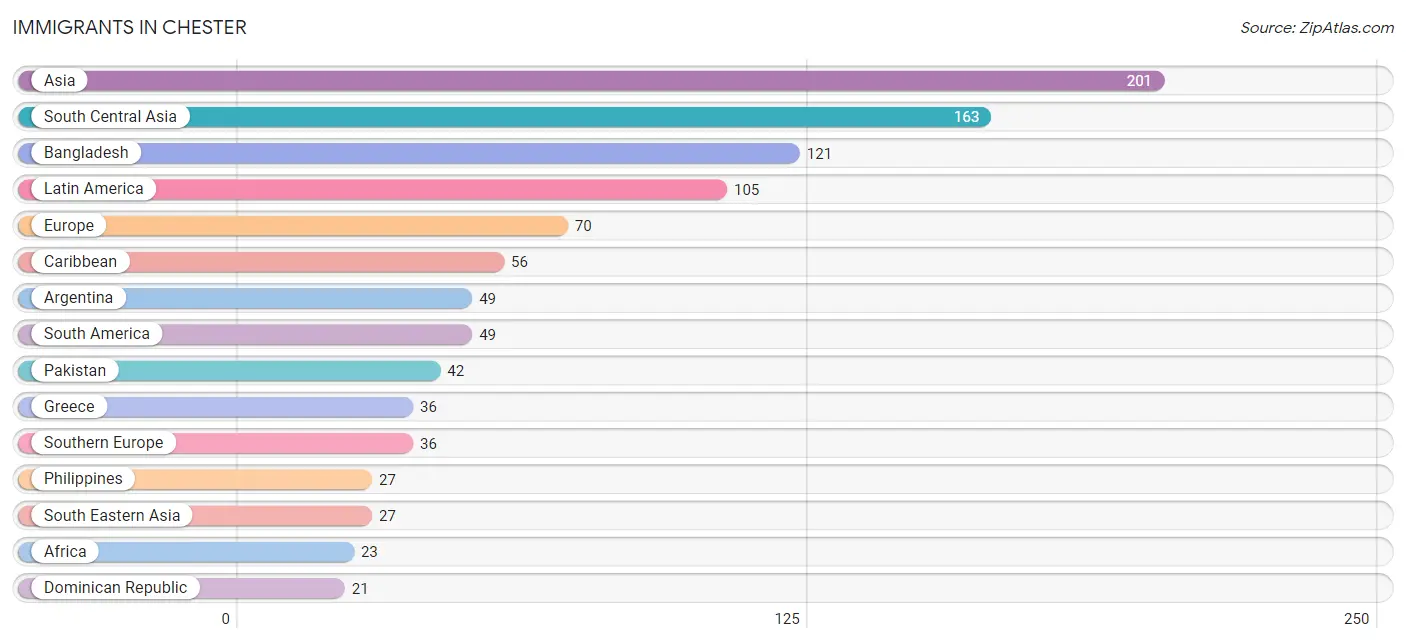
| Immigration Origin | # Population | % Population |
| Africa | 23 | 0.6% |
| Argentina | 49 | 1.2% |
| Asia | 201 | 5.0% |
| Bangladesh | 121 | 3.0% |
| Caribbean | 56 | 1.4% |
| Dominican Republic | 21 | 0.5% |
| Eastern Asia | 11 | 0.3% |
| Eastern Europe | 18 | 0.4% |
| England | 16 | 0.4% |
| Europe | 70 | 1.7% |
| Greece | 36 | 0.9% |
| Haiti | 15 | 0.4% |
| Jamaica | 20 | 0.5% |
| Korea | 11 | 0.3% |
| Latin America | 105 | 2.6% |
| Morocco | 16 | 0.4% |
| Nigeria | 7 | 0.2% |
| Northern Africa | 16 | 0.4% |
| Northern Europe | 16 | 0.4% |
| Pakistan | 42 | 1.0% |
| Philippines | 27 | 0.7% |
| Romania | 18 | 0.4% |
| South America | 49 | 1.2% |
| South Central Asia | 163 | 4.0% |
| South Eastern Asia | 27 | 0.7% |
| Southern Europe | 36 | 0.9% |
| Western Africa | 7 | 0.2% | View All 27 Rows |
Sex and Age in Chester
Sex and Age in Chester
The most populous age groups in Chester are 25 to 29 Years (311 | 15.8%) for men and 55 to 59 Years (392 | 18.7%) for women.
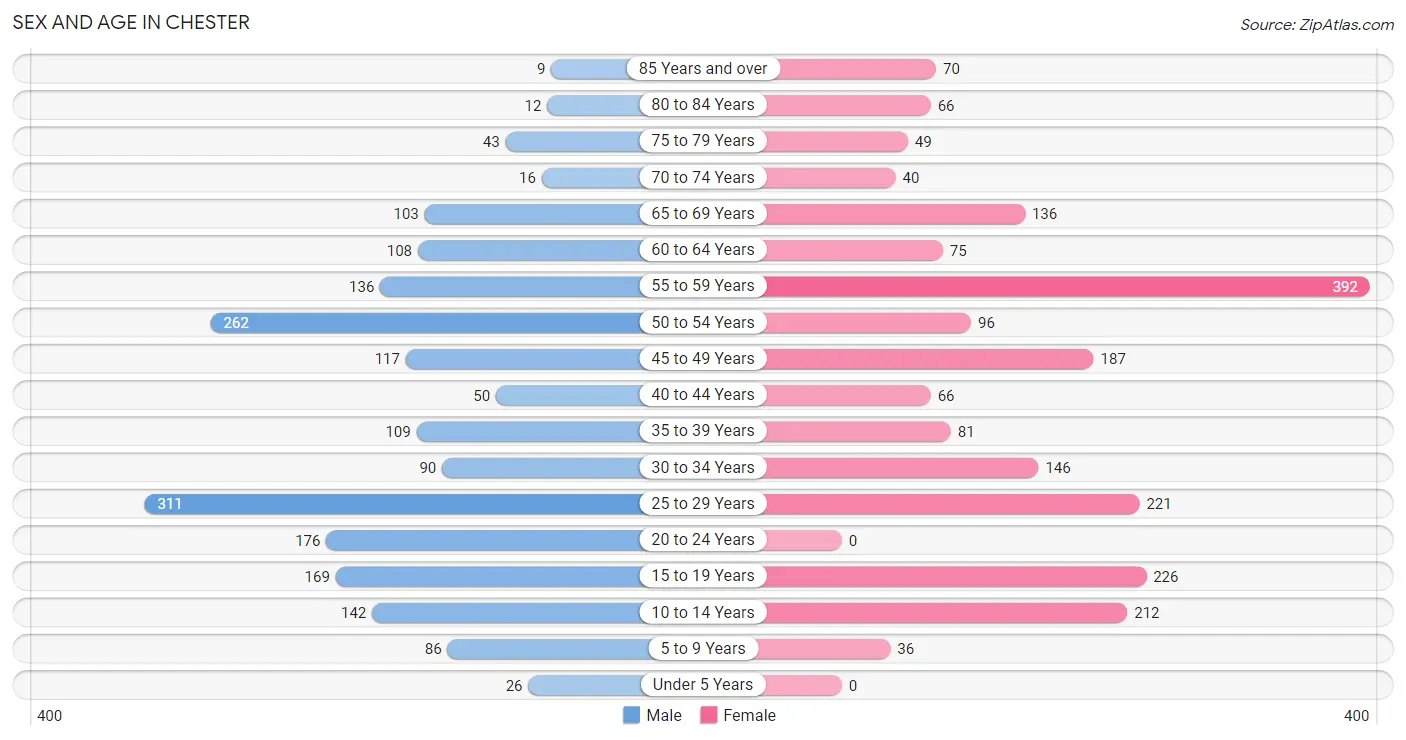
| Age Bracket | Male | Female |
| Under 5 Years | 26 (1.3%) | 0 (0.0%) |
| 5 to 9 Years | 86 (4.4%) | 36 (1.7%) |
| 10 to 14 Years | 142 (7.2%) | 212 (10.1%) |
| 15 to 19 Years | 169 (8.6%) | 226 (10.8%) |
| 20 to 24 Years | 176 (9.0%) | 0 (0.0%) |
| 25 to 29 Years | 311 (15.8%) | 221 (10.5%) |
| 30 to 34 Years | 90 (4.6%) | 146 (7.0%) |
| 35 to 39 Years | 109 (5.6%) | 81 (3.9%) |
| 40 to 44 Years | 50 (2.5%) | 66 (3.1%) |
| 45 to 49 Years | 117 (5.9%) | 187 (8.9%) |
| 50 to 54 Years | 262 (13.3%) | 96 (4.6%) |
| 55 to 59 Years | 136 (6.9%) | 392 (18.7%) |
| 60 to 64 Years | 108 (5.5%) | 75 (3.6%) |
| 65 to 69 Years | 103 (5.2%) | 136 (6.5%) |
| 70 to 74 Years | 16 (0.8%) | 40 (1.9%) |
| 75 to 79 Years | 43 (2.2%) | 49 (2.3%) |
| 80 to 84 Years | 12 (0.6%) | 66 (3.1%) |
| 85 Years and over | 9 (0.5%) | 70 (3.3%) |
| Total | 1,965 (100.0%) | 2,099 (100.0%) |
Families and Households in Chester
Median Family Size in Chester
The median family size in Chester is 3.44 persons per family, with married-couple families (778 | 82.3%) accounting for the largest median family size of 3.75 persons per family. On the other hand, single male/father families (17 | 1.8%) represent the smallest median family size with 1.94 persons per family.
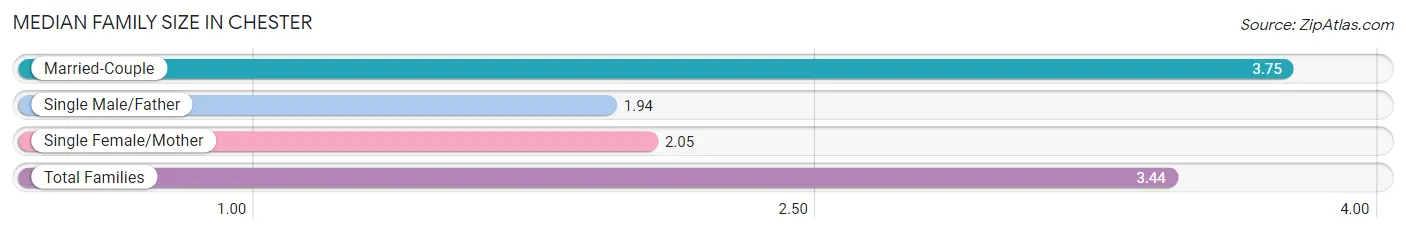
| Family Type | # Families | Family Size |
| Married-Couple | 778 (82.3%) | 3.75 |
| Single Male/Father | 17 (1.8%) | 1.94 |
| Single Female/Mother | 150 (15.9%) | 2.05 |
| Total Families | 945 (100.0%) | 3.44 |
Median Household Size in Chester
The median household size in Chester is 2.60 persons per household, with married-couple households (778 | 50.1%) accounting for the largest median household size of 3.76 persons per household. non-family households (609 | 39.2%) represent the smallest median household size with 1.21 persons per household.
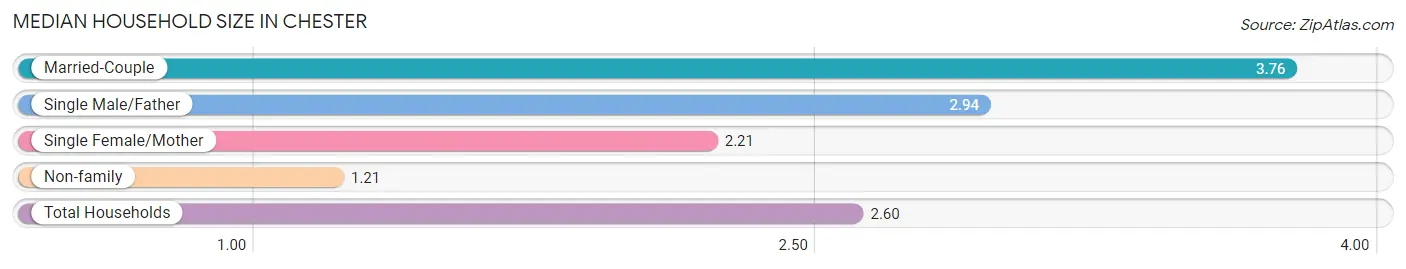
| Household Type | # Households | Household Size |
| Married-Couple | 778 (50.1%) | 3.76 |
| Single Male/Father | 17 (1.1%) | 2.94 |
| Single Female/Mother | 150 (9.7%) | 2.21 |
| Non-family | 609 (39.2%) | 1.21 |
| Total Households | 1,554 (100.0%) | 2.60 |
Household Size by Marriage Status in Chester
Out of a total of 1,554 households in Chester, 945 (60.8%) are family households, while 609 (39.2%) are nonfamily households. The most numerous type of family households are 4-person households, comprising 341, and the most common type of nonfamily households are 1-person households, comprising 486.
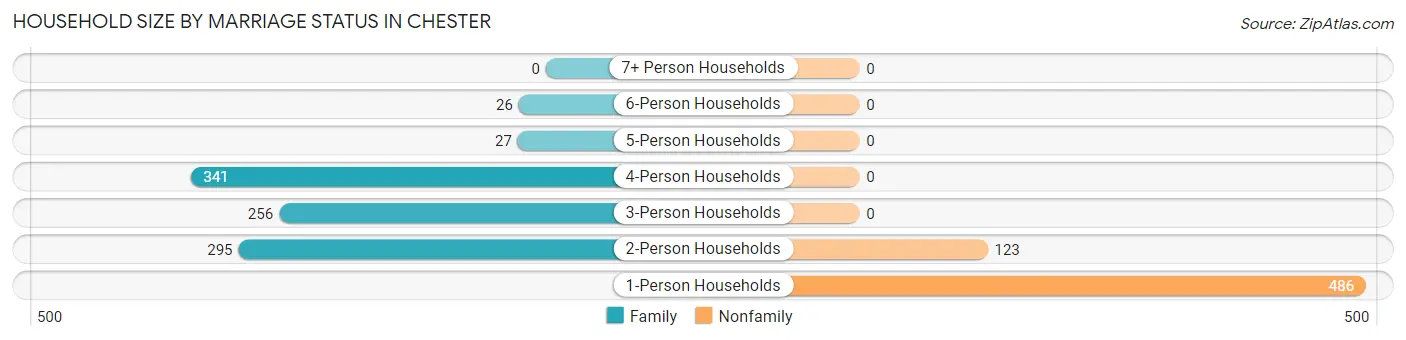
| Household Size | Family Households | Nonfamily Households |
| 1-Person Households | - | 486 (31.3%) |
| 2-Person Households | 295 (19.0%) | 123 (7.9%) |
| 3-Person Households | 256 (16.5%) | 0 (0.0%) |
| 4-Person Households | 341 (21.9%) | 0 (0.0%) |
| 5-Person Households | 27 (1.7%) | 0 (0.0%) |
| 6-Person Households | 26 (1.7%) | 0 (0.0%) |
| 7+ Person Households | 0 (0.0%) | 0 (0.0%) |
| Total | 945 (60.8%) | 609 (39.2%) |
Female Fertility in Chester
Fertility by Age in Chester
Average fertility rate in Chester is 18.0 births per 1,000 women. Women in the age bracket of 35 to 50 years have the highest fertility rate with 46.0 births per 1,000 women. Women in the age bracket of 35 to 50 years acount for 100.0% of all women with births.
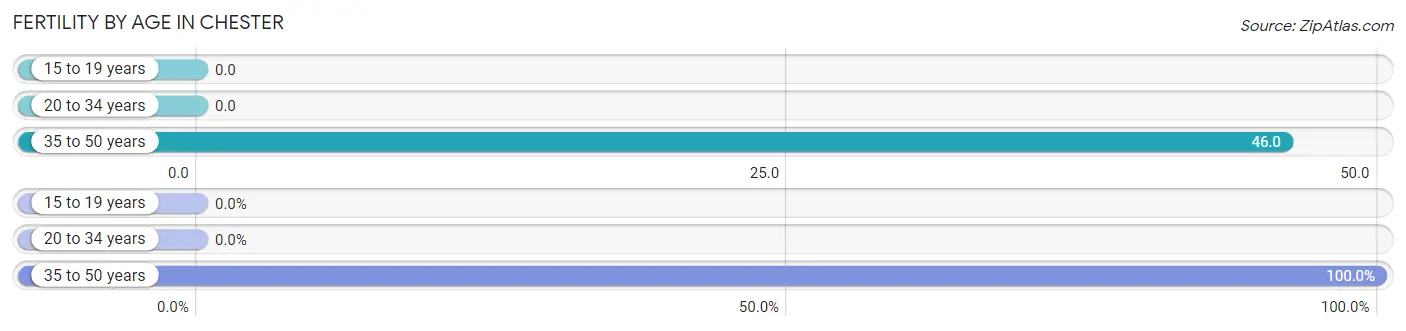
| Age Bracket | Women with Births | Births / 1,000 Women |
| 15 to 19 years | 0 (0.0%) | 0.0 |
| 20 to 34 years | 0 (0.0%) | 0.0 |
| 35 to 50 years | 17 (100.0%) | 46.0 |
| Total | 17 (100.0%) | 18.0 |
Fertility by Age by Marriage Status in Chester
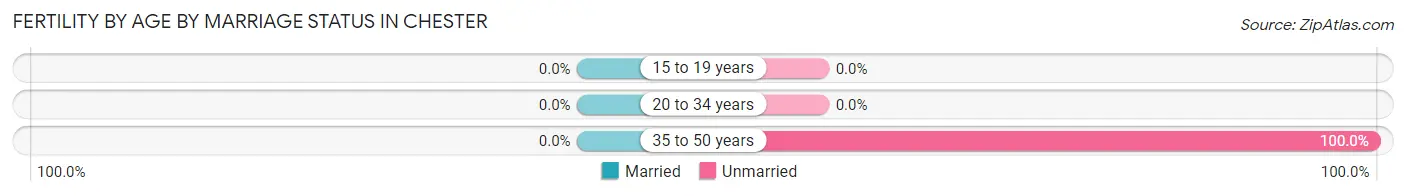
| Age Bracket | Married | Unmarried |
| 15 to 19 years | 0 (0.0%) | 0 (0.0%) |
| 20 to 34 years | 0 (0.0%) | 0 (0.0%) |
| 35 to 50 years | 0 (0.0%) | 17 (100.0%) |
| Total | 0 (0.0%) | 17 (100.0%) |
Fertility by Education in Chester
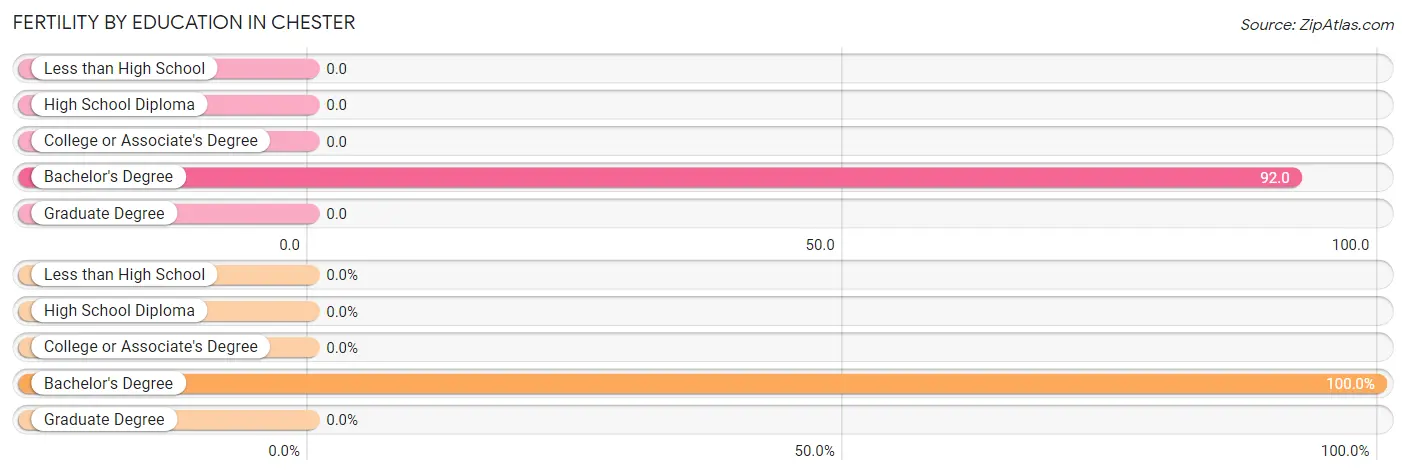
| Educational Attainment | Women with Births | Births / 1,000 Women |
| Less than High School | 0 (0.0%) | 0.0 |
| High School Diploma | 0 (0.0%) | 0.0 |
| College or Associate's Degree | 0 (0.0%) | 0.0 |
| Bachelor's Degree | 17 (100.0%) | 92.0 |
| Graduate Degree | 0 (0.0%) | 0.0 |
| Total | 17 (100.0%) | 18.0 |
Fertility by Education by Marriage Status in Chester
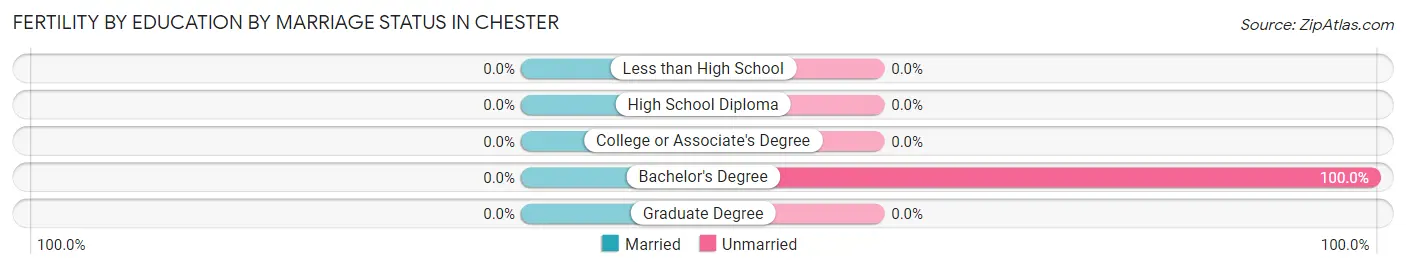
| Educational Attainment | Married | Unmarried |
| Less than High School | 0 (0.0%) | 0 (0.0%) |
| High School Diploma | 0 (0.0%) | 0 (0.0%) |
| College or Associate's Degree | 0 (0.0%) | 0 (0.0%) |
| Bachelor's Degree | 0 (0.0%) | 17 (100.0%) |
| Graduate Degree | 0 (0.0%) | 0 (0.0%) |
| Total | 0 (0.0%) | 17 (100.0%) |
Employment Characteristics in Chester
Employment by Class of Employer in Chester
Among the 2,200 employed individuals in Chester, private company employees (1,363 | 62.0%), local government employees (305 | 13.9%), and not-for-profit organizations (248 | 11.3%) make up the most common classes of employment.
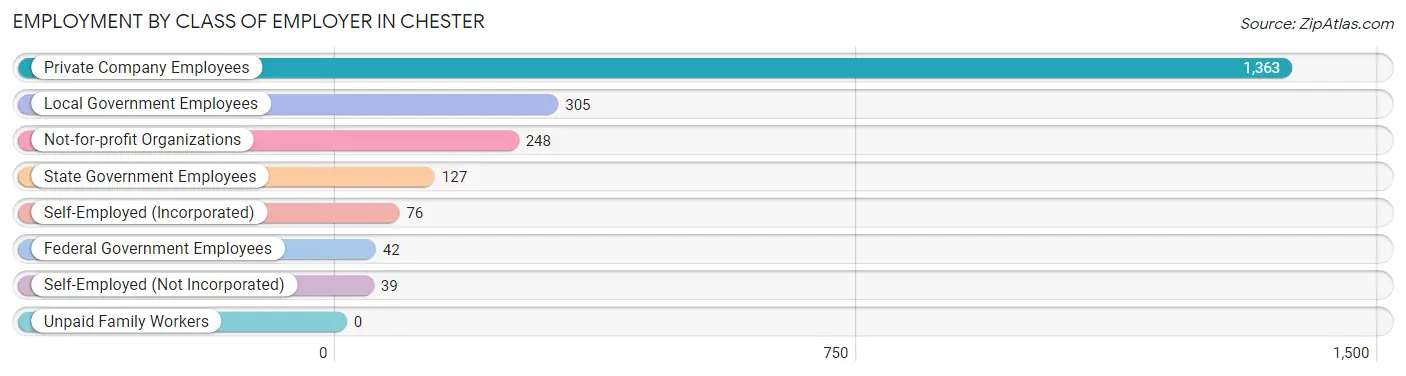
| Employer Class | # Employees | % Employees |
| Private Company Employees | 1,363 | 62.0% |
| Self-Employed (Incorporated) | 76 | 3.5% |
| Self-Employed (Not Incorporated) | 39 | 1.8% |
| Not-for-profit Organizations | 248 | 11.3% |
| Local Government Employees | 305 | 13.9% |
| State Government Employees | 127 | 5.8% |
| Federal Government Employees | 42 | 1.9% |
| Unpaid Family Workers | 0 | 0.0% |
| Total | 2,200 | 100.0% |
Employment Status by Age in Chester
According to the labor force statistics for Chester, out of the total population over 16 years of age (3,523), 67.7% or 2,385 individuals are in the labor force, with 2.2% or 52 of them unemployed. The age group with the highest labor force participation rate is 20 to 24 years, with 96.6% or 170 individuals in the labor force. Within the labor force, the 25 to 29 years age range has the highest percentage of unemployed individuals, with 13.3% or 53 of them being unemployed.
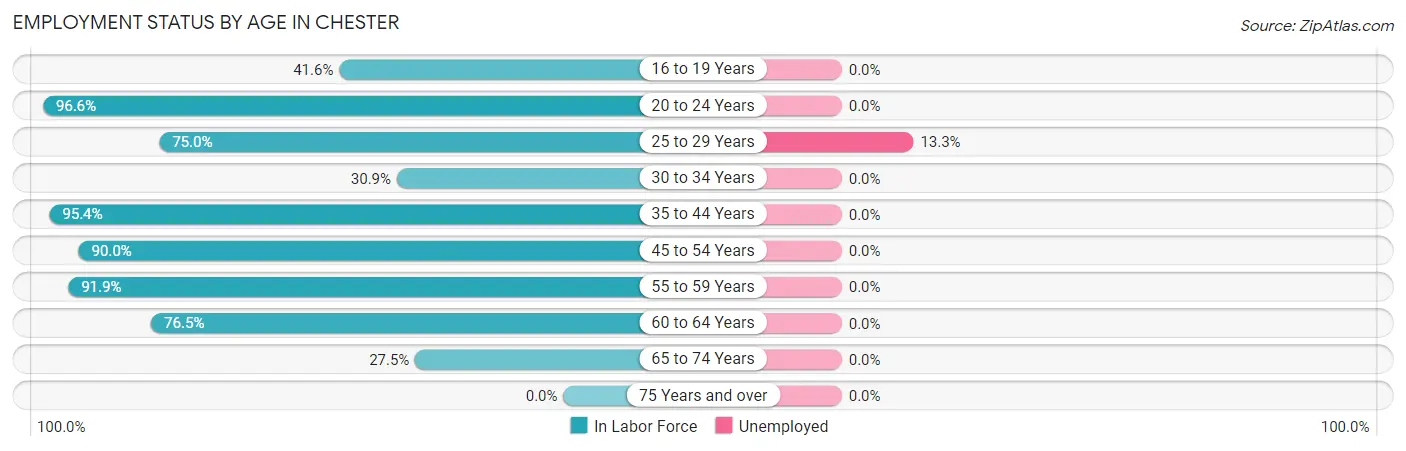
| Age Bracket | In Labor Force | Unemployed |
| 16 to 19 Years | 148 (41.6%) | 0 (0.0%) |
| 20 to 24 Years | 170 (96.6%) | 0 (0.0%) |
| 25 to 29 Years | 399 (75.0%) | 53 (13.3%) |
| 30 to 34 Years | 73 (30.9%) | 0 (0.0%) |
| 35 to 44 Years | 292 (95.4%) | 0 (0.0%) |
| 45 to 54 Years | 596 (90.0%) | 0 (0.0%) |
| 55 to 59 Years | 485 (91.9%) | 0 (0.0%) |
| 60 to 64 Years | 140 (76.5%) | 0 (0.0%) |
| 65 to 74 Years | 81 (27.5%) | 0 (0.0%) |
| 75 Years and over | 0 (0.0%) | 0 (0.0%) |
| Total | 2,385 (67.7%) | 52 (2.2%) |
Employment Status by Educational Attainment in Chester
According to labor force statistics for Chester, 81.1% of individuals (1,985) out of the total population between 25 and 64 years of age (2,447) are in the labor force, with 2.7% or 54 of them being unemployed. The group with the highest labor force participation rate are those with the educational attainment of college / associate degree, with 94.7% or 827 individuals in the labor force. Within the labor force, individuals with college / associate degree education have the highest percentage of unemployment, with 6.4% or 53 of them being unemployed.
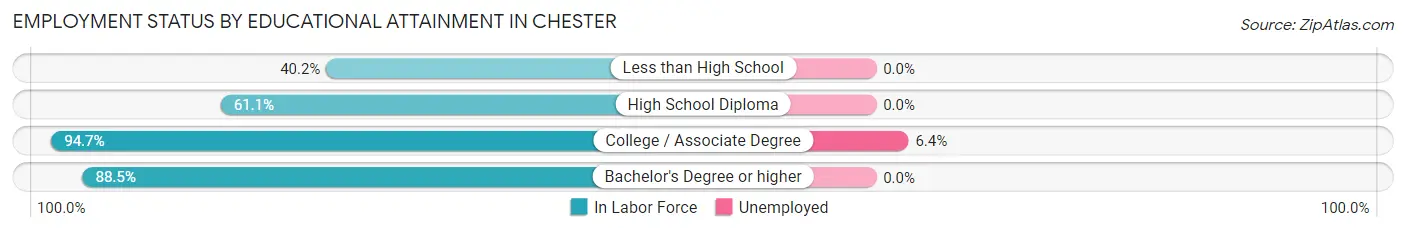
| Educational Attainment | In Labor Force | Unemployed |
| Less than High School | 49 (40.2%) | 0 (0.0%) |
| High School Diploma | 392 (61.1%) | 0 (0.0%) |
| College / Associate Degree | 827 (94.7%) | 56 (6.4%) |
| Bachelor's Degree or higher | 717 (88.5%) | 0 (0.0%) |
| Total | 1,985 (81.1%) | 66 (2.7%) |
Employment Occupations by Sex in Chester
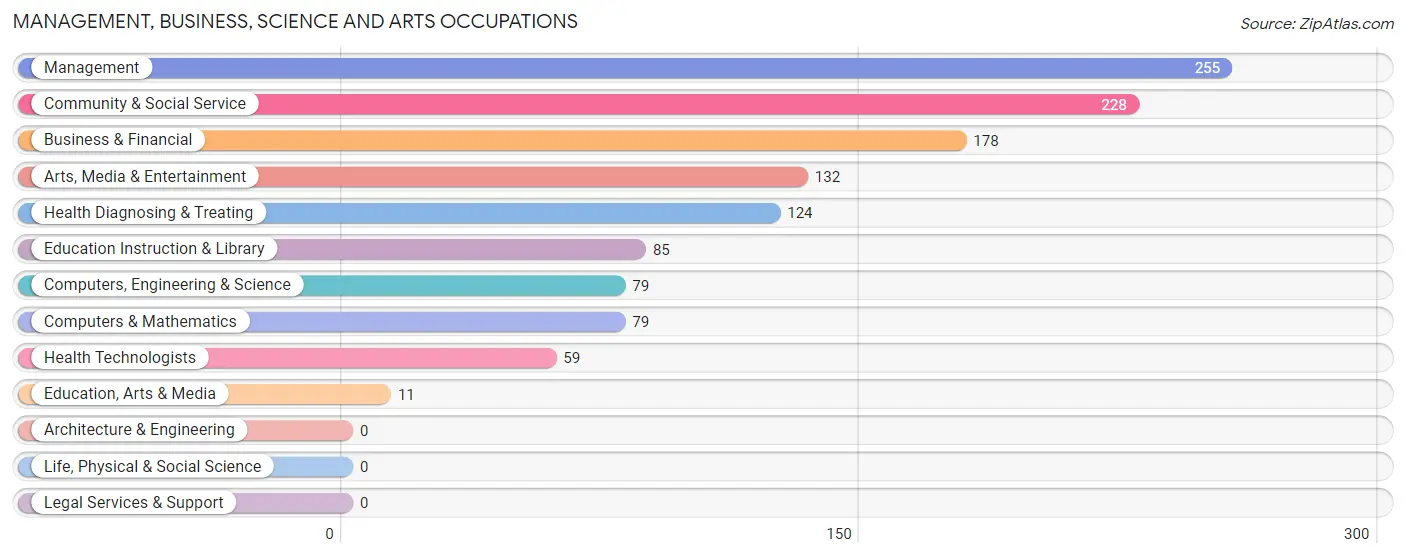
Management, Business, Science and Arts Occupations
The most common Management, Business, Science and Arts occupations in Chester are Management (255 | 11.0%), Community & Social Service (228 | 9.8%), Business & Financial (178 | 7.7%), Arts, Media & Entertainment (132 | 5.7%), and Health Diagnosing & Treating (124 | 5.3%).
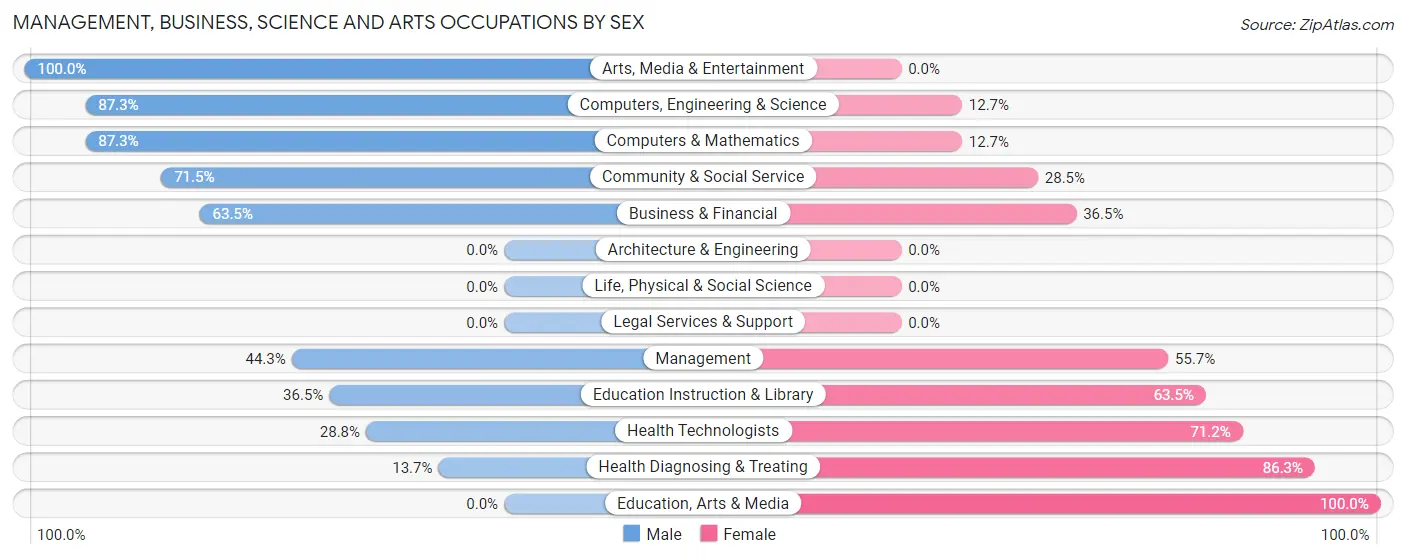
Management, Business, Science and Arts Occupations by Sex
Within the Management, Business, Science and Arts occupations in Chester, the most male-oriented occupations are Arts, Media & Entertainment (100.0%), Computers, Engineering & Science (87.3%), and Computers & Mathematics (87.3%), while the most female-oriented occupations are Education, Arts & Media (100.0%), Health Diagnosing & Treating (86.3%), and Health Technologists (71.2%).
| Occupation | Male | Female |
| Management | 113 (44.3%) | 142 (55.7%) |
| Business & Financial | 113 (63.5%) | 65 (36.5%) |
| Computers, Engineering & Science | 69 (87.3%) | 10 (12.7%) |
| Computers & Mathematics | 69 (87.3%) | 10 (12.7%) |
| Architecture & Engineering | 0 (0.0%) | 0 (0.0%) |
| Life, Physical & Social Science | 0 (0.0%) | 0 (0.0%) |
| Community & Social Service | 163 (71.5%) | 65 (28.5%) |
| Education, Arts & Media | 0 (0.0%) | 11 (100.0%) |
| Legal Services & Support | 0 (0.0%) | 0 (0.0%) |
| Education Instruction & Library | 31 (36.5%) | 54 (63.5%) |
| Arts, Media & Entertainment | 132 (100.0%) | 0 (0.0%) |
| Health Diagnosing & Treating | 17 (13.7%) | 107 (86.3%) |
| Health Technologists | 17 (28.8%) | 42 (71.2%) |
| Total (Category) | 475 (55.0%) | 389 (45.0%) |
| Total (Overall) | 1,337 (57.6%) | 983 (42.4%) |
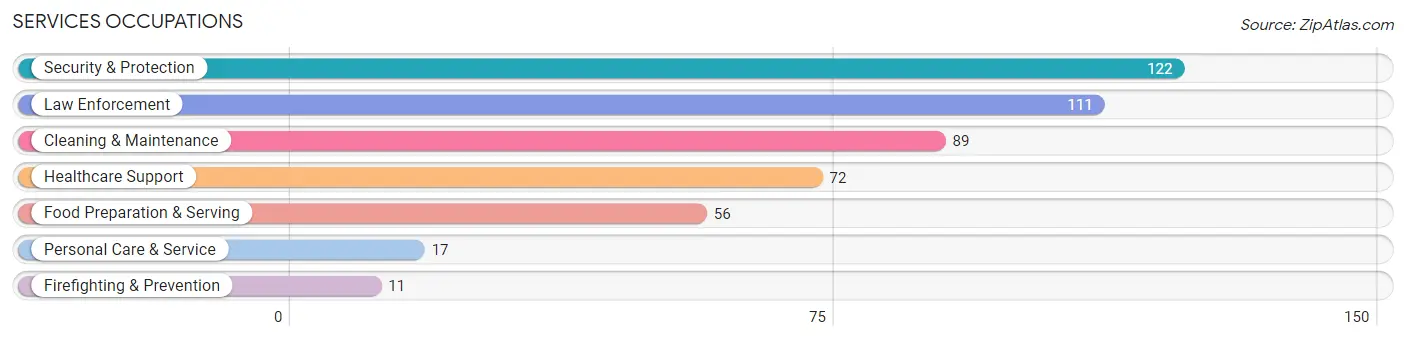
Services Occupations
The most common Services occupations in Chester are Security & Protection (122 | 5.3%), Law Enforcement (111 | 4.8%), Cleaning & Maintenance (89 | 3.8%), Healthcare Support (72 | 3.1%), and Food Preparation & Serving (56 | 2.4%).
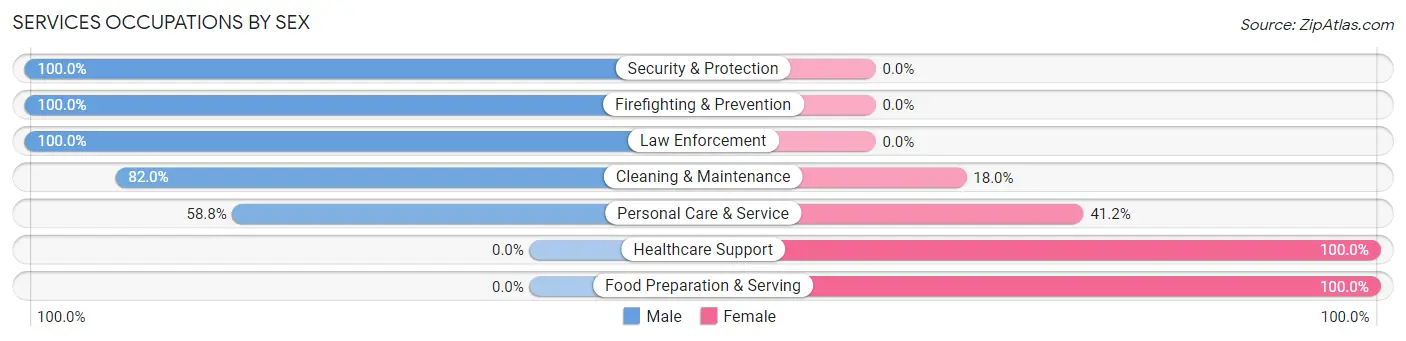
Services Occupations by Sex
Within the Services occupations in Chester, the most male-oriented occupations are Security & Protection (100.0%), Firefighting & Prevention (100.0%), and Law Enforcement (100.0%), while the most female-oriented occupations are Healthcare Support (100.0%), Food Preparation & Serving (100.0%), and Personal Care & Service (41.2%).
| Occupation | Male | Female |
| Healthcare Support | 0 (0.0%) | 72 (100.0%) |
| Security & Protection | 122 (100.0%) | 0 (0.0%) |
| Firefighting & Prevention | 11 (100.0%) | 0 (0.0%) |
| Law Enforcement | 111 (100.0%) | 0 (0.0%) |
| Food Preparation & Serving | 0 (0.0%) | 56 (100.0%) |
| Cleaning & Maintenance | 73 (82.0%) | 16 (18.0%) |
| Personal Care & Service | 10 (58.8%) | 7 (41.2%) |
| Total (Category) | 205 (57.6%) | 151 (42.4%) |
| Total (Overall) | 1,337 (57.6%) | 983 (42.4%) |
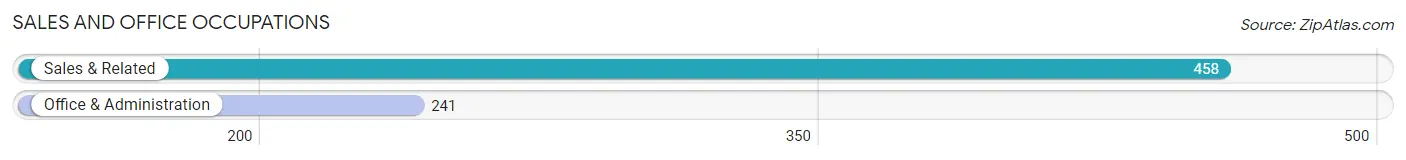
Sales and Office Occupations
The most common Sales and Office occupations in Chester are Sales & Related (458 | 19.7%), and Office & Administration (241 | 10.4%).
Sales and Office Occupations by Sex
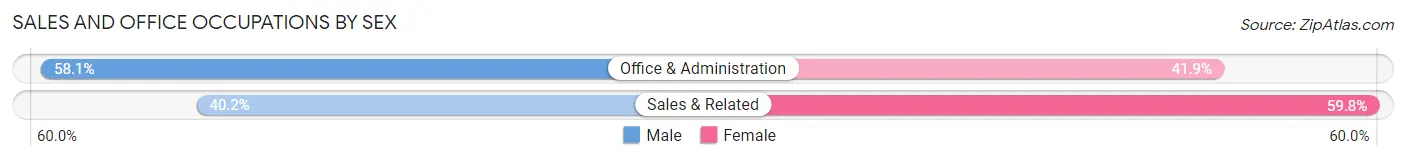
| Occupation | Male | Female |
| Sales & Related | 184 (40.2%) | 274 (59.8%) |
| Office & Administration | 140 (58.1%) | 101 (41.9%) |
| Total (Category) | 324 (46.4%) | 375 (53.6%) |
| Total (Overall) | 1,337 (57.6%) | 983 (42.4%) |
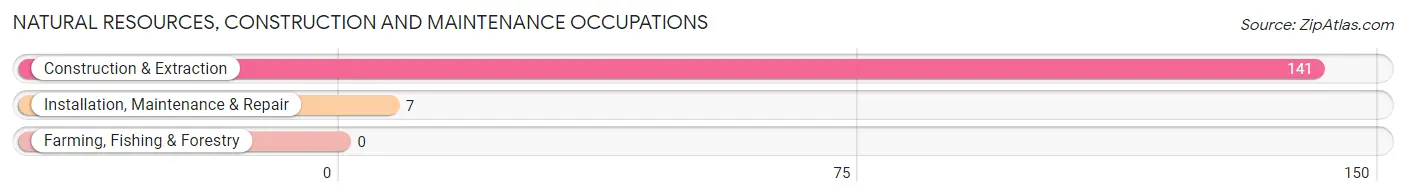
Natural Resources, Construction and Maintenance Occupations
The most common Natural Resources, Construction and Maintenance occupations in Chester are Construction & Extraction (141 | 6.1%), and Installation, Maintenance & Repair (7 | 0.3%).
Natural Resources, Construction and Maintenance Occupations by Sex
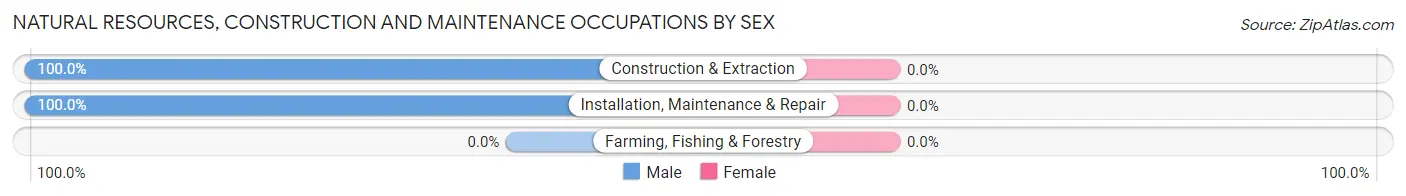
| Occupation | Male | Female |
| Farming, Fishing & Forestry | 0 (0.0%) | 0 (0.0%) |
| Construction & Extraction | 141 (100.0%) | 0 (0.0%) |
| Installation, Maintenance & Repair | 7 (100.0%) | 0 (0.0%) |
| Total (Category) | 148 (100.0%) | 0 (0.0%) |
| Total (Overall) | 1,337 (57.6%) | 983 (42.4%) |
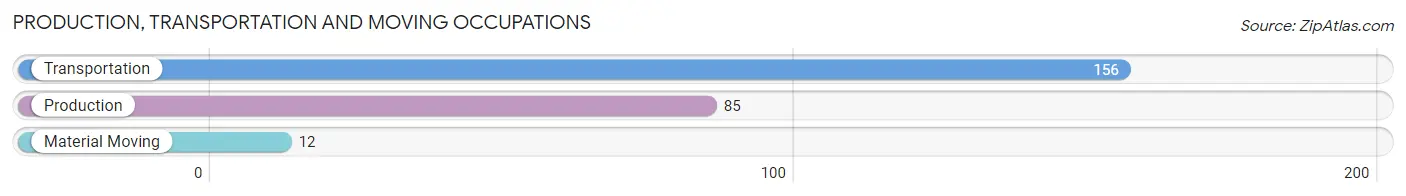
Production, Transportation and Moving Occupations
The most common Production, Transportation and Moving occupations in Chester are Transportation (156 | 6.7%), Production (85 | 3.7%), and Material Moving (12 | 0.5%).
Production, Transportation and Moving Occupations by Sex
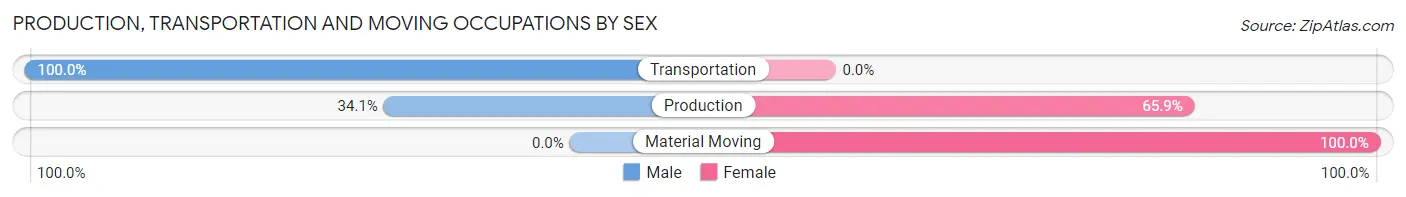
| Occupation | Male | Female |
| Production | 29 (34.1%) | 56 (65.9%) |
| Transportation | 156 (100.0%) | 0 (0.0%) |
| Material Moving | 0 (0.0%) | 12 (100.0%) |
| Total (Category) | 185 (73.1%) | 68 (26.9%) |
| Total (Overall) | 1,337 (57.6%) | 983 (42.4%) |
Employment Industries by Sex in Chester
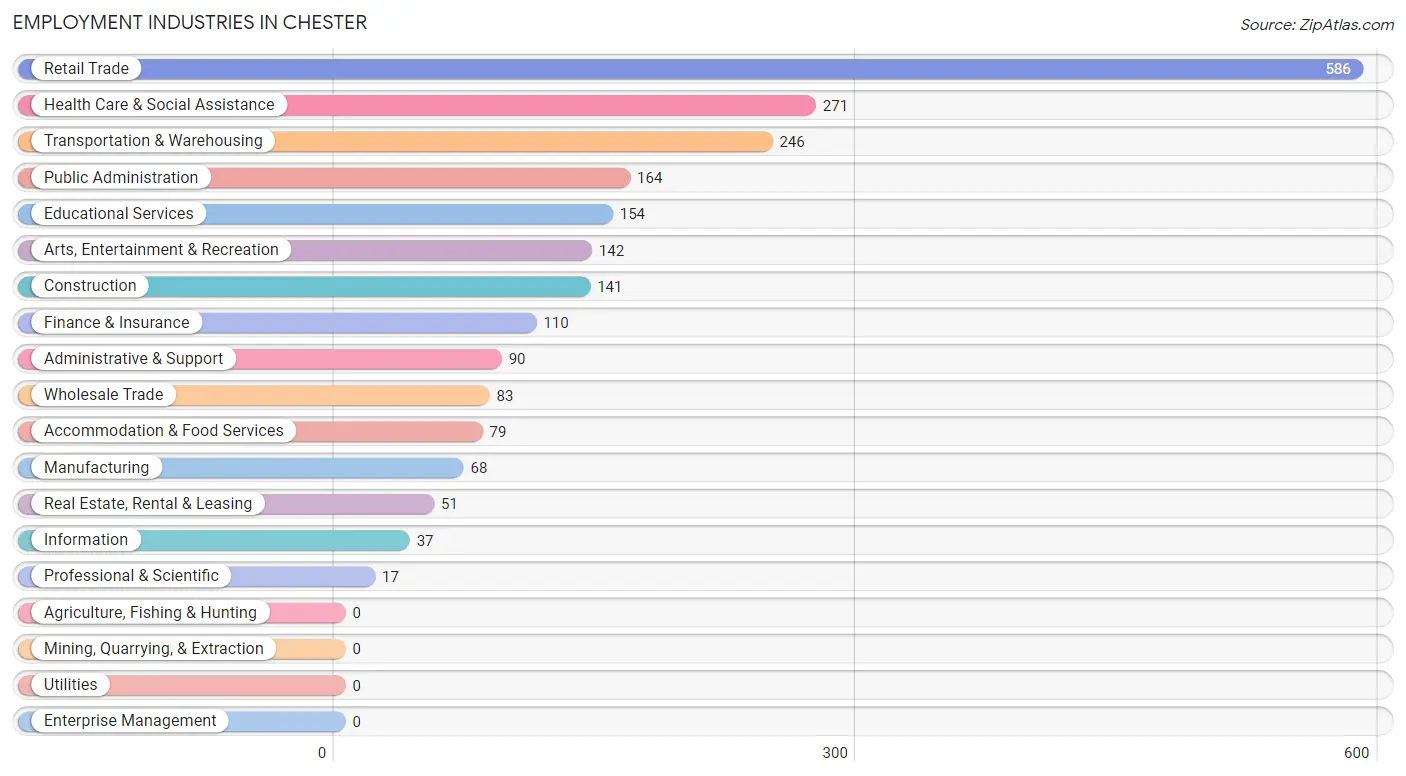
Employment Industries in Chester
The major employment industries in Chester include Retail Trade (586 | 25.3%), Health Care & Social Assistance (271 | 11.7%), Transportation & Warehousing (246 | 10.6%), Public Administration (164 | 7.1%), and Educational Services (154 | 6.6%).
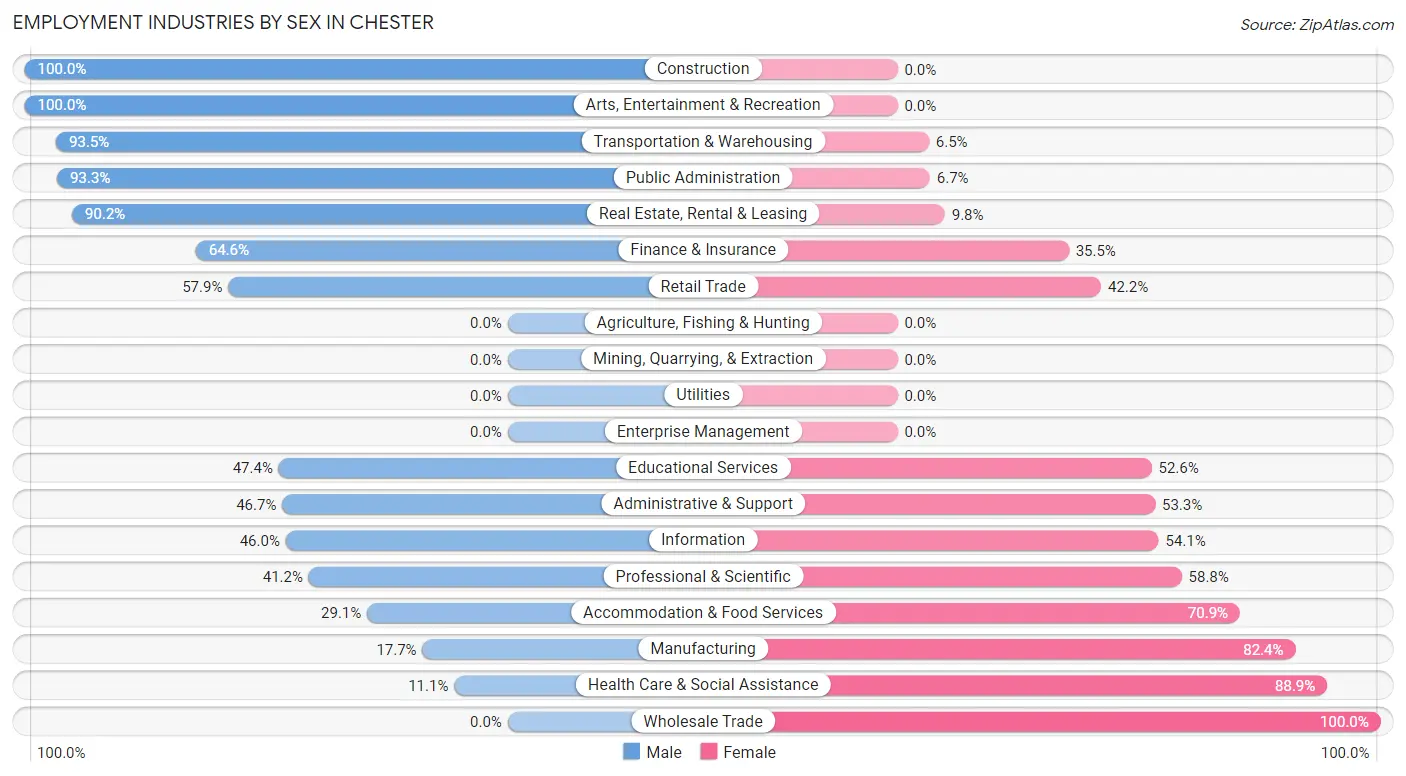
Employment Industries by Sex in Chester
The Chester industries that see more men than women are Construction (100.0%), Arts, Entertainment & Recreation (100.0%), and Transportation & Warehousing (93.5%), whereas the industries that tend to have a higher number of women are Wholesale Trade (100.0%), Health Care & Social Assistance (88.9%), and Manufacturing (82.4%).
| Industry | Male | Female |
| Agriculture, Fishing & Hunting | 0 (0.0%) | 0 (0.0%) |
| Mining, Quarrying, & Extraction | 0 (0.0%) | 0 (0.0%) |
| Construction | 141 (100.0%) | 0 (0.0%) |
| Manufacturing | 12 (17.6%) | 56 (82.4%) |
| Wholesale Trade | 0 (0.0%) | 83 (100.0%) |
| Retail Trade | 339 (57.9%) | 247 (42.1%) |
| Transportation & Warehousing | 230 (93.5%) | 16 (6.5%) |
| Utilities | 0 (0.0%) | 0 (0.0%) |
| Information | 17 (46.0%) | 20 (54.0%) |
| Finance & Insurance | 71 (64.5%) | 39 (35.4%) |
| Real Estate, Rental & Leasing | 46 (90.2%) | 5 (9.8%) |
| Professional & Scientific | 7 (41.2%) | 10 (58.8%) |
| Enterprise Management | 0 (0.0%) | 0 (0.0%) |
| Administrative & Support | 42 (46.7%) | 48 (53.3%) |
| Educational Services | 73 (47.4%) | 81 (52.6%) |
| Health Care & Social Assistance | 30 (11.1%) | 241 (88.9%) |
| Arts, Entertainment & Recreation | 142 (100.0%) | 0 (0.0%) |
| Accommodation & Food Services | 23 (29.1%) | 56 (70.9%) |
| Public Administration | 153 (93.3%) | 11 (6.7%) |
| Total | 1,337 (57.6%) | 983 (42.4%) |
Education in Chester
School Enrollment in Chester
The most common levels of schooling among the 981 students in Chester are high school (486 | 49.5%), middle school (247 | 25.2%), and elementary school (122 | 12.4%).
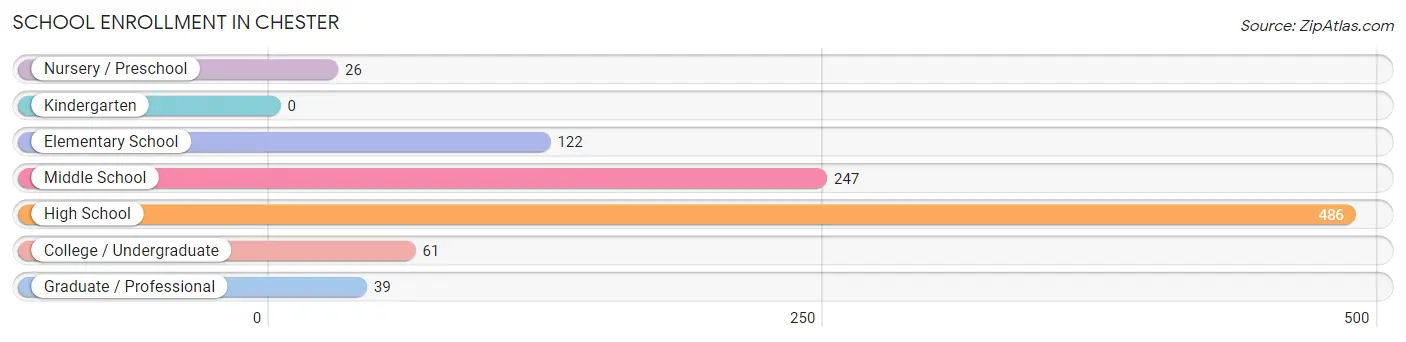
| School Level | # Students | % Students |
| Nursery / Preschool | 26 | 2.6% |
| Kindergarten | 0 | 0.0% |
| Elementary School | 122 | 12.4% |
| Middle School | 247 | 25.2% |
| High School | 486 | 49.5% |
| College / Undergraduate | 61 | 6.2% |
| Graduate / Professional | 39 | 4.0% |
| Total | 981 | 100.0% |
School Enrollment by Age by Funding Source in Chester
Out of a total of 981 students who are enrolled in schools in Chester, 201 (20.5%) attend a private institution, while the remaining 780 (79.5%) are enrolled in public schools. The age group of 25 to 34 year olds has the highest likelihood of being enrolled in private schools, with 39 (100.0% in the age bracket) enrolled. Conversely, the age group of 3 to 4 year olds has the lowest likelihood of being enrolled in a private school, with 26 (100.0% in the age bracket) attending a public institution.
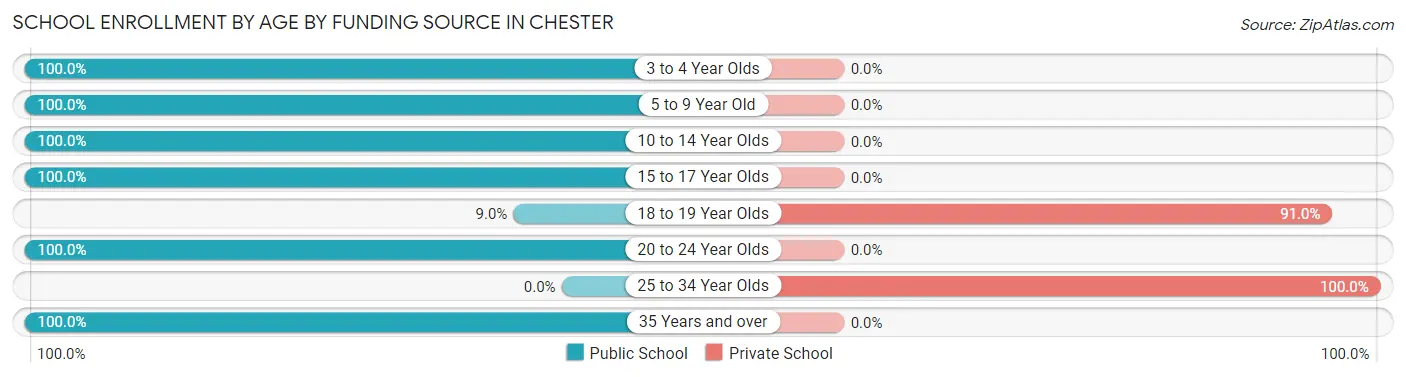
| Age Bracket | Public School | Private School |
| 3 to 4 Year Olds | 26 (100.0%) | 0 (0.0%) |
| 5 to 9 Year Old | 122 (100.0%) | 0 (0.0%) |
| 10 to 14 Year Olds | 354 (100.0%) | 0 (0.0%) |
| 15 to 17 Year Olds | 217 (100.0%) | 0 (0.0%) |
| 18 to 19 Year Olds | 16 (9.0%) | 162 (91.0%) |
| 20 to 24 Year Olds | 10 (100.0%) | 0 (0.0%) |
| 25 to 34 Year Olds | 0 (0.0%) | 39 (100.0%) |
| 35 Years and over | 35 (100.0%) | 0 (0.0%) |
| Total | 780 (79.5%) | 201 (20.5%) |
Educational Attainment by Field of Study in Chester
Physical & health sciences (185 | 18.6%), business (156 | 15.7%), education (141 | 14.2%), liberal arts & history (96 | 9.7%), and science & technology (84 | 8.5%) are the most common fields of study among 994 individuals in Chester who have obtained a bachelor's degree or higher.
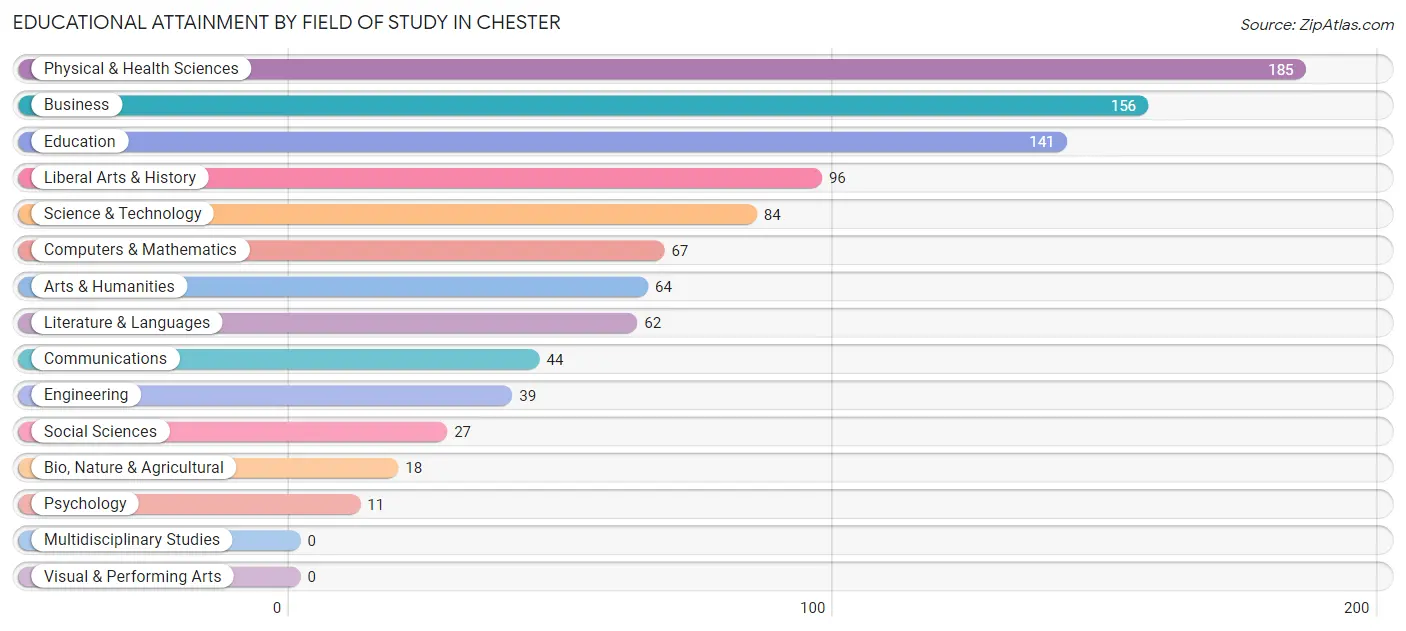
| Field of Study | # Graduates | % Graduates |
| Computers & Mathematics | 67 | 6.7% |
| Bio, Nature & Agricultural | 18 | 1.8% |
| Physical & Health Sciences | 185 | 18.6% |
| Psychology | 11 | 1.1% |
| Social Sciences | 27 | 2.7% |
| Engineering | 39 | 3.9% |
| Multidisciplinary Studies | 0 | 0.0% |
| Science & Technology | 84 | 8.5% |
| Business | 156 | 15.7% |
| Education | 141 | 14.2% |
| Literature & Languages | 62 | 6.2% |
| Liberal Arts & History | 96 | 9.7% |
| Visual & Performing Arts | 0 | 0.0% |
| Communications | 44 | 4.4% |
| Arts & Humanities | 64 | 6.4% |
| Total | 994 | 100.0% |
Transportation & Commute in Chester
Vehicle Availability by Sex in Chester
The most prevalent vehicle ownership categories in Chester are males with 2 vehicles (678, accounting for 54.9%) and females with 2 vehicles (411, making up 70.2%).
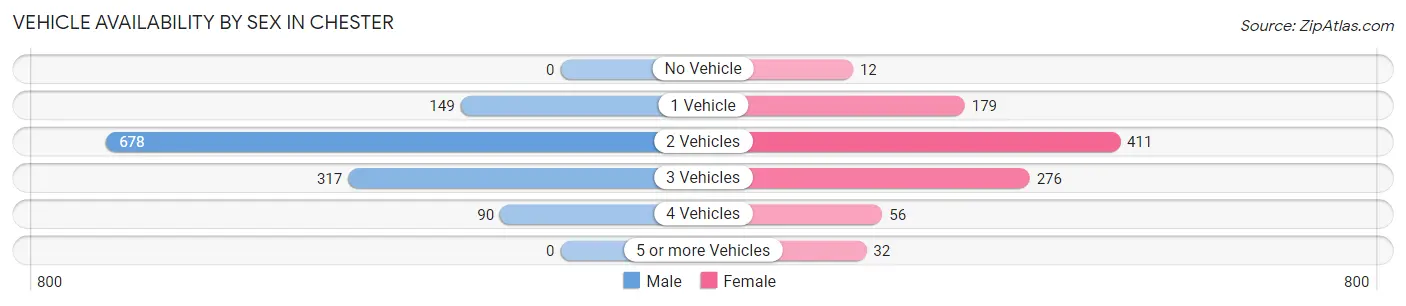
| Vehicles Available | Male | Female |
| No Vehicle | 0 (0.0%) | 12 (1.2%) |
| 1 Vehicle | 149 (12.1%) | 179 (18.5%) |
| 2 Vehicles | 678 (54.9%) | 411 (42.5%) |
| 3 Vehicles | 317 (25.7%) | 276 (28.6%) |
| 4 Vehicles | 90 (7.3%) | 56 (5.8%) |
| 5 or more Vehicles | 0 (0.0%) | 32 (3.3%) |
| Total | 1,234 (100.0%) | 966 (100.0%) |
Commute Time in Chester
The most frequently occuring commute durations in Chester are 60 to 89 minutes (535 commuters, 25.9%), 10 to 14 minutes (347 commuters, 16.8%), and 30 to 34 minutes (211 commuters, 10.2%).
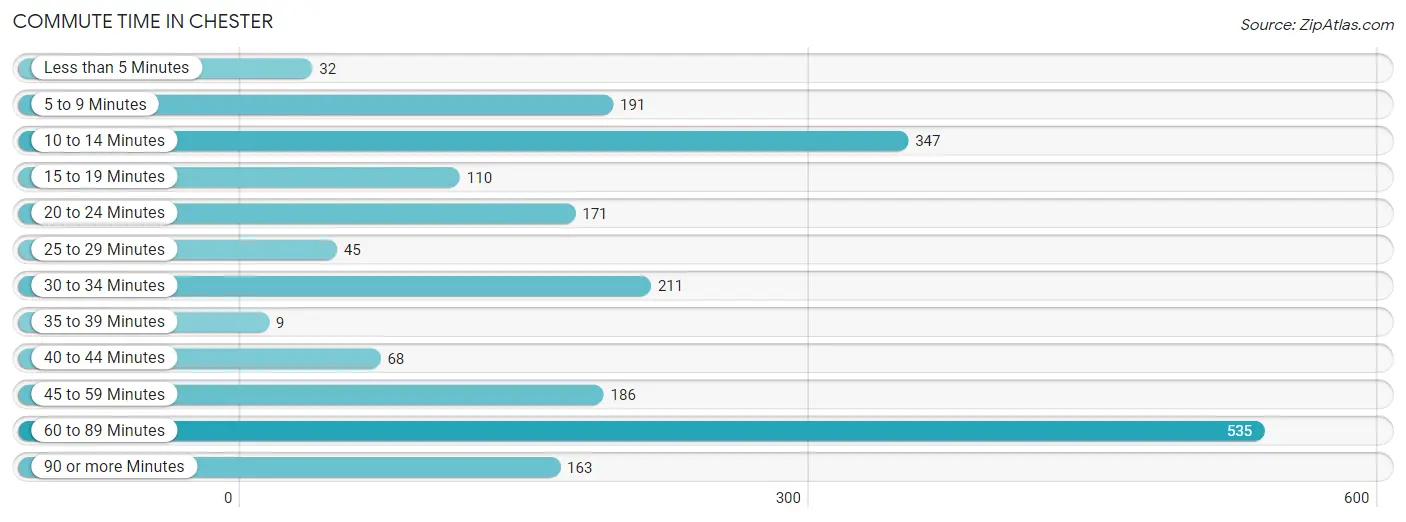
| Commute Time | # Commuters | % Commuters |
| Less than 5 Minutes | 32 | 1.5% |
| 5 to 9 Minutes | 191 | 9.2% |
| 10 to 14 Minutes | 347 | 16.8% |
| 15 to 19 Minutes | 110 | 5.3% |
| 20 to 24 Minutes | 171 | 8.3% |
| 25 to 29 Minutes | 45 | 2.2% |
| 30 to 34 Minutes | 211 | 10.2% |
| 35 to 39 Minutes | 9 | 0.4% |
| 40 to 44 Minutes | 68 | 3.3% |
| 45 to 59 Minutes | 186 | 9.0% |
| 60 to 89 Minutes | 535 | 25.9% |
| 90 or more Minutes | 163 | 7.9% |
Commute Time by Sex in Chester
The most common commute times in Chester are 60 to 89 minutes (440 commuters, 37.9%) for males and 10 to 14 minutes (245 commuters, 27.0%) for females.
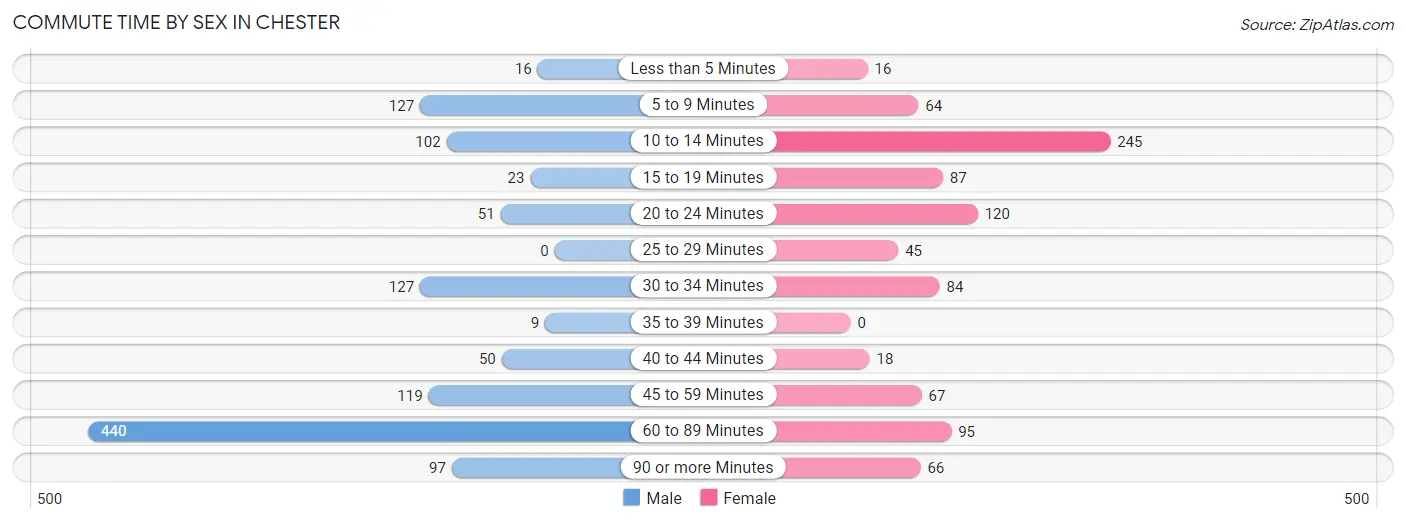
| Commute Time | Male | Female |
| Less than 5 Minutes | 16 (1.4%) | 16 (1.8%) |
| 5 to 9 Minutes | 127 (10.9%) | 64 (7.1%) |
| 10 to 14 Minutes | 102 (8.8%) | 245 (27.0%) |
| 15 to 19 Minutes | 23 (2.0%) | 87 (9.6%) |
| 20 to 24 Minutes | 51 (4.4%) | 120 (13.2%) |
| 25 to 29 Minutes | 0 (0.0%) | 45 (5.0%) |
| 30 to 34 Minutes | 127 (10.9%) | 84 (9.3%) |
| 35 to 39 Minutes | 9 (0.8%) | 0 (0.0%) |
| 40 to 44 Minutes | 50 (4.3%) | 18 (2.0%) |
| 45 to 59 Minutes | 119 (10.2%) | 67 (7.4%) |
| 60 to 89 Minutes | 440 (37.9%) | 95 (10.5%) |
| 90 or more Minutes | 97 (8.4%) | 66 (7.3%) |
Time of Departure to Work by Sex in Chester
The most frequent times of departure to work in Chester are 12:00 AM to 4:59 AM (364, 31.4%) for males and 7:00 AM to 7:29 AM (217, 23.9%) for females.
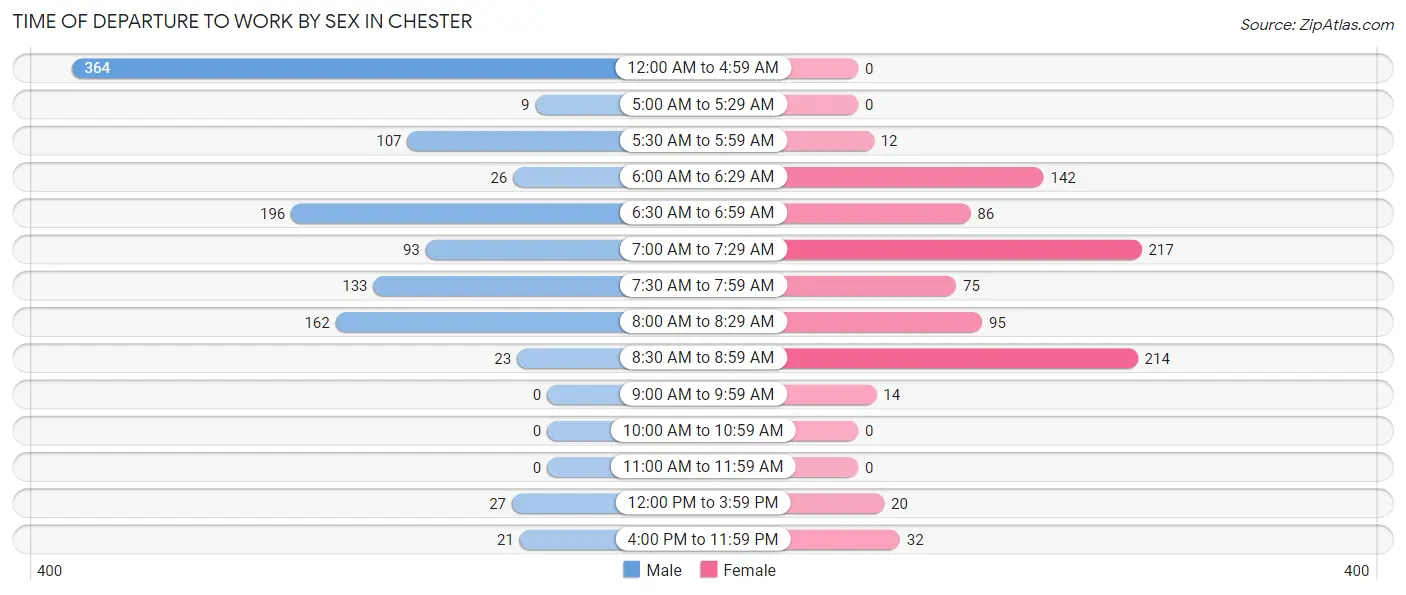
| Time of Departure | Male | Female |
| 12:00 AM to 4:59 AM | 364 (31.4%) | 0 (0.0%) |
| 5:00 AM to 5:29 AM | 9 (0.8%) | 0 (0.0%) |
| 5:30 AM to 5:59 AM | 107 (9.2%) | 12 (1.3%) |
| 6:00 AM to 6:29 AM | 26 (2.2%) | 142 (15.7%) |
| 6:30 AM to 6:59 AM | 196 (16.9%) | 86 (9.5%) |
| 7:00 AM to 7:29 AM | 93 (8.0%) | 217 (23.9%) |
| 7:30 AM to 7:59 AM | 133 (11.5%) | 75 (8.3%) |
| 8:00 AM to 8:29 AM | 162 (14.0%) | 95 (10.5%) |
| 8:30 AM to 8:59 AM | 23 (2.0%) | 214 (23.6%) |
| 9:00 AM to 9:59 AM | 0 (0.0%) | 14 (1.5%) |
| 10:00 AM to 10:59 AM | 0 (0.0%) | 0 (0.0%) |
| 11:00 AM to 11:59 AM | 0 (0.0%) | 0 (0.0%) |
| 12:00 PM to 3:59 PM | 27 (2.3%) | 20 (2.2%) |
| 4:00 PM to 11:59 PM | 21 (1.8%) | 32 (3.5%) |
| Total | 1,161 (100.0%) | 907 (100.0%) |
Housing Occupancy in Chester
Occupancy by Ownership in Chester
Of the total 1,554 dwellings in Chester, owner-occupied units account for 848 (54.6%), while renter-occupied units make up 706 (45.4%).
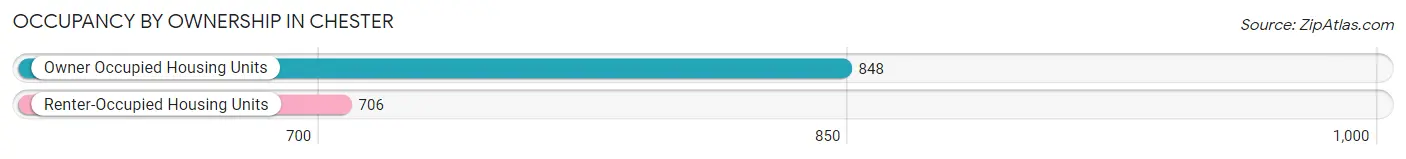
| Occupancy | # Housing Units | % Housing Units |
| Owner Occupied Housing Units | 848 | 54.6% |
| Renter-Occupied Housing Units | 706 | 45.4% |
| Total Occupied Housing Units | 1,554 | 100.0% |
Occupancy by Household Size in Chester
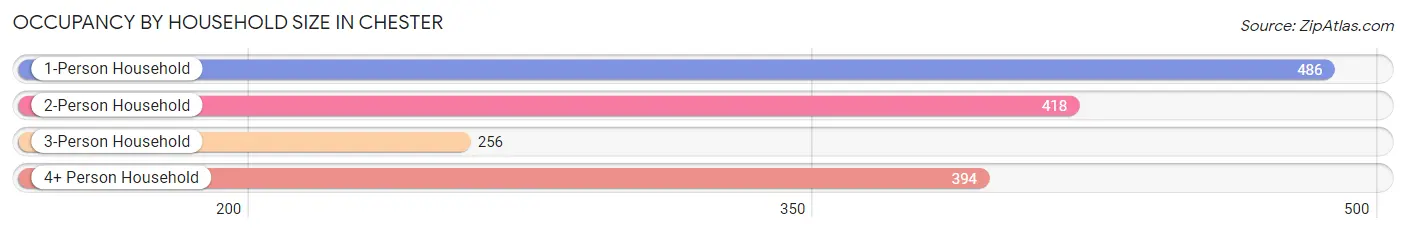
| Household Size | # Housing Units | % Housing Units |
| 1-Person Household | 486 | 31.3% |
| 2-Person Household | 418 | 26.9% |
| 3-Person Household | 256 | 16.5% |
| 4+ Person Household | 394 | 25.4% |
| Total Housing Units | 1,554 | 100.0% |
Occupancy by Ownership by Household Size in Chester
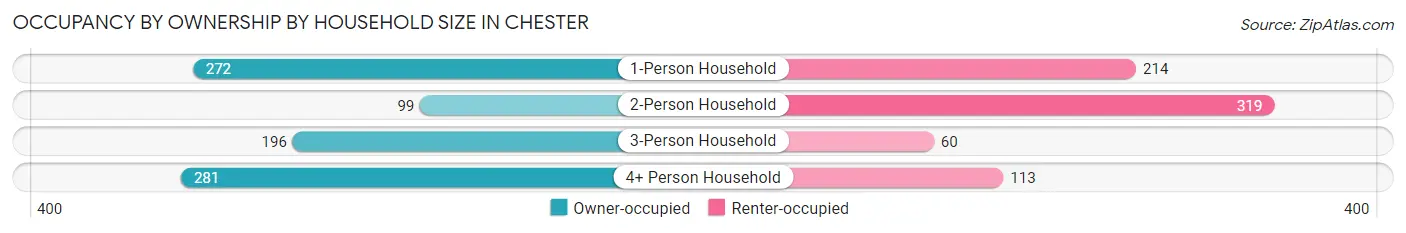
| Household Size | Owner-occupied | Renter-occupied |
| 1-Person Household | 272 (56.0%) | 214 (44.0%) |
| 2-Person Household | 99 (23.7%) | 319 (76.3%) |
| 3-Person Household | 196 (76.6%) | 60 (23.4%) |
| 4+ Person Household | 281 (71.3%) | 113 (28.7%) |
| Total Housing Units | 848 (54.6%) | 706 (45.4%) |
Occupancy by Educational Attainment in Chester
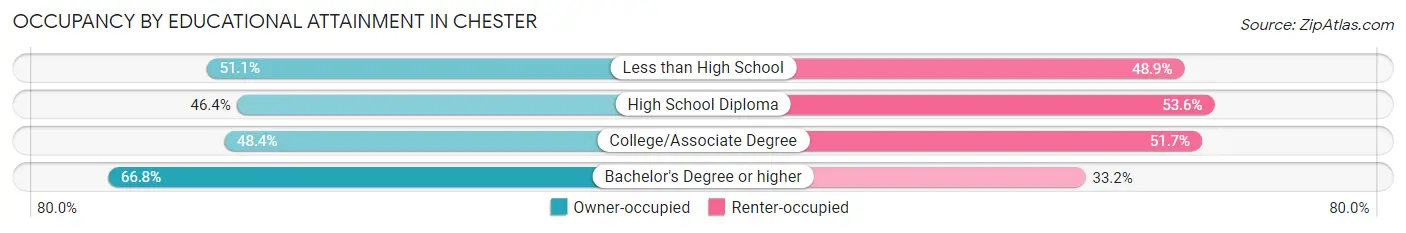
| Household Size | Owner-occupied | Renter-occupied |
| Less than High School | 90 (51.1%) | 86 (48.9%) |
| High School Diploma | 141 (46.4%) | 163 (53.6%) |
| College/Associate Degree | 263 (48.3%) | 281 (51.6%) |
| Bachelor's Degree or higher | 354 (66.8%) | 176 (33.2%) |
Occupancy by Age of Householder in Chester
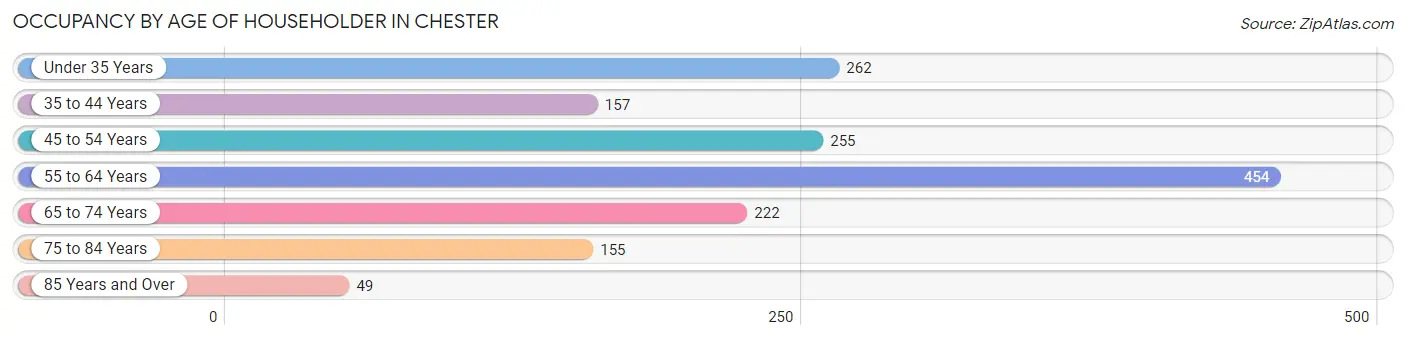
| Age Bracket | # Households | % Households |
| Under 35 Years | 262 | 16.9% |
| 35 to 44 Years | 157 | 10.1% |
| 45 to 54 Years | 255 | 16.4% |
| 55 to 64 Years | 454 | 29.2% |
| 65 to 74 Years | 222 | 14.3% |
| 75 to 84 Years | 155 | 10.0% |
| 85 Years and Over | 49 | 3.2% |
| Total | 1,554 | 100.0% |
Housing Finances in Chester
Median Income by Occupancy in Chester
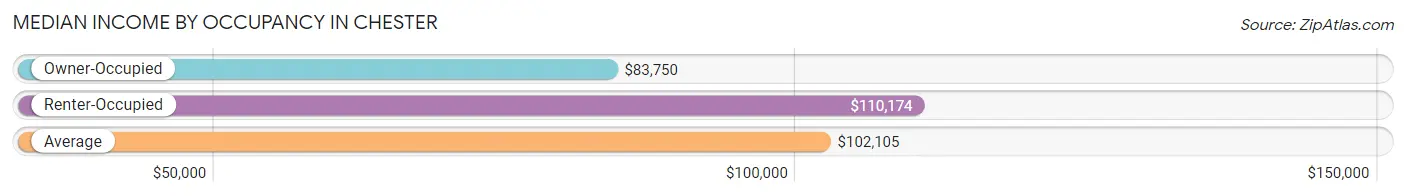
| Occupancy Type | # Households | Median Income |
| Owner-Occupied | 848 (54.6%) | $83,750 |
| Renter-Occupied | 706 (45.4%) | $110,174 |
| Average | 1,554 (100.0%) | $102,105 |
Occupancy by Householder Income Bracket in Chester
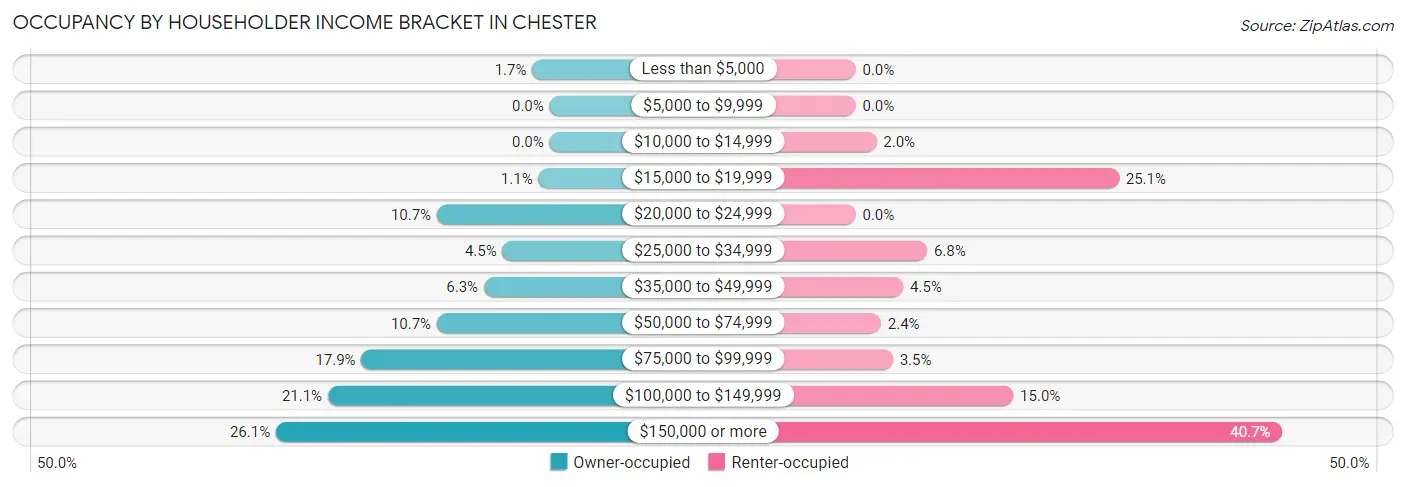
| Income Bracket | Owner-occupied | Renter-occupied |
| Less than $5,000 | 14 (1.7%) | 0 (0.0%) |
| $5,000 to $9,999 | 0 (0.0%) | 0 (0.0%) |
| $10,000 to $14,999 | 0 (0.0%) | 14 (2.0%) |
| $15,000 to $19,999 | 9 (1.1%) | 177 (25.1%) |
| $20,000 to $24,999 | 91 (10.7%) | 0 (0.0%) |
| $25,000 to $34,999 | 38 (4.5%) | 48 (6.8%) |
| $35,000 to $49,999 | 53 (6.2%) | 32 (4.5%) |
| $50,000 to $74,999 | 91 (10.7%) | 17 (2.4%) |
| $75,000 to $99,999 | 152 (17.9%) | 25 (3.5%) |
| $100,000 to $149,999 | 179 (21.1%) | 106 (15.0%) |
| $150,000 or more | 221 (26.1%) | 287 (40.6%) |
| Total | 848 (100.0%) | 706 (100.0%) |
Monthly Housing Cost Tiers in Chester
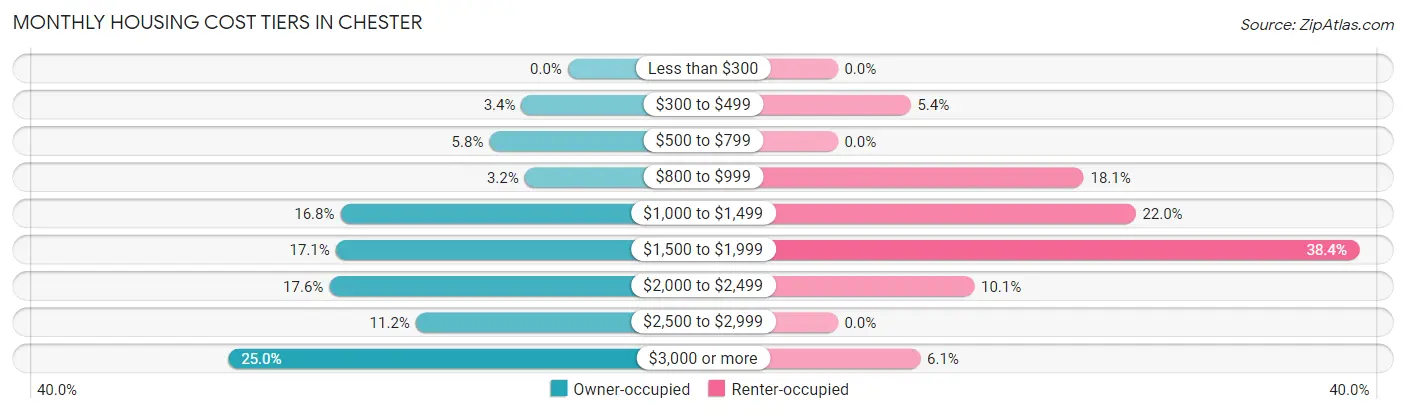
| Monthly Cost | Owner-occupied | Renter-occupied |
| Less than $300 | 0 (0.0%) | 0 (0.0%) |
| $300 to $499 | 29 (3.4%) | 38 (5.4%) |
| $500 to $799 | 49 (5.8%) | 0 (0.0%) |
| $800 to $999 | 27 (3.2%) | 128 (18.1%) |
| $1,000 to $1,499 | 142 (16.8%) | 155 (22.0%) |
| $1,500 to $1,999 | 145 (17.1%) | 271 (38.4%) |
| $2,000 to $2,499 | 149 (17.6%) | 71 (10.1%) |
| $2,500 to $2,999 | 95 (11.2%) | 0 (0.0%) |
| $3,000 or more | 212 (25.0%) | 43 (6.1%) |
| Total | 848 (100.0%) | 706 (100.0%) |
Physical Housing Characteristics in Chester
Housing Structures in Chester
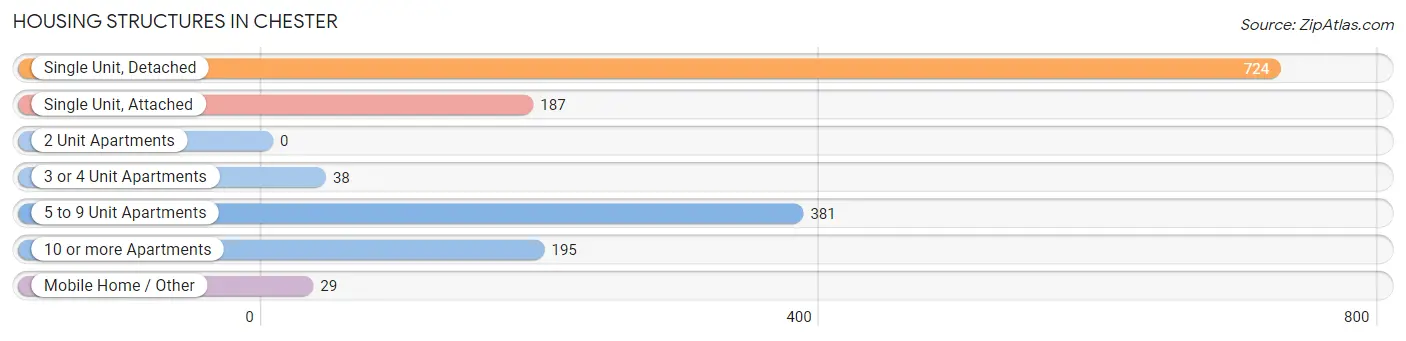
| Structure Type | # Housing Units | % Housing Units |
| Single Unit, Detached | 724 | 46.6% |
| Single Unit, Attached | 187 | 12.0% |
| 2 Unit Apartments | 0 | 0.0% |
| 3 or 4 Unit Apartments | 38 | 2.5% |
| 5 to 9 Unit Apartments | 381 | 24.5% |
| 10 or more Apartments | 195 | 12.6% |
| Mobile Home / Other | 29 | 1.9% |
| Total | 1,554 | 100.0% |
Housing Structures by Occupancy in Chester
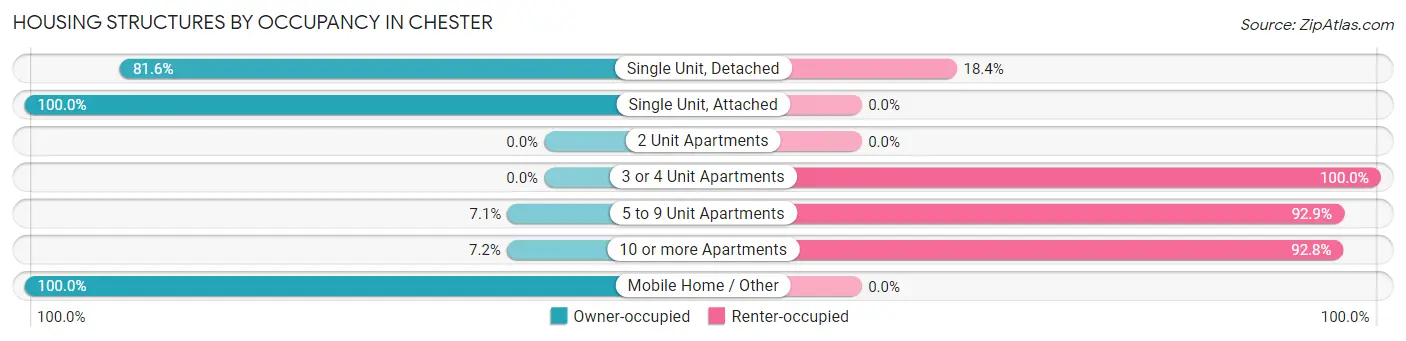
| Structure Type | Owner-occupied | Renter-occupied |
| Single Unit, Detached | 591 (81.6%) | 133 (18.4%) |
| Single Unit, Attached | 187 (100.0%) | 0 (0.0%) |
| 2 Unit Apartments | 0 (0.0%) | 0 (0.0%) |
| 3 or 4 Unit Apartments | 0 (0.0%) | 38 (100.0%) |
| 5 to 9 Unit Apartments | 27 (7.1%) | 354 (92.9%) |
| 10 or more Apartments | 14 (7.2%) | 181 (92.8%) |
| Mobile Home / Other | 29 (100.0%) | 0 (0.0%) |
| Total | 848 (54.6%) | 706 (45.4%) |
Housing Structures by Number of Rooms in Chester
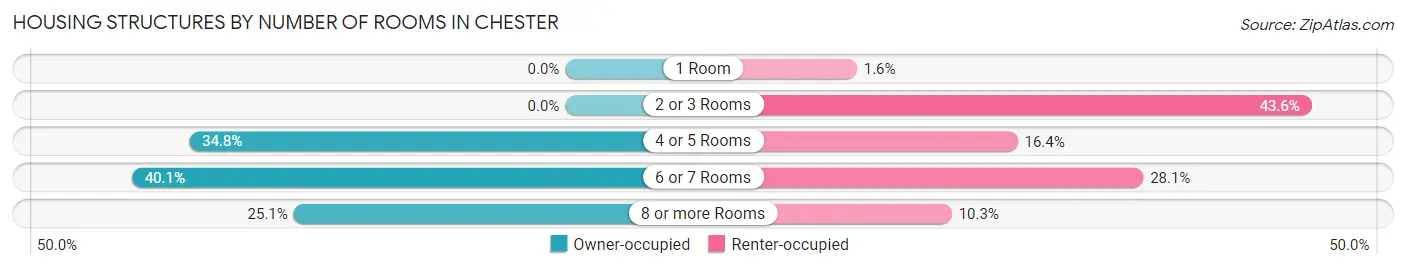
| Number of Rooms | Owner-occupied | Renter-occupied |
| 1 Room | 0 (0.0%) | 11 (1.6%) |
| 2 or 3 Rooms | 0 (0.0%) | 308 (43.6%) |
| 4 or 5 Rooms | 295 (34.8%) | 116 (16.4%) |
| 6 or 7 Rooms | 340 (40.1%) | 198 (28.1%) |
| 8 or more Rooms | 213 (25.1%) | 73 (10.3%) |
| Total | 848 (100.0%) | 706 (100.0%) |
Housing Structure by Heating Type in Chester
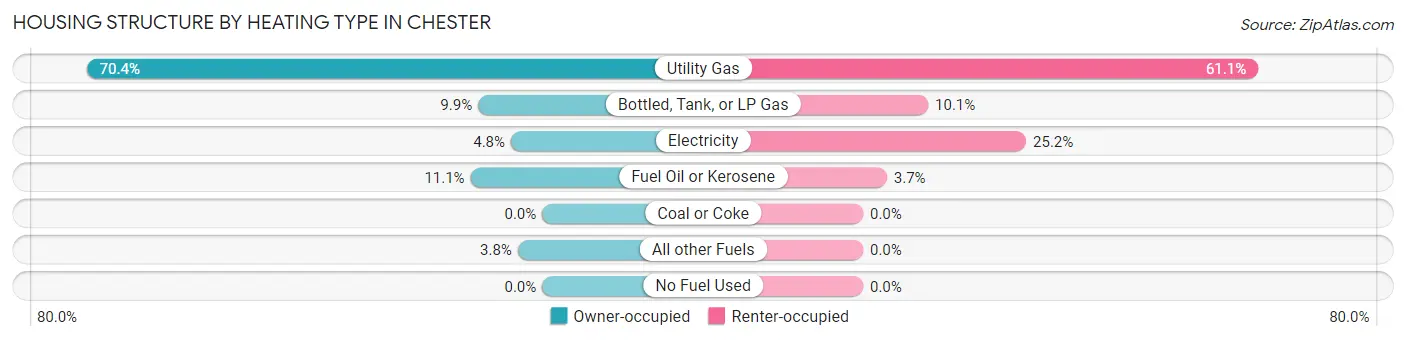
| Heating Type | Owner-occupied | Renter-occupied |
| Utility Gas | 597 (70.4%) | 431 (61.1%) |
| Bottled, Tank, or LP Gas | 84 (9.9%) | 71 (10.1%) |
| Electricity | 41 (4.8%) | 178 (25.2%) |
| Fuel Oil or Kerosene | 94 (11.1%) | 26 (3.7%) |
| Coal or Coke | 0 (0.0%) | 0 (0.0%) |
| All other Fuels | 32 (3.8%) | 0 (0.0%) |
| No Fuel Used | 0 (0.0%) | 0 (0.0%) |
| Total | 848 (100.0%) | 706 (100.0%) |
Household Vehicle Usage in Chester
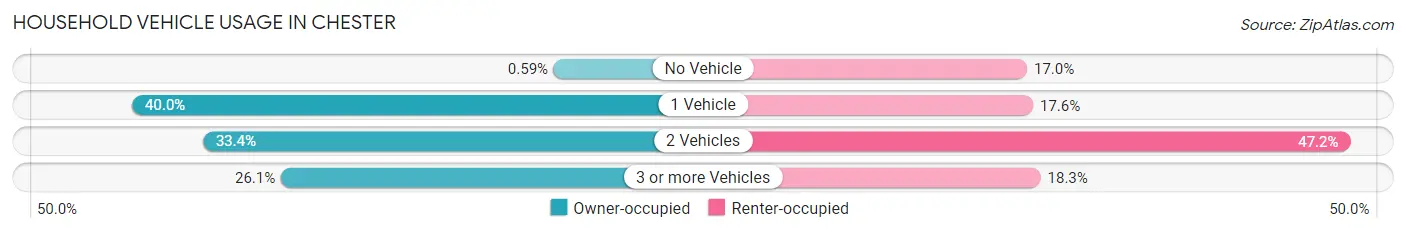
| Vehicles per Household | Owner-occupied | Renter-occupied |
| No Vehicle | 5 (0.6%) | 120 (17.0%) |
| 1 Vehicle | 339 (40.0%) | 124 (17.6%) |
| 2 Vehicles | 283 (33.4%) | 333 (47.2%) |
| 3 or more Vehicles | 221 (26.1%) | 129 (18.3%) |
| Total | 848 (100.0%) | 706 (100.0%) |
Real Estate & Mortgages in Chester
Real Estate and Mortgage Overview in Chester
| Characteristic | Without Mortgage | With Mortgage |
| Housing Units | 246 | 602 |
| Median Property Value | $241,700 | $281,500 |
| Median Household Income | - | - |
| Monthly Housing Costs | $1,042 | $212 |
| Real Estate Taxes | $6,000 | $0 |
Property Value by Mortgage Status in Chester
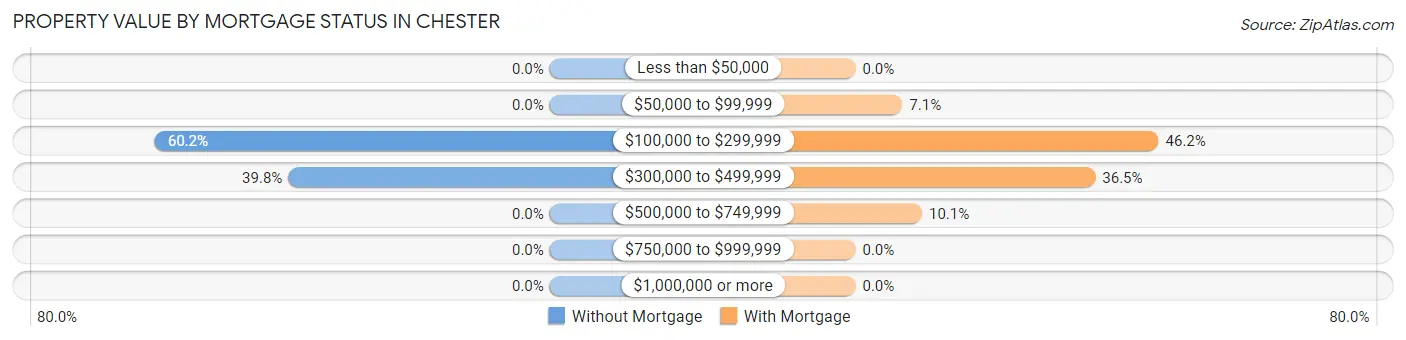
| Property Value | Without Mortgage | With Mortgage |
| Less than $50,000 | 0 (0.0%) | 0 (0.0%) |
| $50,000 to $99,999 | 0 (0.0%) | 43 (7.1%) |
| $100,000 to $299,999 | 148 (60.2%) | 278 (46.2%) |
| $300,000 to $499,999 | 98 (39.8%) | 220 (36.5%) |
| $500,000 to $749,999 | 0 (0.0%) | 61 (10.1%) |
| $750,000 to $999,999 | 0 (0.0%) | 0 (0.0%) |
| $1,000,000 or more | 0 (0.0%) | 0 (0.0%) |
| Total | 246 (100.0%) | 602 (100.0%) |
Household Income by Mortgage Status in Chester
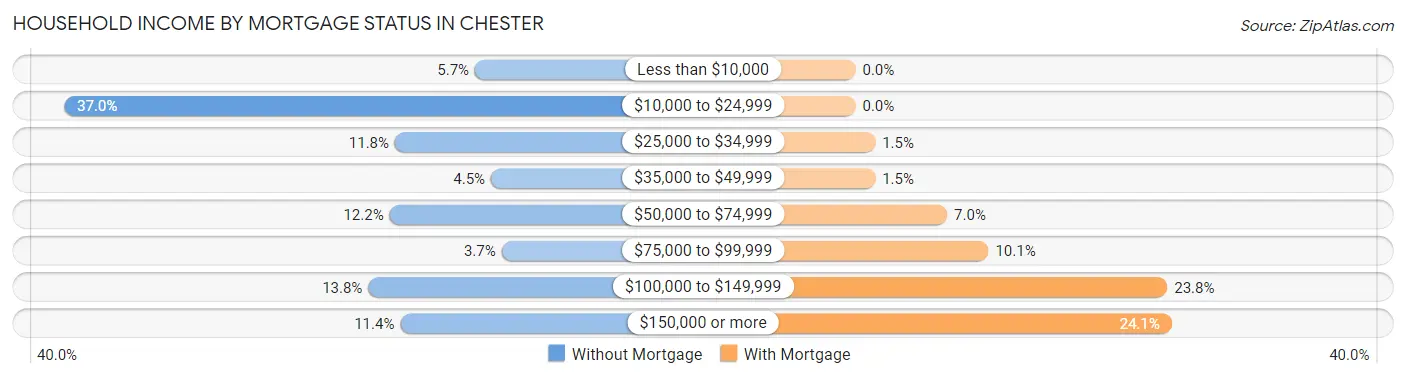
| Household Income | Without Mortgage | With Mortgage |
| Less than $10,000 | 14 (5.7%) | 0 (0.0%) |
| $10,000 to $24,999 | 91 (37.0%) | 0 (0.0%) |
| $25,000 to $34,999 | 29 (11.8%) | 9 (1.5%) |
| $35,000 to $49,999 | 11 (4.5%) | 9 (1.5%) |
| $50,000 to $74,999 | 30 (12.2%) | 42 (7.0%) |
| $75,000 to $99,999 | 9 (3.7%) | 61 (10.1%) |
| $100,000 to $149,999 | 34 (13.8%) | 143 (23.7%) |
| $150,000 or more | 28 (11.4%) | 145 (24.1%) |
| Total | 246 (100.0%) | 602 (100.0%) |
Property Value to Household Income Ratio in Chester
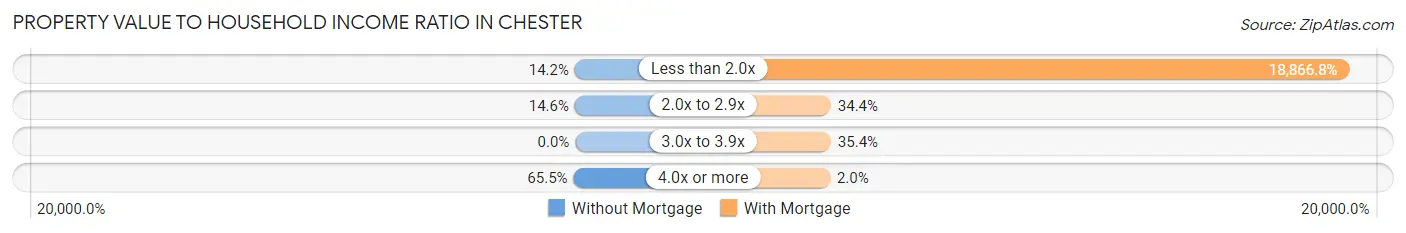
| Value-to-Income Ratio | Without Mortgage | With Mortgage |
| Less than 2.0x | 35 (14.2%) | 113,578 (18,866.8%) |
| 2.0x to 2.9x | 36 (14.6%) | 207 (34.4%) |
| 3.0x to 3.9x | 0 (0.0%) | 213 (35.4%) |
| 4.0x or more | 161 (65.4%) | 12 (2.0%) |
| Total | 246 (100.0%) | 602 (100.0%) |
Real Estate Taxes by Mortgage Status in Chester
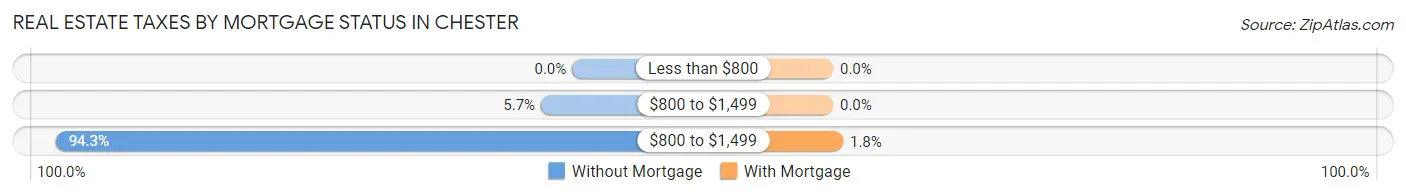
| Property Taxes | Without Mortgage | With Mortgage |
| Less than $800 | 0 (0.0%) | 0 (0.0%) |
| $800 to $1,499 | 14 (5.7%) | 0 (0.0%) |
| $800 to $1,499 | 232 (94.3%) | 11 (1.8%) |
| Total | 246 (100.0%) | 602 (100.0%) |
Health & Disability in Chester
Health Insurance Coverage by Age in Chester
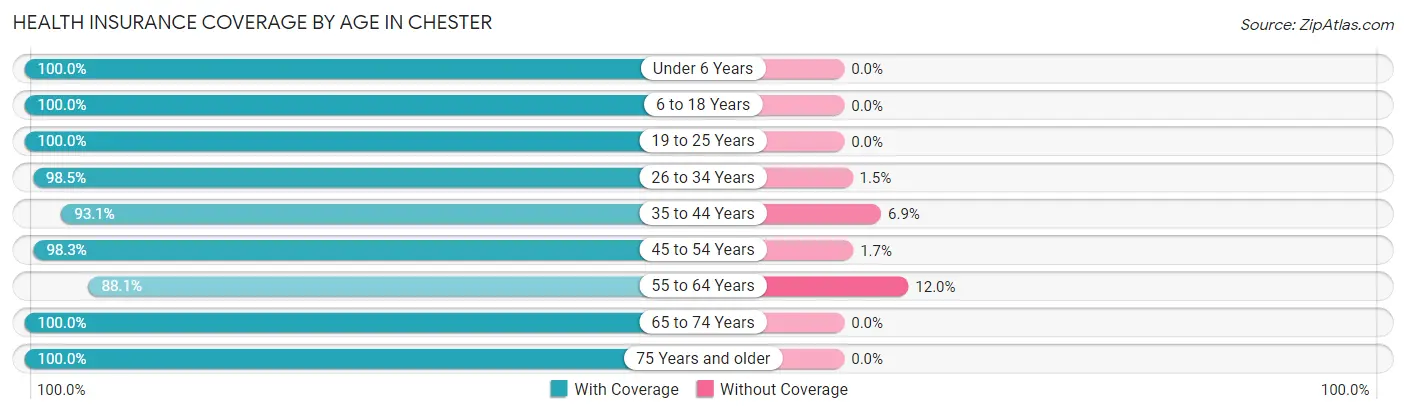
| Age Bracket | With Coverage | Without Coverage |
| Under 6 Years | 26 (100.0%) | 0 (0.0%) |
| 6 to 18 Years | 692 (100.0%) | 0 (0.0%) |
| 19 to 25 Years | 396 (100.0%) | 0 (0.0%) |
| 26 to 34 Years | 704 (98.5%) | 11 (1.5%) |
| 35 to 44 Years | 285 (93.1%) | 21 (6.9%) |
| 45 to 54 Years | 651 (98.3%) | 11 (1.7%) |
| 55 to 64 Years | 626 (88.0%) | 85 (11.9%) |
| 65 to 74 Years | 295 (100.0%) | 0 (0.0%) |
| 75 Years and older | 249 (100.0%) | 0 (0.0%) |
| Total | 3,924 (96.8%) | 128 (3.2%) |
Health Insurance Coverage by Citizenship Status in Chester
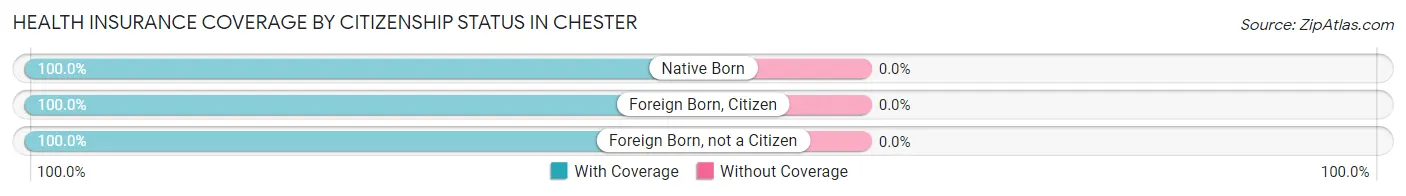
| Citizenship Status | With Coverage | Without Coverage |
| Native Born | 26 (100.0%) | 0 (0.0%) |
| Foreign Born, Citizen | 692 (100.0%) | 0 (0.0%) |
| Foreign Born, not a Citizen | 396 (100.0%) | 0 (0.0%) |
Health Insurance Coverage by Household Income in Chester
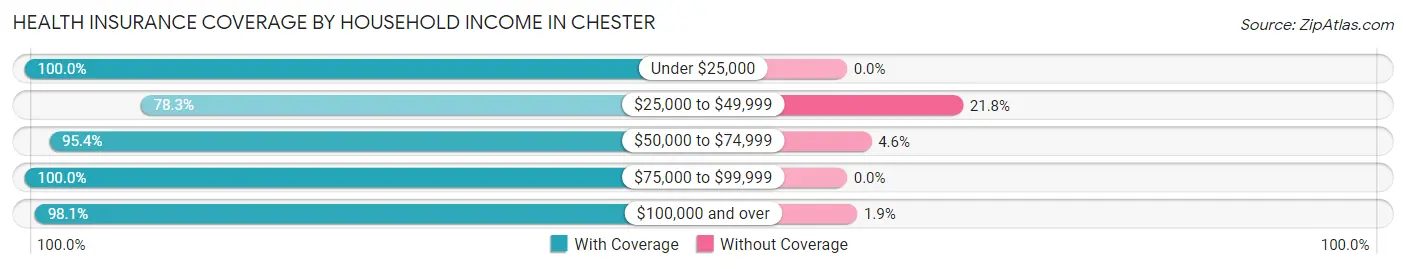
| Household Income | With Coverage | Without Coverage |
| Under $25,000 | 397 (100.0%) | 0 (0.0%) |
| $25,000 to $49,999 | 241 (78.2%) | 67 (21.7%) |
| $50,000 to $74,999 | 229 (95.4%) | 11 (4.6%) |
| $75,000 to $99,999 | 469 (100.0%) | 0 (0.0%) |
| $100,000 and over | 2,567 (98.1%) | 50 (1.9%) |
Public vs Private Health Insurance Coverage by Age in Chester
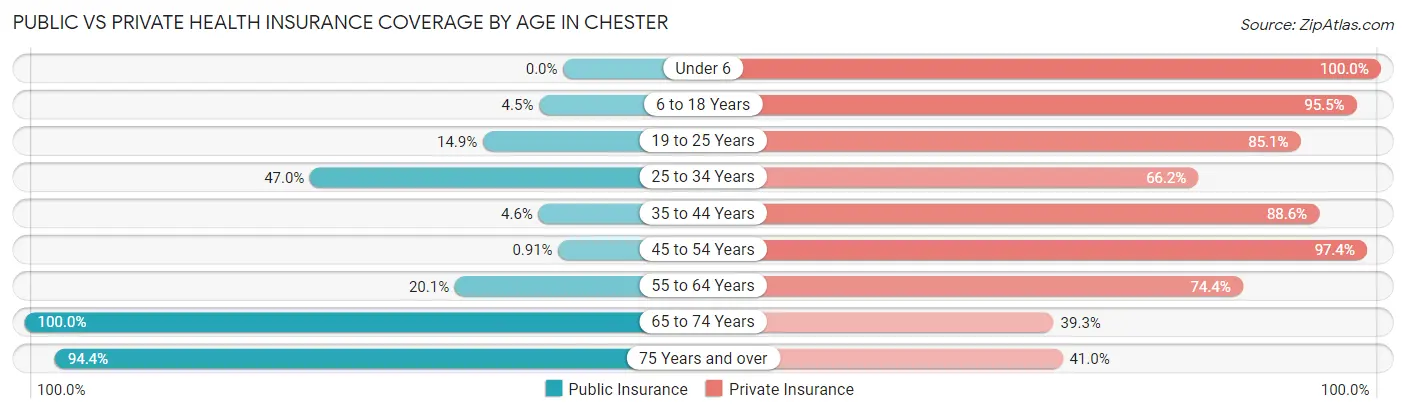
| Age Bracket | Public Insurance | Private Insurance |
| Under 6 | 0 (0.0%) | 26 (100.0%) |
| 6 to 18 Years | 31 (4.5%) | 661 (95.5%) |
| 19 to 25 Years | 59 (14.9%) | 337 (85.1%) |
| 25 to 34 Years | 336 (47.0%) | 473 (66.1%) |
| 35 to 44 Years | 14 (4.6%) | 271 (88.6%) |
| 45 to 54 Years | 6 (0.9%) | 645 (97.4%) |
| 55 to 64 Years | 143 (20.1%) | 529 (74.4%) |
| 65 to 74 Years | 295 (100.0%) | 116 (39.3%) |
| 75 Years and over | 235 (94.4%) | 102 (41.0%) |
| Total | 1,119 (27.6%) | 3,160 (78.0%) |
Disability Status by Sex by Age in Chester
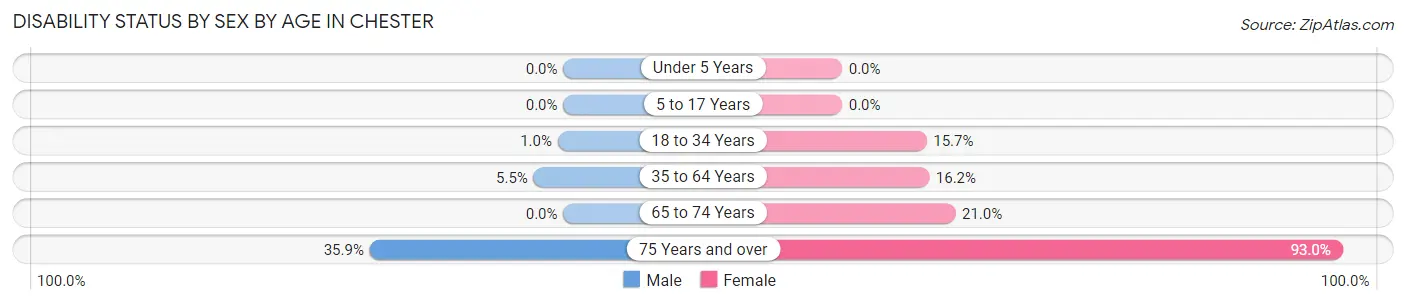
| Age Bracket | Male | Female |
| Under 5 Years | 0 (0.0%) | 0 (0.0%) |
| 5 to 17 Years | 0 (0.0%) | 0 (0.0%) |
| 18 to 34 Years | 6 (1.0%) | 83 (15.7%) |
| 35 to 64 Years | 43 (5.5%) | 145 (16.2%) |
| 65 to 74 Years | 0 (0.0%) | 37 (21.0%) |
| 75 Years and over | 23 (35.9%) | 172 (93.0%) |
Disability Class by Sex by Age in Chester
Disability Class: Hearing Difficulty

| Age Bracket | Male | Female |
| Under 5 Years | 0 (0.0%) | 0 (0.0%) |
| 5 to 17 Years | 0 (0.0%) | 0 (0.0%) |
| 18 to 34 Years | 0 (0.0%) | 0 (0.0%) |
| 35 to 64 Years | 43 (5.5%) | 0 (0.0%) |
| 65 to 74 Years | 0 (0.0%) | 22 (12.5%) |
| 75 Years and over | 0 (0.0%) | 107 (57.8%) |
Disability Class: Vision Difficulty
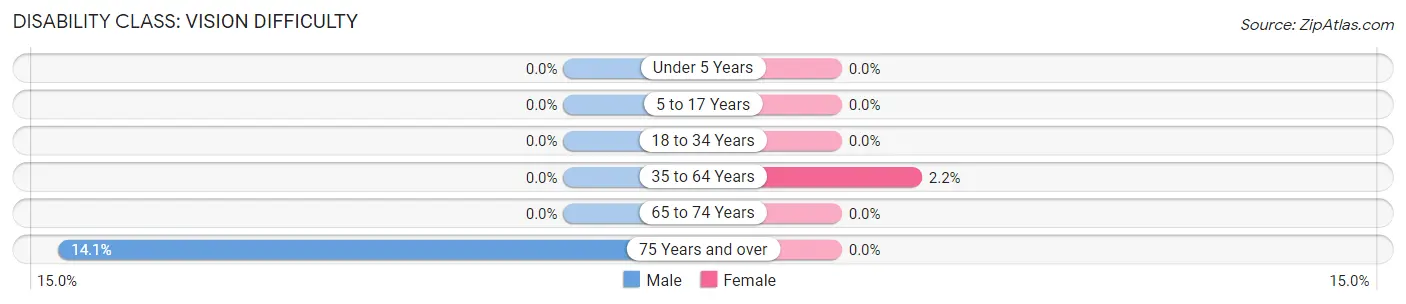
| Age Bracket | Male | Female |
| Under 5 Years | 0 (0.0%) | 0 (0.0%) |
| 5 to 17 Years | 0 (0.0%) | 0 (0.0%) |
| 18 to 34 Years | 0 (0.0%) | 0 (0.0%) |
| 35 to 64 Years | 0 (0.0%) | 20 (2.2%) |
| 65 to 74 Years | 0 (0.0%) | 0 (0.0%) |
| 75 Years and over | 9 (14.1%) | 0 (0.0%) |
Disability Class: Cognitive Difficulty
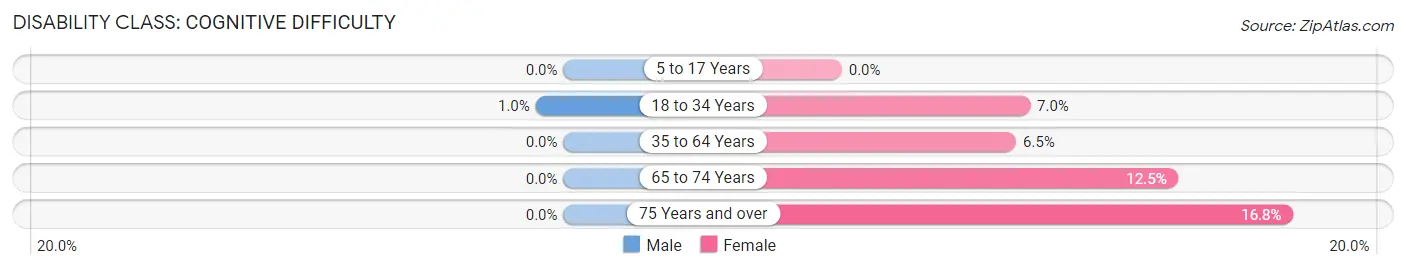
| Age Bracket | Male | Female |
| 5 to 17 Years | 0 (0.0%) | 0 (0.0%) |
| 18 to 34 Years | 6 (1.0%) | 37 (7.0%) |
| 35 to 64 Years | 0 (0.0%) | 58 (6.5%) |
| 65 to 74 Years | 0 (0.0%) | 22 (12.5%) |
| 75 Years and over | 0 (0.0%) | 31 (16.8%) |
Disability Class: Ambulatory Difficulty
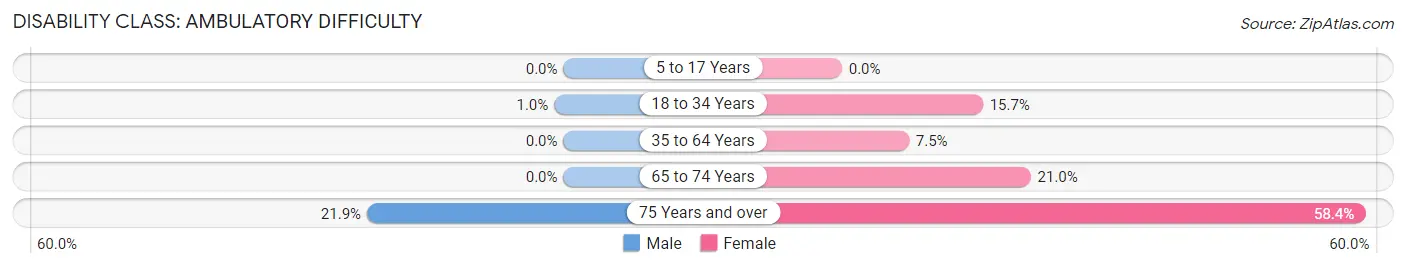
| Age Bracket | Male | Female |
| 5 to 17 Years | 0 (0.0%) | 0 (0.0%) |
| 18 to 34 Years | 6 (1.0%) | 83 (15.7%) |
| 35 to 64 Years | 0 (0.0%) | 67 (7.5%) |
| 65 to 74 Years | 0 (0.0%) | 37 (21.0%) |
| 75 Years and over | 14 (21.9%) | 108 (58.4%) |
Disability Class: Self-Care Difficulty
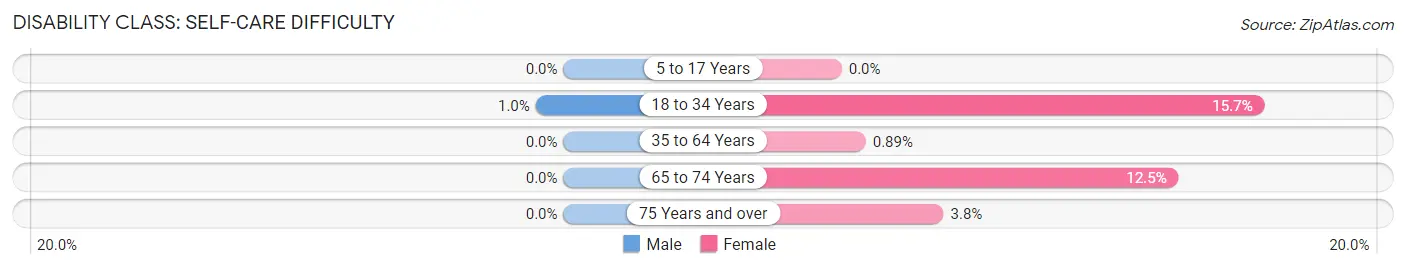
| Age Bracket | Male | Female |
| 5 to 17 Years | 0 (0.0%) | 0 (0.0%) |
| 18 to 34 Years | 6 (1.0%) | 83 (15.7%) |
| 35 to 64 Years | 0 (0.0%) | 8 (0.9%) |
| 65 to 74 Years | 0 (0.0%) | 22 (12.5%) |
| 75 Years and over | 0 (0.0%) | 7 (3.8%) |
Technology Access in Chester
Computing Device Access in Chester
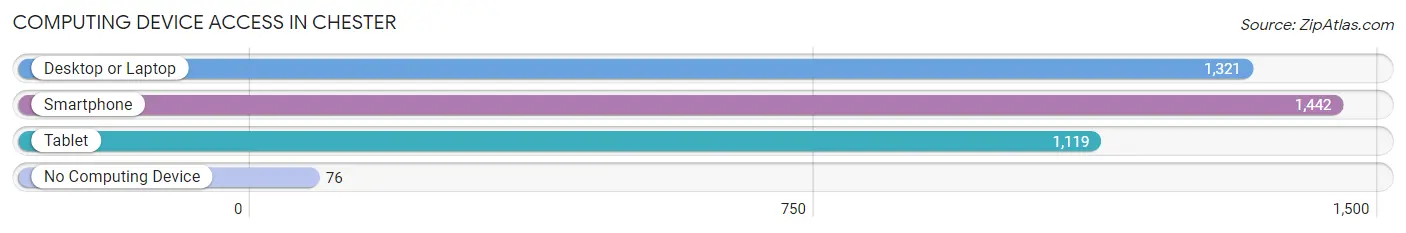
| Device Type | # Households | % Households |
| Desktop or Laptop | 1,321 | 85.0% |
| Smartphone | 1,442 | 92.8% |
| Tablet | 1,119 | 72.0% |
| No Computing Device | 76 | 4.9% |
| Total | 1,554 | 100.0% |
Internet Access in Chester
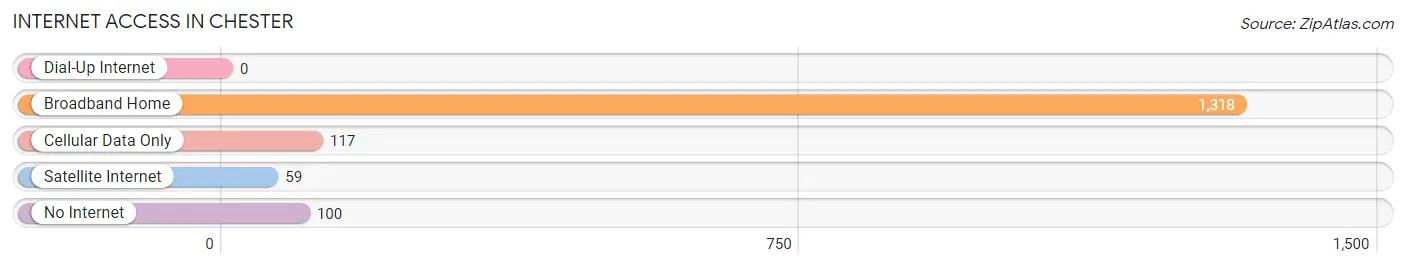
| Internet Type | # Households | % Households |
| Dial-Up Internet | 0 | 0.0% |
| Broadband Home | 1,318 | 84.8% |
| Cellular Data Only | 117 | 7.5% |
| Satellite Internet | 59 | 3.8% |
| No Internet | 100 | 6.4% |
| Total | 1,554 | 100.0% |
Chester Summary
Chester, New York is a small town located in Orange County, New York. It is situated in the foothills of the Shawangunk Mountains, and is part of the Hudson Valley region. The town was first settled in 1712, and was incorporated in 1799. The town has a population of approximately 3,000 people, and is home to a variety of businesses, including a winery, a brewery, and a number of small shops.
Geography
Chester is located in the foothills of the Shawangunk Mountains, and is part of the Hudson Valley region. The town is situated on the banks of the Moodna Creek, and is bordered by the towns of Goshen, Monroe, and Warwick. The town is approximately 50 miles from New York City, and is accessible by car via Route 17 and the New York State Thruway.
The town is home to a variety of natural features, including the Moodna Creek, which is a popular destination for fishing and canoeing. The town is also home to a number of parks, including the Black Rock Forest, which is a 4,000-acre nature preserve.
Economy
Chester is home to a variety of businesses, including a winery, a brewery, and a number of small shops. The town is also home to a number of manufacturing companies, including a plastics manufacturer and a metal fabrication company. The town is also home to a number of farms, which produce a variety of fruits and vegetables.
The town is also home to a number of educational institutions, including the Chester Academy, which is a private school, and the Orange-Ulster BOCES, which provides vocational and technical training.
Demographics
As of the 2010 census, the population of Chester was 3,009. The racial makeup of the town was 94.3% White, 2.2% African American, 0.3% Native American, 0.7% Asian, 0.1% Pacific Islander, and 2.4% from other races. The median household income was $60,938, and the median family income was $68,750.
Conclusion
Chester, New York is a small town located in Orange County, New York. It is situated in the foothills of the Shawangunk Mountains, and is part of the Hudson Valley region. The town was first settled in 1712, and was incorporated in 1799. The town has a population of approximately 3,000 people, and is home to a variety of businesses, including a winery, a brewery, and a number of small shops. The town is home to a variety of natural features, including the Moodna Creek, and is also home to a number of educational institutions. The town has a diverse population, with a median household income of $60,938.
Common Questions
What is Per Capita Income in Chester?
Per Capita income in Chester is $46,502.
What is the Median Family Income in Chester?
Median Family Income in Chester is $140,048.
What is the Median Household income in Chester?
Median Household Income in Chester is $102,105.
What is Income or Wage Gap in Chester?
Income or Wage Gap in Chester is 38.2%.
Women in Chester earn 61.8 cents for every dollar earned by a man.
What is Inequality or Gini Index in Chester?
Inequality or Gini Index in Chester is 0.43.
What is the Total Population of Chester?
Total Population of Chester is 4,064.
What is the Total Male Population of Chester?
Total Male Population of Chester is 1,965.
What is the Total Female Population of Chester?
Total Female Population of Chester is 2,099.
What is the Ratio of Males per 100 Females in Chester?
There are 93.62 Males per 100 Females in Chester.
What is the Ratio of Females per 100 Males in Chester?
There are 106.82 Females per 100 Males in Chester.
What is the Median Population Age in Chester?
Median Population Age in Chester is 40.0 Years.
What is the Average Family Size in Chester
Average Family Size in Chester is 3.4 People.
What is the Average Household Size in Chester
Average Household Size in Chester is 2.6 People.
How Large is the Labor Force in Chester?
There are 2,385 People in the Labor Forcein in Chester.
What is the Percentage of People in the Labor Force in Chester?
67.7% of People are in the Labor Force in Chester.
What is the Unemployment Rate in Chester?
Unemployment Rate in Chester is 2.2%.