Zip Codes with the Highest Percentage of Population Employed in Security & Protection in Washington
RELATED REPORTS & OPTIONS
Security & Protection
Washington
Compare Zip Codes
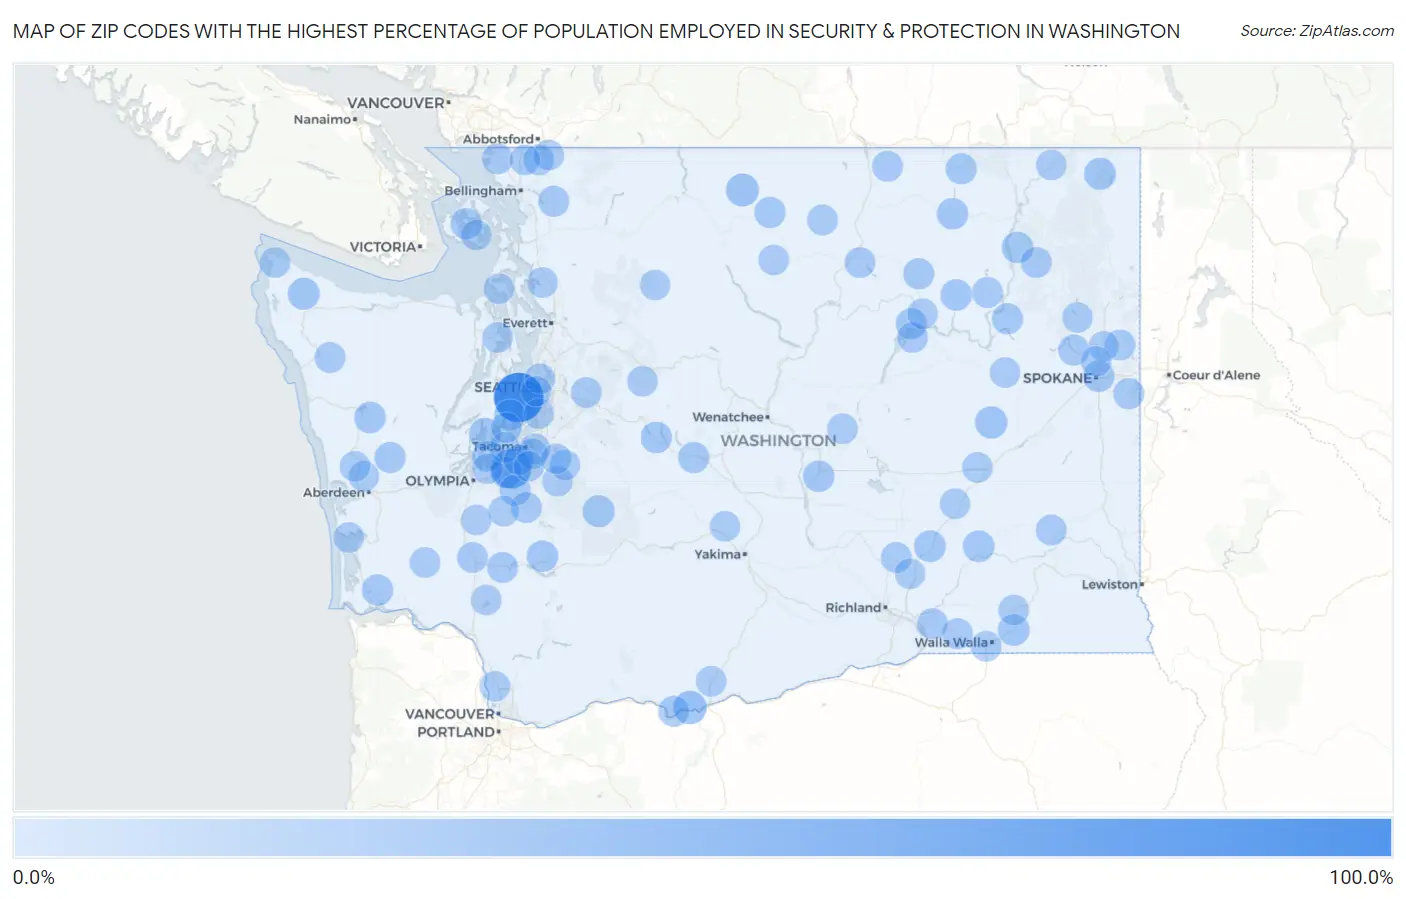
Map of Zip Codes with the Highest Percentage of Population Employed in Security & Protection in Washington
0.0%
100.0%
Zip Codes with the Highest Percentage of Population Employed in Security & Protection in Washington
| Zip Code | % Employed | vs State | vs National | |
| 1. | 98353 | 100.0% | 1.8%(+98.2)#1 | 2.1%(+97.9)#14 |
| 2. | 98430 | 50.0% | 1.8%(+48.2)#2 | 2.1%(+47.9)#35 |
| 3. | 98673 | 18.0% | 1.8%(+16.2)#3 | 2.1%(+15.8)#254 |
| 4. | 98833 | 15.5% | 1.8%(+13.7)#4 | 2.1%(+13.4)#339 |
| 5. | 99154 | 12.5% | 1.8%(+10.7)#5 | 2.1%(+10.4)#510 |
| 6. | 98304 | 11.1% | 1.8%(+9.30)#6 | 2.1%(+8.96)#634 |
| 7. | 98394 | 10.5% | 1.8%(+8.67)#7 | 2.1%(+8.33)#706 |
| 8. | 98326 | 10.3% | 1.8%(+8.51)#8 | 2.1%(+8.18)#727 |
| 9. | 99152 | 10.2% | 1.8%(+8.36)#9 | 2.1%(+8.02)#749 |
| 10. | 99326 | 9.5% | 1.8%(+7.70)#10 | 2.1%(+7.36)#837 |
| 11. | 99335 | 9.0% | 1.8%(+7.16)#11 | 2.1%(+6.83)#919 |
| 12. | 99329 | 9.0% | 1.8%(+7.14)#12 | 2.1%(+6.81)#925 |
| 13. | 98433 | 8.8% | 1.8%(+6.99)#13 | 2.1%(+6.65)#952 |
| 14. | 98575 | 8.7% | 1.8%(+6.88)#14 | 2.1%(+6.55)#969 |
| 15. | 98356 | 8.6% | 1.8%(+6.80)#15 | 2.1%(+6.46)#980 |
| 16. | 98925 | 8.6% | 1.8%(+6.76)#16 | 2.1%(+6.42)#991 |
| 17. | 99140 | 8.4% | 1.8%(+6.56)#17 | 2.1%(+6.22)#1,052 |
| 18. | 99167 | 8.4% | 1.8%(+6.55)#18 | 2.1%(+6.22)#1,054 |
| 19. | 99258 | 8.3% | 1.8%(+6.52)#19 | 2.1%(+6.18)#1,062 |
| 20. | 98824 | 8.3% | 1.8%(+6.45)#20 | 2.1%(+6.12)#1,082 |
| 21. | 99166 | 8.2% | 1.8%(+6.39)#21 | 2.1%(+6.05)#1,096 |
| 22. | 98359 | 8.2% | 1.8%(+6.37)#22 | 2.1%(+6.04)#1,102 |
| 23. | 98286 | 7.8% | 1.8%(+6.03)#23 | 2.1%(+5.69)#1,224 |
| 24. | 98638 | 7.6% | 1.8%(+5.79)#24 | 2.1%(+5.46)#1,294 |
| 25. | 98862 | 7.3% | 1.8%(+5.49)#25 | 2.1%(+5.16)#1,398 |
| 26. | 98563 | 6.8% | 1.8%(+4.98)#26 | 2.1%(+4.65)#1,630 |
| 27. | 98580 | 6.7% | 1.8%(+4.93)#27 | 2.1%(+4.60)#1,660 |
| 28. | 99118 | 6.7% | 1.8%(+4.87)#28 | 2.1%(+4.54)#1,692 |
| 29. | 98943 | 6.7% | 1.8%(+4.85)#29 | 2.1%(+4.52)#1,701 |
| 30. | 99155 | 6.6% | 1.8%(+4.79)#30 | 2.1%(+4.45)#1,732 |
| 31. | 99133 | 6.4% | 1.8%(+4.62)#31 | 2.1%(+4.29)#1,811 |
| 32. | 98617 | 6.4% | 1.8%(+4.54)#32 | 2.1%(+4.21)#1,854 |
| 33. | 99129 | 6.4% | 1.8%(+4.54)#33 | 2.1%(+4.21)#1,858 |
| 34. | 98220 | 6.3% | 1.8%(+4.48)#34 | 2.1%(+4.14)#1,905 |
| 35. | 99026 | 6.1% | 1.8%(+4.29)#35 | 2.1%(+3.96)#2,008 |
| 36. | 99023 | 6.0% | 1.8%(+4.17)#36 | 2.1%(+3.83)#2,089 |
| 37. | 98819 | 6.0% | 1.8%(+4.16)#37 | 2.1%(+3.82)#2,104 |
| 38. | 99138 | 5.7% | 1.8%(+3.93)#38 | 2.1%(+3.60)#2,254 |
| 39. | 99101 | 5.5% | 1.8%(+3.73)#39 | 2.1%(+3.39)#2,425 |
| 40. | 98597 | 5.5% | 1.8%(+3.65)#40 | 2.1%(+3.32)#2,480 |
| 41. | 98331 | 5.2% | 1.8%(+3.39)#41 | 2.1%(+3.05)#2,709 |
| 42. | 98582 | 5.2% | 1.8%(+3.35)#42 | 2.1%(+3.01)#2,748 |
| 43. | 98230 | 5.2% | 1.8%(+3.35)#43 | 2.1%(+3.01)#2,752 |
| 44. | 99360 | 5.0% | 1.8%(+3.23)#44 | 2.1%(+2.90)#2,873 |
| 45. | 98844 | 5.0% | 1.8%(+3.16)#45 | 2.1%(+2.83)#2,954 |
| 46. | 99021 | 4.9% | 1.8%(+3.08)#46 | 2.1%(+2.75)#3,054 |
| 47. | 98351 | 4.8% | 1.8%(+3.03)#47 | 2.1%(+2.69)#3,123 |
| 48. | 99123 | 4.7% | 1.8%(+2.93)#48 | 2.1%(+2.60)#3,244 |
| 49. | 99323 | 4.7% | 1.8%(+2.93)#49 | 2.1%(+2.59)#3,245 |
| 50. | 98565 | 4.6% | 1.8%(+2.79)#50 | 2.1%(+2.46)#3,430 |
| 51. | 99143 | 4.5% | 1.8%(+2.73)#51 | 2.1%(+2.40)#3,529 |
| 52. | 98024 | 4.5% | 1.8%(+2.66)#52 | 2.1%(+2.32)#3,656 |
| 53. | 98840 | 4.5% | 1.8%(+2.65)#53 | 2.1%(+2.32)#3,663 |
| 54. | 98823 | 4.5% | 1.8%(+2.64)#54 | 2.1%(+2.30)#3,683 |
| 55. | 98276 | 4.4% | 1.8%(+2.63)#55 | 2.1%(+2.29)#3,712 |
| 56. | 98520 | 4.4% | 1.8%(+2.58)#56 | 2.1%(+2.25)#3,779 |
| 57. | 99324 | 4.4% | 1.8%(+2.58)#57 | 2.1%(+2.25)#3,781 |
| 58. | 99343 | 4.3% | 1.8%(+2.48)#58 | 2.1%(+2.14)#3,966 |
| 59. | 98572 | 4.3% | 1.8%(+2.46)#59 | 2.1%(+2.13)#3,989 |
| 60. | 98576 | 4.2% | 1.8%(+2.41)#60 | 2.1%(+2.08)#4,077 |
| 61. | 98424 | 4.2% | 1.8%(+2.34)#61 | 2.1%(+2.01)#4,203 |
| 62. | 98295 | 4.2% | 1.8%(+2.34)#62 | 2.1%(+2.00)#4,206 |
| 63. | 98642 | 4.1% | 1.8%(+2.28)#63 | 2.1%(+1.95)#4,305 |
| 64. | 99361 | 4.1% | 1.8%(+2.24)#64 | 2.1%(+1.91)#4,386 |
| 65. | 98261 | 4.0% | 1.8%(+2.23)#65 | 2.1%(+1.90)#4,409 |
| 66. | 98365 | 4.0% | 1.8%(+2.21)#66 | 2.1%(+1.87)#4,458 |
| 67. | 98333 | 4.0% | 1.8%(+2.18)#67 | 2.1%(+1.85)#4,503 |
| 68. | 98856 | 3.9% | 1.8%(+2.11)#68 | 2.1%(+1.78)#4,640 |
| 69. | 98360 | 3.9% | 1.8%(+2.10)#69 | 2.1%(+1.76)#4,667 |
| 70. | 99169 | 3.9% | 1.8%(+2.09)#70 | 2.1%(+1.75)#4,686 |
| 71. | 99330 | 3.9% | 1.8%(+2.07)#71 | 2.1%(+1.74)#4,721 |
| 72. | 98530 | 3.9% | 1.8%(+2.07)#72 | 2.1%(+1.74)#4,722 |
| 73. | 98357 | 3.9% | 1.8%(+2.07)#73 | 2.1%(+1.73)#4,730 |
| 74. | 98550 | 3.9% | 1.8%(+2.06)#74 | 2.1%(+1.73)#4,750 |
| 75. | 98292 | 3.8% | 1.8%(+2.03)#75 | 2.1%(+1.69)#4,827 |
| 76. | 98620 | 3.8% | 1.8%(+1.99)#76 | 2.1%(+1.66)#4,892 |
| 77. | 99116 | 3.8% | 1.8%(+1.99)#77 | 2.1%(+1.66)#4,894 |
| 78. | 98288 | 3.8% | 1.8%(+1.98)#78 | 2.1%(+1.65)#4,913 |
| 79. | 99005 | 3.8% | 1.8%(+1.98)#79 | 2.1%(+1.65)#4,922 |
| 80. | 98239 | 3.7% | 1.8%(+1.93)#80 | 2.1%(+1.60)#5,034 |
| 81. | 99341 | 3.7% | 1.8%(+1.89)#81 | 2.1%(+1.56)#5,134 |
| 82. | 99110 | 3.6% | 1.8%(+1.84)#82 | 2.1%(+1.50)#5,278 |
| 83. | 98264 | 3.6% | 1.8%(+1.81)#83 | 2.1%(+1.48)#5,335 |
| 84. | 99157 | 3.6% | 1.8%(+1.78)#84 | 2.1%(+1.45)#5,406 |
| 85. | 98443 | 3.6% | 1.8%(+1.77)#85 | 2.1%(+1.43)#5,452 |
| 86. | 99122 | 3.6% | 1.8%(+1.74)#86 | 2.1%(+1.40)#5,534 |
| 87. | 98385 | 3.5% | 1.8%(+1.72)#87 | 2.1%(+1.39)#5,586 |
| 88. | 98942 | 3.5% | 1.8%(+1.71)#88 | 2.1%(+1.38)#5,608 |
| 89. | 98241 | 3.5% | 1.8%(+1.71)#89 | 2.1%(+1.37)#5,624 |
| 90. | 98645 | 3.5% | 1.8%(+1.64)#90 | 2.1%(+1.30)#5,794 |
| 91. | 98332 | 3.4% | 1.8%(+1.63)#91 | 2.1%(+1.30)#5,819 |
| 92. | 99251 | 3.4% | 1.8%(+1.59)#92 | 2.1%(+1.26)#5,919 |
| 93. | 98590 | 3.4% | 1.8%(+1.58)#93 | 2.1%(+1.25)#5,940 |
| 94. | 98195 | 3.4% | 1.8%(+1.57)#94 | 2.1%(+1.24)#5,992 |
| 95. | 98499 | 3.4% | 1.8%(+1.55)#95 | 2.1%(+1.22)#6,035 |
| 96. | 98445 | 3.4% | 1.8%(+1.55)#96 | 2.1%(+1.22)#6,040 |
| 97. | 98516 | 3.4% | 1.8%(+1.54)#97 | 2.1%(+1.21)#6,071 |
| 98. | 98391 | 3.3% | 1.8%(+1.51)#98 | 2.1%(+1.17)#6,180 |
| 99. | 98148 | 3.3% | 1.8%(+1.50)#99 | 2.1%(+1.16)#6,205 |
| 100. | 98134 | 3.3% | 1.8%(+1.50)#100 | 2.1%(+1.16)#6,209 |
Common Questions
What are the Top 10 Zip Codes with the Highest Percentage of Population Employed in Security & Protection in Washington?
Top 10 Zip Codes with the Highest Percentage of Population Employed in Security & Protection in Washington are:
What zip code has the Highest Percentage of Population Employed in Security & Protection in Washington?
98353 has the Highest Percentage of Population Employed in Security & Protection in Washington with 100.0%.
What is the Percentage of Population Employed in Security & Protection in the State of Washington?
Percentage of Population Employed in Security & Protection in Washington is 1.8%.
What is the Percentage of Population Employed in Security & Protection in the United States?
Percentage of Population Employed in Security & Protection in the United States is 2.1%.