Zip Codes with the Highest Percentage of Population Employed in Security & Protection in Delaware
RELATED REPORTS & OPTIONS
Security & Protection
Delaware
Compare Zip Codes
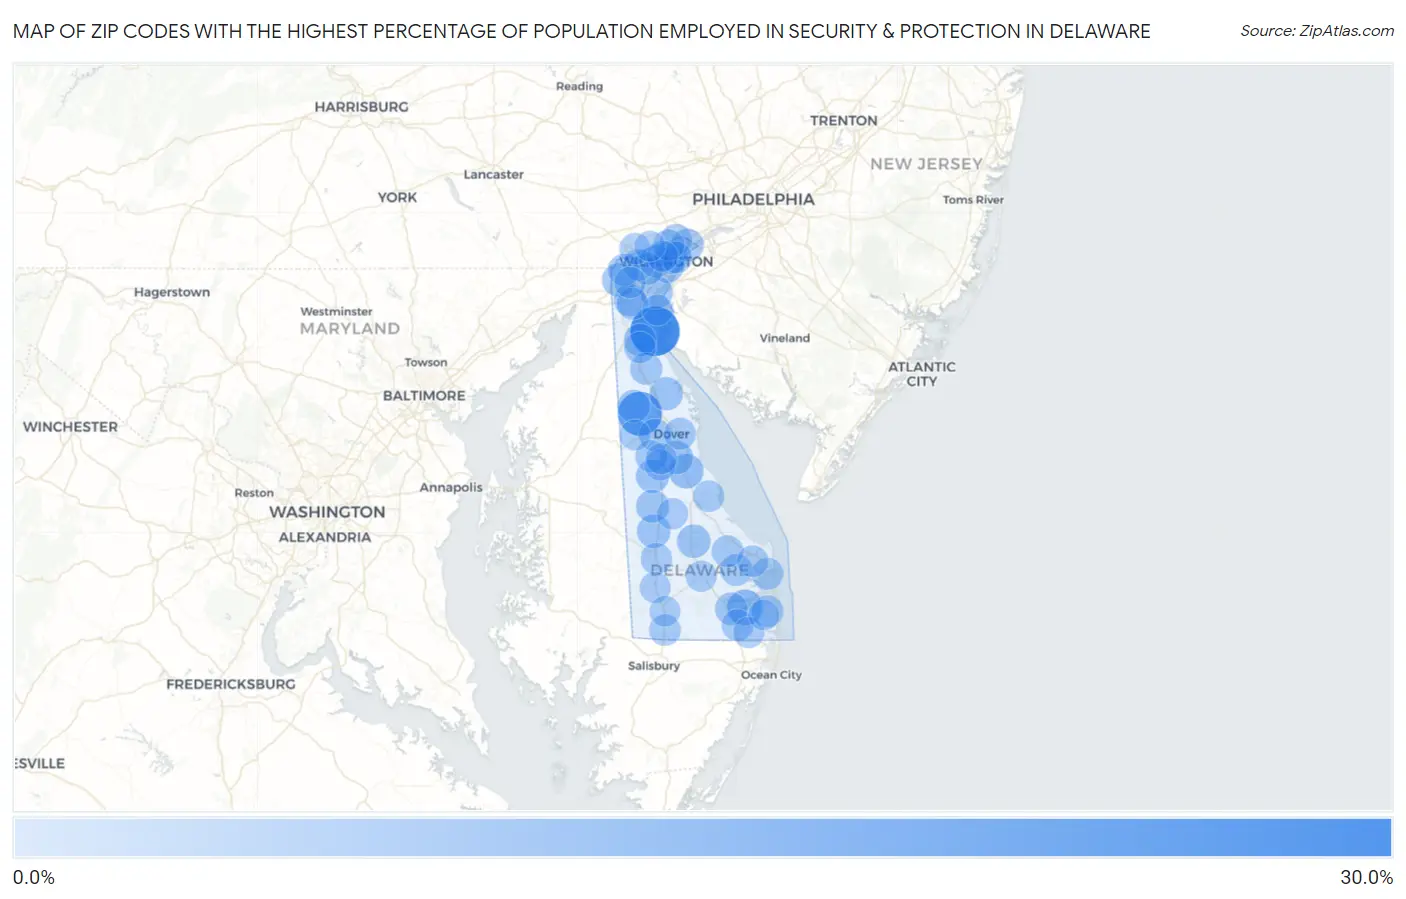
Map of Zip Codes with the Highest Percentage of Population Employed in Security & Protection in Delaware
0.0%
30.0%
Zip Codes with the Highest Percentage of Population Employed in Security & Protection in Delaware
| Zip Code | % Employed | vs State | vs National | |
| 1. | 19731 | 29.2% | 2.6%(+26.6)#1 | 2.1%(+27.0)#101 |
| 2. | 19955 | 20.5% | 2.6%(+18.0)#2 | 2.1%(+18.4)#186 |
| 3. | 19939 | 8.1% | 2.6%(+5.46)#3 | 2.1%(+5.91)#1,147 |
| 4. | 19946 | 6.2% | 2.6%(+3.64)#4 | 2.1%(+4.09)#1,927 |
| 5. | 19962 | 5.0% | 2.6%(+2.43)#5 | 2.1%(+2.88)#2,893 |
| 6. | 19950 | 4.7% | 2.6%(+2.10)#6 | 2.1%(+2.55)#3,300 |
| 7. | 19717 | 4.6% | 2.6%(+2.05)#7 | 2.1%(+2.50)#3,379 |
| 8. | 19941 | 4.5% | 2.6%(+1.93)#8 | 2.1%(+2.38)#3,569 |
| 9. | 19977 | 4.2% | 2.6%(+1.64)#9 | 2.1%(+2.09)#4,049 |
| 10. | 19943 | 4.2% | 2.6%(+1.63)#10 | 2.1%(+2.08)#4,069 |
| 11. | 19952 | 3.9% | 2.6%(+1.31)#11 | 2.1%(+1.76)#4,671 |
| 12. | 19801 | 3.7% | 2.6%(+1.11)#12 | 2.1%(+1.56)#5,126 |
| 13. | 19720 | 3.6% | 2.6%(+1.05)#13 | 2.1%(+1.49)#5,299 |
| 14. | 19802 | 3.6% | 2.6%(+0.972)#14 | 2.1%(+1.42)#5,484 |
| 15. | 19938 | 3.5% | 2.6%(+0.872)#15 | 2.1%(+1.32)#5,754 |
| 16. | 19805 | 3.4% | 2.6%(+0.796)#16 | 2.1%(+1.25)#5,946 |
| 17. | 19703 | 3.3% | 2.6%(+0.696)#17 | 2.1%(+1.14)#6,266 |
| 18. | 19966 | 3.2% | 2.6%(+0.640)#18 | 2.1%(+1.09)#6,439 |
| 19. | 19709 | 3.1% | 2.6%(+0.457)#19 | 2.1%(+0.906)#7,026 |
| 20. | 19904 | 3.0% | 2.6%(+0.374)#20 | 2.1%(+0.823)#7,334 |
| 21. | 19734 | 2.9% | 2.6%(+0.348)#21 | 2.1%(+0.797)#7,451 |
| 22. | 19702 | 2.9% | 2.6%(+0.334)#22 | 2.1%(+0.783)#7,506 |
| 23. | 19804 | 2.5% | 2.6%(-0.056)#23 | 2.1%(+0.393)#9,298 |
| 24. | 19901 | 2.5% | 2.6%(-0.145)#24 | 2.1%(+0.304)#9,770 |
| 25. | 19934 | 2.4% | 2.6%(-0.181)#25 | 2.1%(+0.268)#9,970 |
| 26. | 19971 | 2.4% | 2.6%(-0.184)#26 | 2.1%(+0.265)#9,986 |
| 27. | 19951 | 2.2% | 2.6%(-0.378)#27 | 2.1%(+0.071)#11,137 |
| 28. | 19810 | 2.2% | 2.6%(-0.392)#28 | 2.1%(+0.057)#11,223 |
| 29. | 19701 | 2.1% | 2.6%(-0.468)#29 | 2.1%(-0.019)#11,706 |
| 30. | 19968 | 2.1% | 2.6%(-0.473)#30 | 2.1%(-0.024)#11,739 |
| 31. | 19711 | 2.1% | 2.6%(-0.525)#31 | 2.1%(-0.076)#12,091 |
| 32. | 19970 | 2.0% | 2.6%(-0.598)#32 | 2.1%(-0.149)#12,566 |
| 33. | 19730 | 1.9% | 2.6%(-0.689)#33 | 2.1%(-0.240)#13,164 |
| 34. | 19945 | 1.9% | 2.6%(-0.711)#34 | 2.1%(-0.262)#13,338 |
| 35. | 19933 | 1.9% | 2.6%(-0.712)#35 | 2.1%(-0.263)#13,342 |
| 36. | 19808 | 1.9% | 2.6%(-0.726)#36 | 2.1%(-0.277)#13,432 |
| 37. | 19809 | 1.9% | 2.6%(-0.731)#37 | 2.1%(-0.282)#13,459 |
| 38. | 19713 | 1.8% | 2.6%(-0.798)#38 | 2.1%(-0.349)#13,957 |
| 39. | 19940 | 1.7% | 2.6%(-0.905)#39 | 2.1%(-0.456)#14,740 |
| 40. | 19958 | 1.7% | 2.6%(-0.944)#40 | 2.1%(-0.495)#15,011 |
| 41. | 19963 | 1.6% | 2.6%(-1.03)#41 | 2.1%(-0.586)#15,699 |
| 42. | 19707 | 1.5% | 2.6%(-1.14)#42 | 2.1%(-0.694)#16,542 |
| 43. | 19803 | 1.4% | 2.6%(-1.22)#43 | 2.1%(-0.767)#17,089 |
| 44. | 19979 | 1.4% | 2.6%(-1.24)#44 | 2.1%(-0.788)#17,250 |
| 45. | 19954 | 1.2% | 2.6%(-1.37)#45 | 2.1%(-0.921)#18,299 |
| 46. | 19806 | 1.2% | 2.6%(-1.37)#46 | 2.1%(-0.921)#18,300 |
| 47. | 19975 | 1.2% | 2.6%(-1.44)#47 | 2.1%(-0.994)#18,863 |
| 48. | 19973 | 1.1% | 2.6%(-1.47)#48 | 2.1%(-1.02)#19,084 |
| 49. | 19980 | 1.0% | 2.6%(-1.56)#49 | 2.1%(-1.11)#19,731 |
| 50. | 19947 | 0.96% | 2.6%(-1.64)#50 | 2.1%(-1.19)#20,391 |
| 51. | 19706 | 0.78% | 2.6%(-1.82)#51 | 2.1%(-1.37)#21,542 |
| 52. | 19953 | 0.65% | 2.6%(-1.95)#52 | 2.1%(-1.50)#22,396 |
| 53. | 19807 | 0.53% | 2.6%(-2.06)#53 | 2.1%(-1.61)#23,051 |
| 54. | 19956 | 0.47% | 2.6%(-2.13)#54 | 2.1%(-1.68)#23,389 |
| 55. | 19967 | 0.47% | 2.6%(-2.13)#55 | 2.1%(-1.68)#23,413 |
1
Common Questions
What are the Top 10 Zip Codes with the Highest Percentage of Population Employed in Security & Protection in Delaware?
Top 10 Zip Codes with the Highest Percentage of Population Employed in Security & Protection in Delaware are:
What zip code has the Highest Percentage of Population Employed in Security & Protection in Delaware?
19731 has the Highest Percentage of Population Employed in Security & Protection in Delaware with 29.2%.
What is the Percentage of Population Employed in Security & Protection in the State of Delaware?
Percentage of Population Employed in Security & Protection in Delaware is 2.6%.
What is the Percentage of Population Employed in Security & Protection in the United States?
Percentage of Population Employed in Security & Protection in the United States is 2.1%.