Zip Codes with the Highest Percentage of Population Employed in Security & Protection in New Mexico
RELATED REPORTS & OPTIONS
Security & Protection
New Mexico
Compare Zip Codes
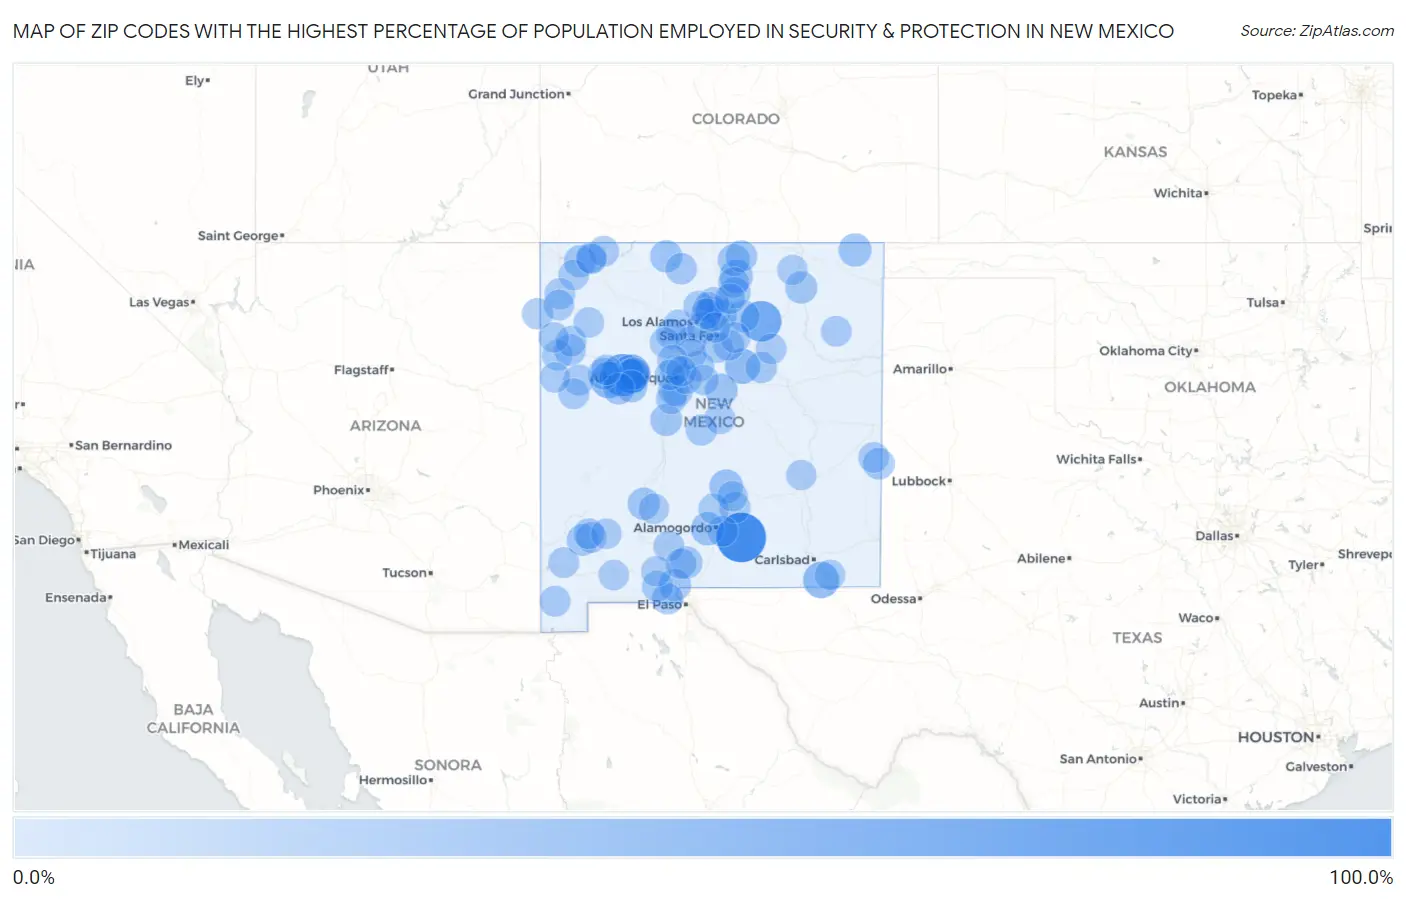
Map of Zip Codes with the Highest Percentage of Population Employed in Security & Protection in New Mexico
0.0%
100.0%
Zip Codes with the Highest Percentage of Population Employed in Security & Protection in New Mexico
| Zip Code | % Employed | vs State | vs National | |
| 1. | 88354 | 100.0% | 2.8%(+97.2)#1 | 2.1%(+97.9)#7 |
| 2. | 87049 | 61.8% | 2.8%(+59.1)#2 | 2.1%(+59.7)#24 |
| 3. | 87712 | 54.2% | 2.8%(+51.4)#3 | 2.1%(+52.1)#30 |
| 4. | 87014 | 42.2% | 2.8%(+39.4)#4 | 2.1%(+40.0)#50 |
| 5. | 87051 | 32.6% | 2.8%(+29.9)#5 | 2.1%(+30.5)#82 |
| 6. | 88263 | 31.9% | 2.8%(+29.1)#6 | 2.1%(+29.7)#85 |
| 7. | 87560 | 26.5% | 2.8%(+23.8)#7 | 2.1%(+24.4)#117 |
| 8. | 87038 | 24.6% | 2.8%(+21.8)#8 | 2.1%(+22.4)#133 |
| 9. | 87567 | 20.6% | 2.8%(+17.8)#9 | 2.1%(+18.4)#185 |
| 10. | 88341 | 19.0% | 2.8%(+16.3)#10 | 2.1%(+16.9)#225 |
| 11. | 87514 | 17.4% | 2.8%(+14.6)#11 | 2.1%(+15.2)#273 |
| 12. | 88330 | 17.0% | 2.8%(+14.2)#12 | 2.1%(+14.9)#285 |
| 13. | 88419 | 16.0% | 2.8%(+13.2)#13 | 2.1%(+13.9)#319 |
| 14. | 87035 | 14.0% | 2.8%(+11.2)#14 | 2.1%(+11.8)#424 |
| 15. | 88002 | 13.3% | 2.8%(+10.5)#15 | 2.1%(+11.1)#464 |
| 16. | 87417 | 12.7% | 2.8%(+9.91)#16 | 2.1%(+10.5)#497 |
| 17. | 87935 | 12.5% | 2.8%(+9.77)#17 | 2.1%(+10.4)#504 |
| 18. | 87528 | 12.2% | 2.8%(+9.42)#18 | 2.1%(+10.0)#537 |
| 19. | 88027 | 11.9% | 2.8%(+9.16)#19 | 2.1%(+9.77)#555 |
| 20. | 87040 | 11.8% | 2.8%(+9.00)#20 | 2.1%(+9.62)#570 |
| 21. | 87747 | 11.5% | 2.8%(+8.71)#21 | 2.1%(+9.32)#606 |
| 22. | 87007 | 11.3% | 2.8%(+8.50)#22 | 2.1%(+9.11)#620 |
| 23. | 87519 | 11.0% | 2.8%(+8.19)#23 | 2.1%(+8.81)#652 |
| 24. | 87006 | 10.5% | 2.8%(+7.71)#24 | 2.1%(+8.32)#711 |
| 25. | 87732 | 9.9% | 2.8%(+7.14)#25 | 2.1%(+7.75)#782 |
| 26. | 88065 | 9.7% | 2.8%(+6.97)#26 | 2.1%(+7.58)#801 |
| 27. | 87556 | 9.7% | 2.8%(+6.90)#27 | 2.1%(+7.51)#808 |
| 28. | 87020 | 9.1% | 2.8%(+6.36)#28 | 2.1%(+6.98)#889 |
| 29. | 87034 | 8.9% | 2.8%(+6.14)#29 | 2.1%(+6.75)#933 |
| 30. | 87522 | 8.3% | 2.8%(+5.54)#30 | 2.1%(+6.16)#1,073 |
| 31. | 87575 | 8.2% | 2.8%(+5.39)#31 | 2.1%(+6.01)#1,107 |
| 32. | 87316 | 8.1% | 2.8%(+5.31)#32 | 2.1%(+5.92)#1,142 |
| 33. | 88113 | 8.0% | 2.8%(+5.24)#33 | 2.1%(+5.85)#1,170 |
| 34. | 88008 | 8.0% | 2.8%(+5.21)#34 | 2.1%(+5.83)#1,178 |
| 35. | 87022 | 7.8% | 2.8%(+5.05)#35 | 2.1%(+5.66)#1,236 |
| 36. | 87711 | 7.2% | 2.8%(+4.43)#36 | 2.1%(+5.04)#1,445 |
| 37. | 88340 | 7.0% | 2.8%(+4.25)#37 | 2.1%(+4.87)#1,525 |
| 38. | 87557 | 6.9% | 2.8%(+4.16)#38 | 2.1%(+4.77)#1,570 |
| 39. | 87535 | 6.8% | 2.8%(+4.00)#39 | 2.1%(+4.62)#1,648 |
| 40. | 87328 | 6.5% | 2.8%(+3.74)#40 | 2.1%(+4.35)#1,786 |
| 41. | 87036 | 6.3% | 2.8%(+3.50)#41 | 2.1%(+4.11)#1,915 |
| 42. | 88044 | 6.0% | 2.8%(+3.28)#42 | 2.1%(+3.89)#2,054 |
| 43. | 88132 | 5.9% | 2.8%(+3.12)#43 | 2.1%(+3.73)#2,158 |
| 44. | 87582 | 5.7% | 2.8%(+2.97)#44 | 2.1%(+3.58)#2,263 |
| 45. | 88020 | 5.6% | 2.8%(+2.88)#45 | 2.1%(+3.50)#2,329 |
| 46. | 87402 | 5.6% | 2.8%(+2.84)#46 | 2.1%(+3.45)#2,370 |
| 47. | 87321 | 5.5% | 2.8%(+2.78)#47 | 2.1%(+3.39)#2,424 |
| 48. | 87455 | 5.5% | 2.8%(+2.74)#48 | 2.1%(+3.36)#2,450 |
| 49. | 87357 | 5.5% | 2.8%(+2.71)#49 | 2.1%(+3.33)#2,473 |
| 50. | 87025 | 5.5% | 2.8%(+2.70)#50 | 2.1%(+3.31)#2,485 |
| 51. | 87068 | 5.4% | 2.8%(+2.62)#51 | 2.1%(+3.23)#2,557 |
| 52. | 87566 | 5.3% | 2.8%(+2.51)#52 | 2.1%(+3.12)#2,655 |
| 53. | 87305 | 5.3% | 2.8%(+2.50)#53 | 2.1%(+3.11)#2,662 |
| 54. | 87547 | 5.2% | 2.8%(+2.47)#54 | 2.1%(+3.08)#2,692 |
| 55. | 88045 | 5.1% | 2.8%(+2.36)#55 | 2.1%(+2.97)#2,791 |
| 56. | 87537 | 5.1% | 2.8%(+2.32)#56 | 2.1%(+2.93)#2,831 |
| 57. | 87508 | 5.1% | 2.8%(+2.31)#57 | 2.1%(+2.93)#2,839 |
| 58. | 87532 | 5.0% | 2.8%(+2.26)#58 | 2.1%(+2.87)#2,898 |
| 59. | 88026 | 5.0% | 2.8%(+2.25)#59 | 2.1%(+2.86)#2,916 |
| 60. | 87733 | 5.0% | 2.8%(+2.24)#60 | 2.1%(+2.85)#2,929 |
| 61. | 87047 | 5.0% | 2.8%(+2.20)#61 | 2.1%(+2.81)#2,972 |
| 62. | 87364 | 4.9% | 2.8%(+2.14)#62 | 2.1%(+2.75)#3,044 |
| 63. | 87529 | 4.8% | 2.8%(+2.06)#63 | 2.1%(+2.68)#3,147 |
| 64. | 88022 | 4.8% | 2.8%(+2.02)#64 | 2.1%(+2.63)#3,199 |
| 65. | 87063 | 4.7% | 2.8%(+1.97)#65 | 2.1%(+2.58)#3,261 |
| 66. | 88012 | 4.7% | 2.8%(+1.92)#66 | 2.1%(+2.54)#3,323 |
| 67. | 87311 | 4.6% | 2.8%(+1.89)#67 | 2.1%(+2.50)#3,374 |
| 68. | 87031 | 4.6% | 2.8%(+1.83)#68 | 2.1%(+2.45)#3,455 |
| 69. | 88325 | 4.5% | 2.8%(+1.77)#69 | 2.1%(+2.38)#3,568 |
| 70. | 87552 | 4.5% | 2.8%(+1.76)#70 | 2.1%(+2.37)#3,585 |
| 71. | 87410 | 4.5% | 2.8%(+1.71)#71 | 2.1%(+2.32)#3,650 |
| 72. | 87701 | 4.3% | 2.8%(+1.58)#72 | 2.1%(+2.19)#3,876 |
| 73. | 87072 | 4.2% | 2.8%(+1.48)#73 | 2.1%(+2.09)#4,044 |
| 74. | 88352 | 4.2% | 2.8%(+1.44)#74 | 2.1%(+2.05)#4,122 |
| 75. | 88011 | 4.0% | 2.8%(+1.29)#75 | 2.1%(+1.90)#4,400 |
| 76. | 87024 | 4.0% | 2.8%(+1.28)#76 | 2.1%(+1.89)#4,410 |
| 77. | 87123 | 4.0% | 2.8%(+1.23)#77 | 2.1%(+1.84)#4,513 |
| 78. | 87901 | 3.8% | 2.8%(+1.08)#78 | 2.1%(+1.70)#4,811 |
| 79. | 87553 | 3.8% | 2.8%(+1.06)#79 | 2.1%(+1.67)#4,871 |
| 80. | 88256 | 3.7% | 2.8%(+0.972)#80 | 2.1%(+1.58)#5,059 |
| 81. | 88345 | 3.7% | 2.8%(+0.946)#81 | 2.1%(+1.56)#5,120 |
| 82. | 88041 | 3.7% | 2.8%(+0.942)#82 | 2.1%(+1.56)#5,132 |
| 83. | 87053 | 3.7% | 2.8%(+0.927)#83 | 2.1%(+1.54)#5,178 |
| 84. | 87416 | 3.7% | 2.8%(+0.900)#84 | 2.1%(+1.51)#5,239 |
| 85. | 87001 | 3.6% | 2.8%(+0.850)#85 | 2.1%(+1.46)#5,376 |
| 86. | 87327 | 3.6% | 2.8%(+0.822)#86 | 2.1%(+1.44)#5,442 |
| 87. | 88005 | 3.6% | 2.8%(+0.798)#87 | 2.1%(+1.41)#5,507 |
| 88. | 88030 | 3.5% | 2.8%(+0.764)#88 | 2.1%(+1.38)#5,610 |
| 89. | 87114 | 3.5% | 2.8%(+0.720)#89 | 2.1%(+1.33)#5,717 |
| 90. | 87313 | 3.5% | 2.8%(+0.707)#90 | 2.1%(+1.32)#5,757 |
| 91. | 87375 | 3.3% | 2.8%(+0.559)#91 | 2.1%(+1.17)#6,183 |
| 92. | 87728 | 3.2% | 2.8%(+0.430)#92 | 2.1%(+1.04)#6,573 |
| 93. | 87401 | 3.2% | 2.8%(+0.398)#93 | 2.1%(+1.01)#6,662 |
| 94. | 87506 | 3.1% | 2.8%(+0.367)#94 | 2.1%(+0.979)#6,784 |
| 95. | 87021 | 3.1% | 2.8%(+0.347)#95 | 2.1%(+0.960)#6,860 |
| 96. | 87144 | 3.1% | 2.8%(+0.341)#96 | 2.1%(+0.954)#6,876 |
| 97. | 87120 | 3.1% | 2.8%(+0.321)#97 | 2.1%(+0.933)#6,949 |
| 98. | 87113 | 3.1% | 2.8%(+0.294)#98 | 2.1%(+0.906)#7,025 |
| 99. | 87015 | 3.0% | 2.8%(+0.268)#99 | 2.1%(+0.881)#7,117 |
| 100. | 88201 | 3.0% | 2.8%(+0.219)#100 | 2.1%(+0.832)#7,300 |
Common Questions
What are the Top 10 Zip Codes with the Highest Percentage of Population Employed in Security & Protection in New Mexico?
Top 10 Zip Codes with the Highest Percentage of Population Employed in Security & Protection in New Mexico are:
What zip code has the Highest Percentage of Population Employed in Security & Protection in New Mexico?
88354 has the Highest Percentage of Population Employed in Security & Protection in New Mexico with 100.0%.
What is the Percentage of Population Employed in Security & Protection in the State of New Mexico?
Percentage of Population Employed in Security & Protection in New Mexico is 2.8%.
What is the Percentage of Population Employed in Security & Protection in the United States?
Percentage of Population Employed in Security & Protection in the United States is 2.1%.