Zip Codes with the Highest Percentage of Population Employed in Security & Protection in Papillion, NE
RELATED REPORTS & OPTIONS
Security & Protection
Papillion
Compare Zip Codes
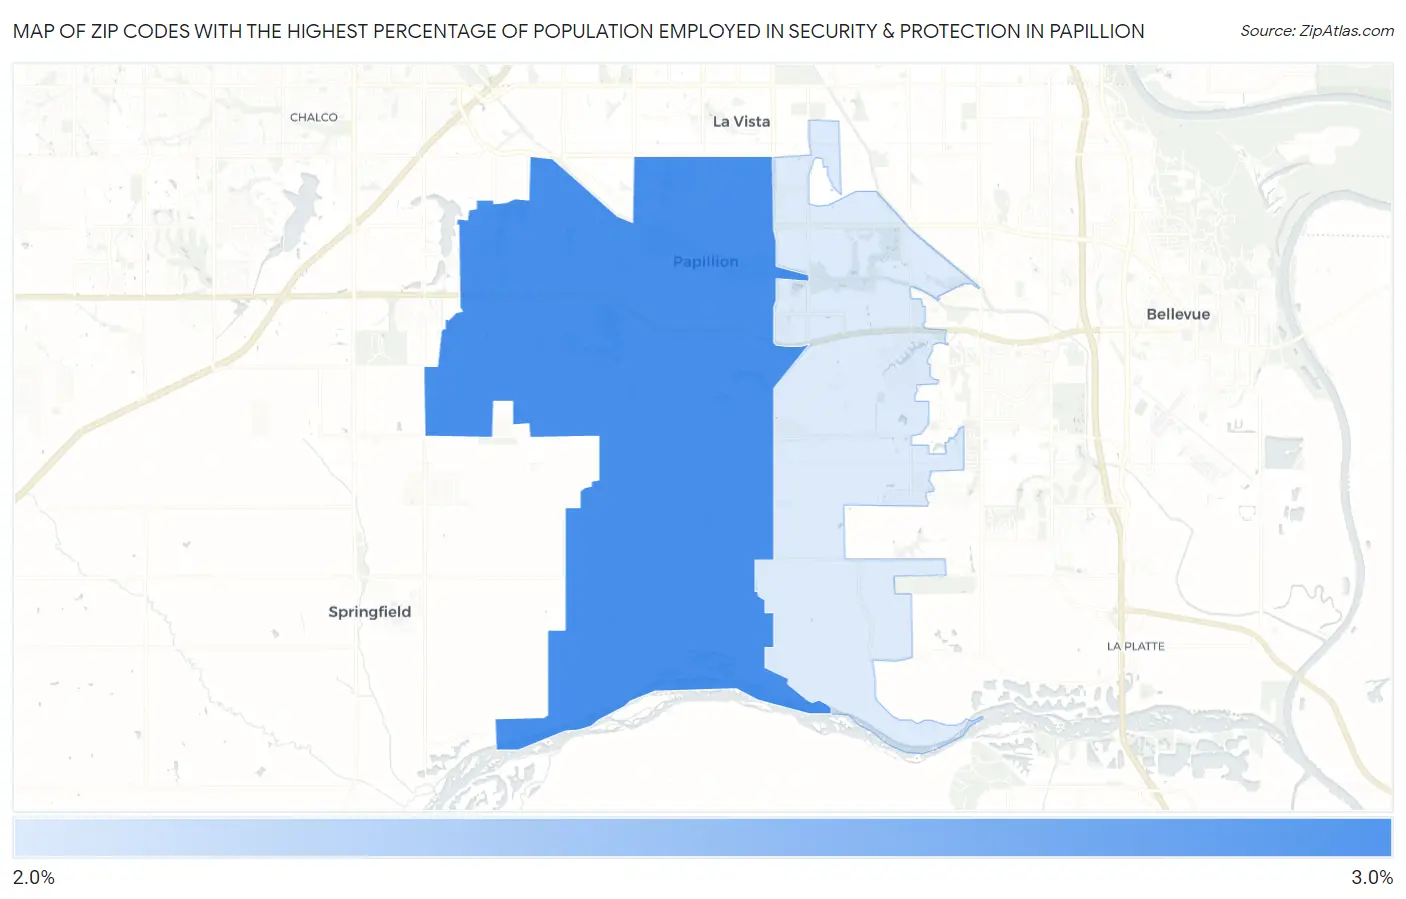
Map of Zip Codes with the Highest Percentage of Population Employed in Security & Protection in Papillion
2.5%
2.5%
Zip Codes with the Highest Percentage of Population Employed in Security & Protection in Papillion, NE
| Zip Code | % Employed | vs State | vs National | |
| 1. | 68046 | 2.5% | 1.7%(+0.837)#81 | 2.1%(+0.366)#9,440 |
| 2. | 68133 | 2.5% | 1.7%(+0.774)#86 | 2.1%(+0.304)#9,775 |
1
Common Questions
What are the Top Zip Codes with the Highest Percentage of Population Employed in Security & Protection in Papillion, NE?
Top Zip Codes with the Highest Percentage of Population Employed in Security & Protection in Papillion, NE are:
What zip code has the Highest Percentage of Population Employed in Security & Protection in Papillion, NE?
68046 has the Highest Percentage of Population Employed in Security & Protection in Papillion, NE with 2.5%.
What is the Percentage of Population Employed in Security & Protection in Papillion, NE?
Percentage of Population Employed in Security & Protection in Papillion is 1.8%.
What is the Percentage of Population Employed in Security & Protection in Nebraska?
Percentage of Population Employed in Security & Protection in Nebraska is 1.7%.
What is the Percentage of Population Employed in Security & Protection in the United States?
Percentage of Population Employed in Security & Protection in the United States is 2.1%.