Uruguayan Unemployment Among Women with Children Ages 6 to 17 years
COMPARE
Uruguayan
Select to Compare
Unemployment Among Women with Children Ages 6 to 17 years
Uruguayan Unemployment Among Women with Children Ages 6 to 17 years
9.3%
UNEMPLOYMENT | WOMEN W/ CHILDREN 6 TO 17
3.0/ 100
METRIC RATING
235th/ 347
METRIC RANK
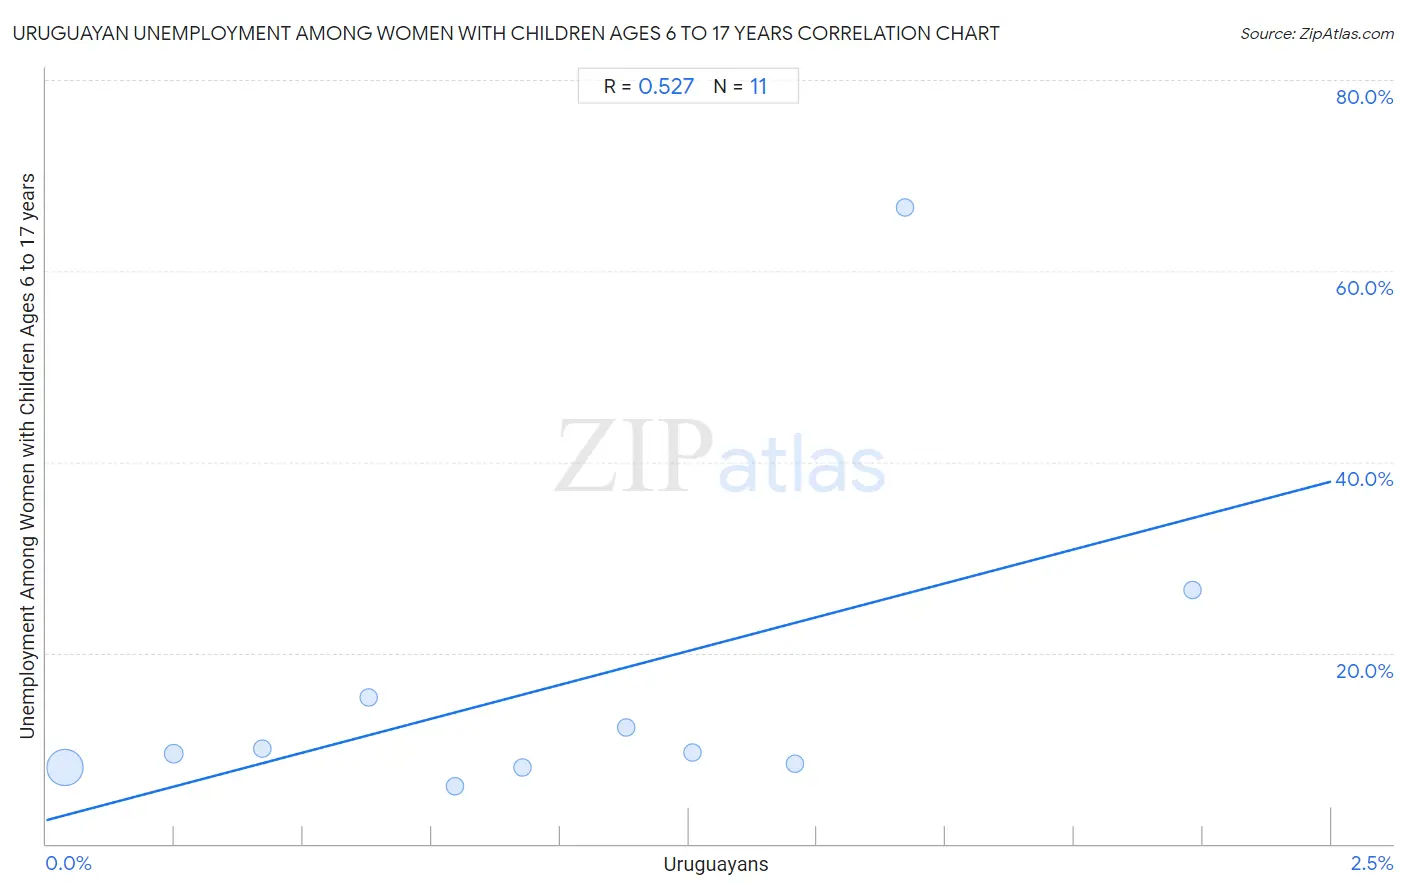
Uruguayan Unemployment Among Women with Children Ages 6 to 17 years Correlation Chart
The statistical analysis conducted on geographies consisting of 121,055,966 people shows a substantial positive correlation between the proportion of Uruguayans and unemployment rate among women with children between the ages 6 and 17 in the United States with a correlation coefficient (R) of 0.527 and weighted average of 9.3%. On average, for every 1% (one percent) increase in Uruguayans within a typical geography, there is an increase of 14.2% in unemployment rate among women with children between the ages 6 and 17.
It is essential to understand that the correlation between the percentage of Uruguayans and unemployment rate among women with children between the ages 6 and 17 does not imply a direct cause-and-effect relationship. It remains uncertain whether the presence of Uruguayans influences an upward or downward trend in the level of unemployment rate among women with children between the ages 6 and 17 within an area, or if Uruguayans simply ended up residing in those areas with higher or lower levels of unemployment rate among women with children between the ages 6 and 17 due to other factors.
Demographics Similar to Uruguayans by Unemployment Among Women with Children Ages 6 to 17 years
In terms of unemployment among women with children ages 6 to 17 years, the demographic groups most similar to Uruguayans are Hungarian (9.3%, a difference of 0.030%), Mexican (9.3%, a difference of 0.070%), Immigrants from Belize (9.3%, a difference of 0.070%), Immigrants from St. Vincent and the Grenadines (9.3%, a difference of 0.10%), and Arab (9.3%, a difference of 0.15%).
| Demographics | Rating | Rank | Unemployment Among Women with Children Ages 6 to 17 years |
| Estonians | 4.4 /100 | #228 | Tragic 9.3% |
| Lumbee | 4.3 /100 | #229 | Tragic 9.3% |
| Welsh | 4.0 /100 | #230 | Tragic 9.3% |
| Macedonians | 3.9 /100 | #231 | Tragic 9.3% |
| French American Indians | 3.7 /100 | #232 | Tragic 9.3% |
| Immigrants from St. Vincent and the Grenadines | 3.3 /100 | #233 | Tragic 9.3% |
| Mexicans | 3.2 /100 | #234 | Tragic 9.3% |
| Uruguayans | 3.0 /100 | #235 | Tragic 9.3% |
| Hungarians | 3.0 /100 | #236 | Tragic 9.3% |
| Immigrants from Belize | 2.8 /100 | #237 | Tragic 9.3% |
| Arabs | 2.7 /100 | #238 | Tragic 9.3% |
| Immigrants from Saudi Arabia | 2.7 /100 | #239 | Tragic 9.3% |
| Guatemalans | 2.3 /100 | #240 | Tragic 9.3% |
| Colombians | 2.2 /100 | #241 | Tragic 9.3% |
| Immigrants from Colombia | 2.1 /100 | #242 | Tragic 9.3% |
Uruguayan Unemployment Among Women with Children Ages 6 to 17 years Correlation Summary
| Measurement | Uruguayan Data | Unemployment Among Women with Children Ages 6 to 17 years Data |
| Minimum | 0.036% | 6.0% |
| Maximum | 2.2% | 66.7% |
| Range | 2.2% | 60.6% |
| Mean | 0.98% | 16.4% |
| Median | 0.93% | 9.6% |
| Interquartile 25% (IQ1) | 0.42% | 8.0% |
| Interquartile 75% (IQ3) | 1.5% | 15.4% |
| Interquartile Range (IQR) | 1.0% | 7.4% |
| Standard Deviation (Sample) | 0.65% | 17.6% |
| Standard Deviation (Population) | 0.62% | 16.8% |
Correlation Details
| Uruguayan Percentile | Sample Size | Unemployment Among Women with Children Ages 6 to 17 years |
[ 0.0% - 0.5% ] 0.036% | 109,667,560 | 7.9% |
[ 0.0% - 0.5% ] 0.25% | 7,832,179 | 9.5% |
[ 0.0% - 0.5% ] 0.42% | 1,657,764 | 9.9% |
[ 0.5% - 1.0% ] 0.63% | 772,924 | 15.4% |
[ 0.5% - 1.0% ] 0.79% | 342,267 | 6.0% |
[ 0.5% - 1.0% ] 0.93% | 337,267 | 8.0% |
[ 1.0% - 1.5% ] 1.13% | 98,538 | 12.2% |
[ 1.0% - 1.5% ] 1.26% | 146,161 | 9.6% |
[ 1.0% - 1.5% ] 1.46% | 134,912 | 8.4% |
[ 1.5% - 2.0% ] 1.67% | 5,031 | 66.7% |
[ 2.0% - 2.5% ] 2.23% | 61,363 | 26.6% |