Uruguayan 3 or more Vehicles in Household
COMPARE
Uruguayan
Select to Compare
3 or more Vehicles in Household
Uruguayan 3 or more Vehicles in Household
17.8%
3+ VEHICLES AVAILABLE
1.0/ 100
METRIC RATING
259th/ 347
METRIC RANK
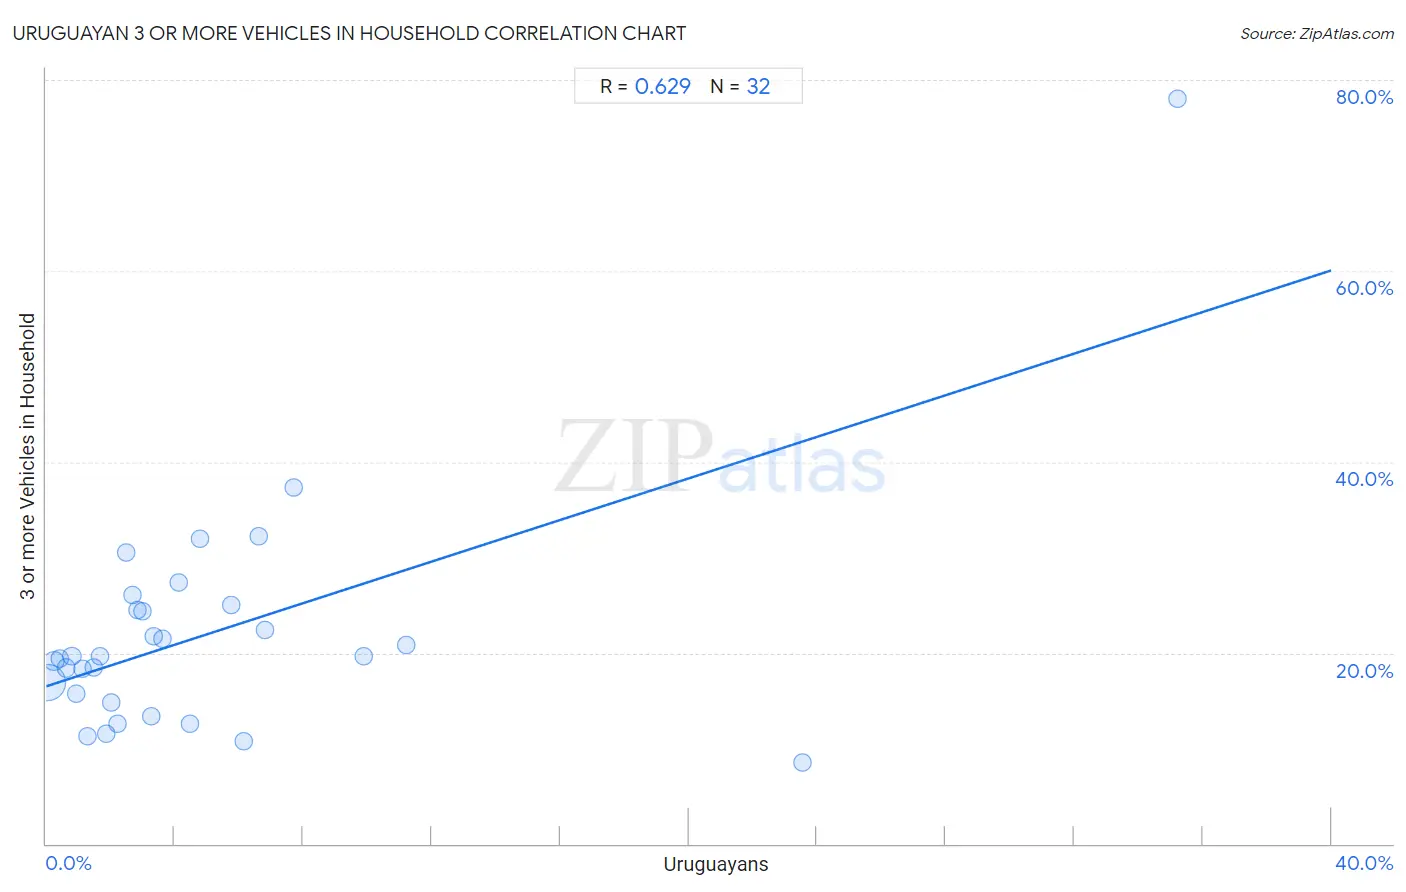
Uruguayan 3 or more Vehicles in Household Correlation Chart
The statistical analysis conducted on geographies consisting of 144,743,847 people shows a significant positive correlation between the proportion of Uruguayans and percentage of households with 3 or more vehicles available in the United States with a correlation coefficient (R) of 0.629 and weighted average of 17.8%. On average, for every 1% (one percent) increase in Uruguayans within a typical geography, there is an increase of 1.1% in percentage of households with 3 or more vehicles available.
It is essential to understand that the correlation between the percentage of Uruguayans and percentage of households with 3 or more vehicles available does not imply a direct cause-and-effect relationship. It remains uncertain whether the presence of Uruguayans influences an upward or downward trend in the level of percentage of households with 3 or more vehicles available within an area, or if Uruguayans simply ended up residing in those areas with higher or lower levels of percentage of households with 3 or more vehicles available due to other factors.
Demographics Similar to Uruguayans by 3 or more Vehicles in Household
In terms of 3 or more vehicles in household, the demographic groups most similar to Uruguayans are Ugandan (17.8%, a difference of 0.13%), Immigrants from Northern Africa (17.8%, a difference of 0.15%), Colombian (17.8%, a difference of 0.18%), Immigrants from Eritrea (17.8%, a difference of 0.22%), and Sudanese (17.8%, a difference of 0.22%).
| Demographics | Rating | Rank | 3 or more Vehicles in Household |
| Immigrants from Southern Europe | 1.4 /100 | #252 | Tragic 17.9% |
| Immigrants from Ethiopia | 1.3 /100 | #253 | Tragic 17.9% |
| Ethiopians | 1.2 /100 | #254 | Tragic 17.9% |
| Immigrants from Turkey | 1.2 /100 | #255 | Tragic 17.9% |
| Sub-Saharan Africans | 1.1 /100 | #256 | Tragic 17.9% |
| Immigrants from Eritrea | 1.1 /100 | #257 | Tragic 17.8% |
| Sudanese | 1.1 /100 | #258 | Tragic 17.8% |
| Uruguayans | 1.0 /100 | #259 | Tragic 17.8% |
| Ugandans | 0.9 /100 | #260 | Tragic 17.8% |
| Immigrants from Northern Africa | 0.9 /100 | #261 | Tragic 17.8% |
| Colombians | 0.9 /100 | #262 | Tragic 17.8% |
| Bermudans | 0.9 /100 | #263 | Tragic 17.8% |
| Cambodians | 0.9 /100 | #264 | Tragic 17.8% |
| Immigrants from Panama | 0.8 /100 | #265 | Tragic 17.7% |
| Macedonians | 0.8 /100 | #266 | Tragic 17.7% |
Uruguayan 3 or more Vehicles in Household Correlation Summary
| Measurement | Uruguayan Data | 3 or more Vehicles in Household Data |
| Minimum | 0.040% | 8.6% |
| Maximum | 35.2% | 78.0% |
| Range | 35.2% | 69.5% |
| Mean | 5.1% | 22.0% |
| Median | 2.9% | 19.7% |
| Interquartile 25% (IQ1) | 1.4% | 15.3% |
| Interquartile 75% (IQ3) | 5.9% | 24.7% |
| Interquartile Range (IQR) | 4.6% | 9.4% |
| Standard Deviation (Sample) | 7.1% | 12.3% |
| Standard Deviation (Population) | 7.0% | 12.1% |
Correlation Details
| Uruguayan Percentile | Sample Size | 3 or more Vehicles in Household |
[ 0.0% - 0.5% ] 0.040% | 126,087,490 | 16.9% |
[ 0.0% - 0.5% ] 0.25% | 11,777,802 | 19.1% |
[ 0.0% - 0.5% ] 0.42% | 2,735,443 | 19.4% |
[ 0.5% - 1.0% ] 0.61% | 1,668,563 | 18.4% |
[ 0.5% - 1.0% ] 0.80% | 872,986 | 19.7% |
[ 0.5% - 1.0% ] 0.94% | 519,332 | 15.8% |
[ 1.0% - 1.5% ] 1.13% | 223,111 | 18.4% |
[ 1.0% - 1.5% ] 1.29% | 257,352 | 11.3% |
[ 1.0% - 1.5% ] 1.48% | 237,582 | 18.4% |
[ 1.5% - 2.0% ] 1.67% | 133,798 | 19.7% |
[ 1.5% - 2.0% ] 1.85% | 71,071 | 11.5% |
[ 2.0% - 2.5% ] 2.02% | 52,551 | 14.8% |
[ 2.0% - 2.5% ] 2.23% | 69,004 | 12.6% |
[ 2.0% - 2.5% ] 2.50% | 9,969 | 30.5% |
[ 2.5% - 3.0% ] 2.69% | 1,747 | 26.0% |
[ 2.5% - 3.0% ] 2.83% | 1,659 | 24.4% |
[ 2.5% - 3.0% ] 3.00% | 1,067 | 24.3% |
[ 3.0% - 3.5% ] 3.28% | 1,250 | 13.3% |
[ 3.0% - 3.5% ] 3.36% | 506 | 21.7% |
[ 3.5% - 4.0% ] 3.61% | 887 | 21.5% |
[ 4.0% - 4.5% ] 4.11% | 7,857 | 27.3% |
[ 4.0% - 4.5% ] 4.46% | 830 | 12.6% |
[ 4.5% - 5.0% ] 4.79% | 313 | 32.0% |
[ 5.5% - 6.0% ] 5.75% | 2,367 | 25.0% |
[ 6.0% - 6.5% ] 6.15% | 179 | 10.7% |
[ 6.5% - 7.0% ] 6.63% | 4,553 | 32.2% |
[ 6.5% - 7.0% ] 6.79% | 324 | 22.4% |
[ 7.5% - 8.0% ] 7.69% | 611 | 37.3% |
[ 9.5% - 10.0% ] 9.89% | 3,114 | 19.7% |
[ 11.0% - 11.5% ] 11.20% | 250 | 20.8% |
[ 23.5% - 24.0% ] 23.56% | 191 | 8.6% |
[ 35.0% - 35.5% ] 35.23% | 88 | 78.0% |