Danish 3 or more Vehicles in Household
COMPARE
Danish
Select to Compare
3 or more Vehicles in Household
Danish 3 or more Vehicles in Household
24.7%
3+ VEHICLES AVAILABLE
100.0/ 100
METRIC RATING
12th/ 347
METRIC RANK
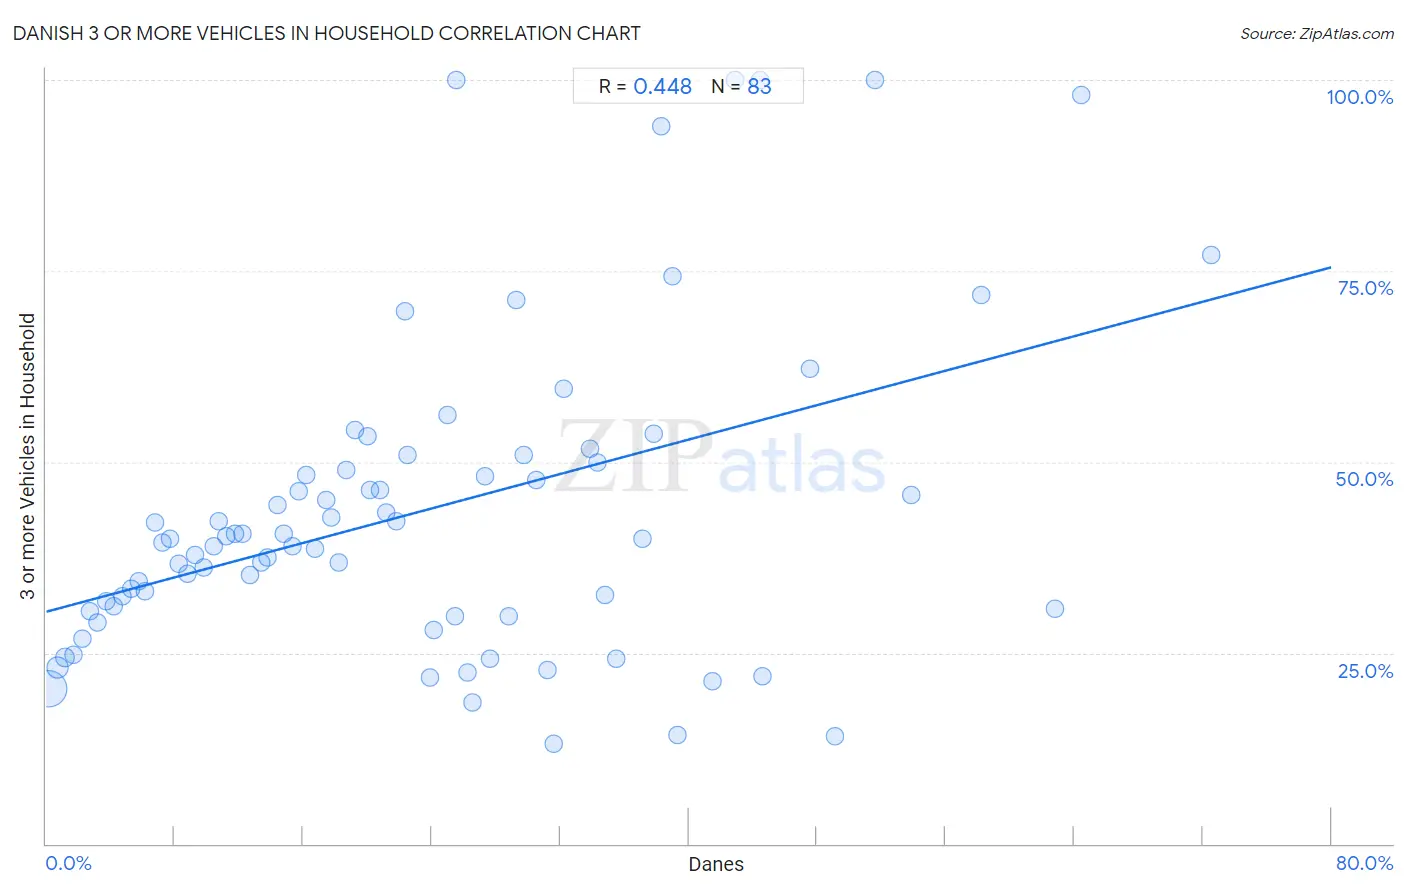
Danish 3 or more Vehicles in Household Correlation Chart
The statistical analysis conducted on geographies consisting of 473,746,883 people shows a moderate positive correlation between the proportion of Danes and percentage of households with 3 or more vehicles available in the United States with a correlation coefficient (R) of 0.448 and weighted average of 24.7%. On average, for every 1% (one percent) increase in Danes within a typical geography, there is an increase of 0.56% in percentage of households with 3 or more vehicles available.
It is essential to understand that the correlation between the percentage of Danes and percentage of households with 3 or more vehicles available does not imply a direct cause-and-effect relationship. It remains uncertain whether the presence of Danes influences an upward or downward trend in the level of percentage of households with 3 or more vehicles available within an area, or if Danes simply ended up residing in those areas with higher or lower levels of percentage of households with 3 or more vehicles available due to other factors.
Demographics Similar to Danes by 3 or more Vehicles in Household
In terms of 3 or more vehicles in household, the demographic groups most similar to Danes are Mexican (24.7%, a difference of 0.080%), Immigrants from Mexico (24.6%, a difference of 0.52%), Shoshone (24.9%, a difference of 0.69%), Nepalese (24.9%, a difference of 0.79%), and Native Hawaiian (24.9%, a difference of 0.88%).
| Demographics | Rating | Rank | 3 or more Vehicles in Household |
| Puget Sound Salish | 100.0 /100 | #5 | Exceptional 26.4% |
| Immigrants from Fiji | 100.0 /100 | #6 | Exceptional 26.1% |
| Colville | 100.0 /100 | #7 | Exceptional 25.8% |
| Samoans | 100.0 /100 | #8 | Exceptional 25.0% |
| Native Hawaiians | 100.0 /100 | #9 | Exceptional 24.9% |
| Nepalese | 100.0 /100 | #10 | Exceptional 24.9% |
| Shoshone | 100.0 /100 | #11 | Exceptional 24.9% |
| Danes | 100.0 /100 | #12 | Exceptional 24.7% |
| Mexicans | 100.0 /100 | #13 | Exceptional 24.7% |
| Immigrants from Mexico | 100.0 /100 | #14 | Exceptional 24.6% |
| Hawaiians | 100.0 /100 | #15 | Exceptional 24.3% |
| Basques | 100.0 /100 | #16 | Exceptional 24.3% |
| Koreans | 100.0 /100 | #17 | Exceptional 24.1% |
| Norwegians | 100.0 /100 | #18 | Exceptional 23.9% |
| Chinese | 100.0 /100 | #19 | Exceptional 23.9% |
Danish 3 or more Vehicles in Household Correlation Summary
| Measurement | Danish Data | 3 or more Vehicles in Household Data |
| Minimum | 0.19% | 13.0% |
| Maximum | 72.5% | 100.0% |
| Range | 72.3% | 87.0% |
| Mean | 23.3% | 43.5% |
| Median | 20.8% | 40.0% |
| Interquartile 25% (IQ1) | 10.4% | 30.5% |
| Interquartile 75% (IQ3) | 33.8% | 50.0% |
| Interquartile Range (IQR) | 23.4% | 19.5% |
| Standard Deviation (Sample) | 16.4% | 20.6% |
| Standard Deviation (Population) | 16.3% | 20.5% |
Correlation Details
| Danish Percentile | Sample Size | 3 or more Vehicles in Household |
[ 0.0% - 0.5% ] 0.19% | 356,932,988 | 20.3% |
[ 0.5% - 1.0% ] 0.71% | 70,168,794 | 23.0% |
[ 1.0% - 1.5% ] 1.20% | 24,617,364 | 24.4% |
[ 1.5% - 2.0% ] 1.70% | 9,019,615 | 24.7% |
[ 2.0% - 2.5% ] 2.24% | 3,223,593 | 26.8% |
[ 2.5% - 3.0% ] 2.73% | 2,010,472 | 30.5% |
[ 3.0% - 3.5% ] 3.22% | 1,487,435 | 29.0% |
[ 3.5% - 4.0% ] 3.75% | 1,685,945 | 31.8% |
[ 4.0% - 4.5% ] 4.21% | 1,162,926 | 31.1% |
[ 4.5% - 5.0% ] 4.73% | 958,979 | 32.4% |
[ 5.0% - 5.5% ] 5.27% | 785,377 | 33.4% |
[ 5.5% - 6.0% ] 5.77% | 472,228 | 34.4% |
[ 6.0% - 6.5% ] 6.18% | 260,800 | 33.0% |
[ 6.5% - 7.0% ] 6.80% | 187,492 | 42.0% |
[ 7.0% - 7.5% ] 7.22% | 133,709 | 39.4% |
[ 7.5% - 8.0% ] 7.74% | 199,566 | 40.0% |
[ 8.0% - 8.5% ] 8.28% | 105,455 | 36.7% |
[ 8.5% - 9.0% ] 8.76% | 60,905 | 35.4% |
[ 9.0% - 9.5% ] 9.26% | 22,949 | 37.9% |
[ 9.5% - 10.0% ] 9.77% | 35,910 | 36.2% |
[ 10.0% - 10.5% ] 10.40% | 17,044 | 38.9% |
[ 10.5% - 11.0% ] 10.75% | 28,557 | 42.2% |
[ 11.0% - 11.5% ] 11.22% | 23,205 | 40.3% |
[ 11.5% - 12.0% ] 11.73% | 8,345 | 40.6% |
[ 12.0% - 12.5% ] 12.24% | 4,887 | 40.5% |
[ 12.5% - 13.0% ] 12.71% | 16,217 | 35.2% |
[ 13.0% - 13.5% ] 13.35% | 16,817 | 36.9% |
[ 13.5% - 14.0% ] 13.77% | 11,079 | 37.4% |
[ 14.0% - 14.5% ] 14.37% | 11,910 | 44.4% |
[ 14.5% - 15.0% ] 14.78% | 6,301 | 40.5% |
[ 15.0% - 15.5% ] 15.32% | 3,250 | 39.0% |
[ 15.5% - 16.0% ] 15.69% | 3,269 | 46.1% |
[ 16.0% - 16.5% ] 16.20% | 1,883 | 48.3% |
[ 16.5% - 17.0% ] 16.74% | 5,216 | 38.6% |
[ 17.0% - 17.5% ] 17.44% | 9,456 | 45.0% |
[ 17.5% - 18.0% ] 17.71% | 3,382 | 42.8% |
[ 18.0% - 18.5% ] 18.18% | 2,310 | 36.8% |
[ 18.5% - 19.0% ] 18.71% | 3,004 | 49.0% |
[ 19.0% - 19.5% ] 19.21% | 4,414 | 54.2% |
[ 20.0% - 20.5% ] 20.00% | 1,120 | 53.4% |
[ 20.0% - 20.5% ] 20.19% | 5,766 | 46.3% |
[ 20.5% - 21.0% ] 20.77% | 183 | 46.4% |
[ 21.0% - 21.5% ] 21.19% | 2,883 | 43.3% |
[ 21.5% - 22.0% ] 21.79% | 5,070 | 42.2% |
[ 22.0% - 22.5% ] 22.37% | 152 | 69.8% |
[ 22.5% - 23.0% ] 22.52% | 222 | 50.9% |
[ 23.5% - 24.0% ] 23.90% | 364 | 21.8% |
[ 24.0% - 24.5% ] 24.10% | 83 | 28.0% |
[ 25.0% - 25.5% ] 25.00% | 284 | 56.2% |
[ 25.0% - 25.5% ] 25.41% | 3,199 | 29.7% |
[ 25.5% - 26.0% ] 25.53% | 47 | 100.0% |
[ 26.0% - 26.5% ] 26.22% | 2,136 | 22.4% |
[ 26.5% - 27.0% ] 26.53% | 98 | 18.5% |
[ 27.0% - 27.5% ] 27.30% | 989 | 48.1% |
[ 27.5% - 28.0% ] 27.66% | 141 | 24.3% |
[ 28.5% - 29.0% ] 28.79% | 3,050 | 29.9% |
[ 29.0% - 29.5% ] 29.27% | 328 | 71.1% |
[ 29.5% - 30.0% ] 29.75% | 2,198 | 50.8% |
[ 30.5% - 31.0% ] 30.53% | 606 | 47.6% |
[ 31.0% - 31.5% ] 31.20% | 407 | 22.8% |
[ 31.5% - 32.0% ] 31.58% | 57 | 13.0% |
[ 32.0% - 32.5% ] 32.22% | 90 | 59.6% |
[ 33.5% - 34.0% ] 33.82% | 68 | 51.7% |
[ 34.0% - 34.5% ] 34.29% | 35 | 50.0% |
[ 34.5% - 35.0% ] 34.79% | 891 | 32.5% |
[ 35.0% - 35.5% ] 35.48% | 465 | 24.2% |
[ 37.0% - 37.5% ] 37.08% | 240 | 40.0% |
[ 37.5% - 38.0% ] 37.80% | 746 | 53.6% |
[ 38.0% - 38.5% ] 38.27% | 81 | 93.9% |
[ 38.5% - 39.0% ] 38.98% | 372 | 74.4% |
[ 39.0% - 39.5% ] 39.33% | 178 | 14.3% |
[ 41.0% - 41.5% ] 41.45% | 152 | 21.2% |
[ 42.5% - 43.0% ] 42.86% | 147 | 100.0% |
[ 44.0% - 44.5% ] 44.44% | 9 | 100.0% |
[ 44.5% - 45.0% ] 44.59% | 74 | 22.0% |
[ 47.5% - 48.0% ] 47.59% | 145 | 62.3% |
[ 49.0% - 49.5% ] 49.12% | 57 | 14.0% |
[ 51.5% - 52.0% ] 51.61% | 31 | 100.0% |
[ 53.5% - 54.0% ] 53.85% | 104 | 45.7% |
[ 58.0% - 58.5% ] 58.17% | 208 | 71.9% |
[ 62.5% - 63.0% ] 62.79% | 43 | 30.8% |
[ 64.0% - 64.5% ] 64.44% | 225 | 98.0% |
[ 72.5% - 73.0% ] 72.53% | 91 | 77.1% |