Millport, AL Map & Demographics
Millport Map
Millport Overview
$24,363
PER CAPITA INCOME
$100,583
AVG FAMILY INCOME
$68,750
AVG HOUSEHOLD INCOME
1.8%
WAGE / INCOME GAP [ % ]
98.2¢/ $1
WAGE / INCOME GAP [ $ ]
0.34
INEQUALITY / GINI INDEX
1,288
TOTAL POPULATION
713
MALE POPULATION
575
FEMALE POPULATION
124.00
MALES / 100 FEMALES
80.65
FEMALES / 100 MALES
40.1
MEDIAN AGE
3.5
AVG FAMILY SIZE
3.0
AVG HOUSEHOLD SIZE
597
LABOR FORCE [ PEOPLE ]
61.8%
PERCENT IN LABOR FORCE
1.5%
UNEMPLOYMENT RATE
Millport Zip Codes
Millport Area Codes
Income in Millport
Income Overview in Millport
Per Capita Income in Millport is $24,363, while median incomes of families and households are $100,583 and $68,750 respectively.
| Characteristic | Number | Measure |
| Per Capita Income | 1,288 | $24,363 |
| Median Family Income | 341 | $100,583 |
| Mean Family Income | 341 | $80,466 |
| Median Household Income | 424 | $68,750 |
| Mean Household Income | 424 | $71,851 |
| Income Deficit | 341 | $0 |
| Wage / Income Gap (%) | 1,288 | 1.83% |
| Wage / Income Gap ($) | 1,288 | 98.17¢ per $1 |
| Gini / Inequality Index | 1,288 | 0.34 |
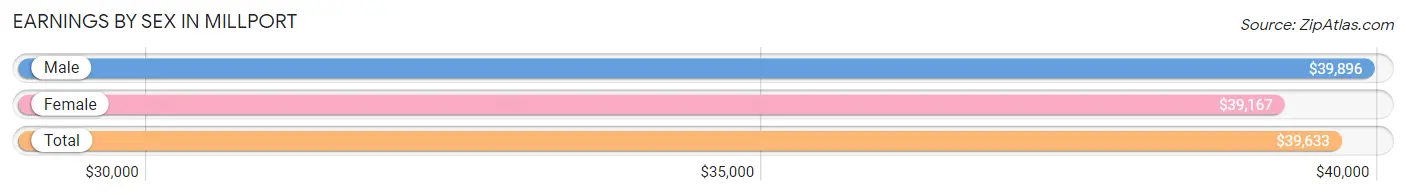
Earnings by Sex in Millport
Average Earnings in Millport are $39,633, $39,896 for men and $39,167 for women, a difference of 1.8%.
| Sex | Number | Average Earnings |
| Male | 286 (48.6%) | $39,896 |
| Female | 302 (51.4%) | $39,167 |
| Total | 588 (100.0%) | $39,633 |
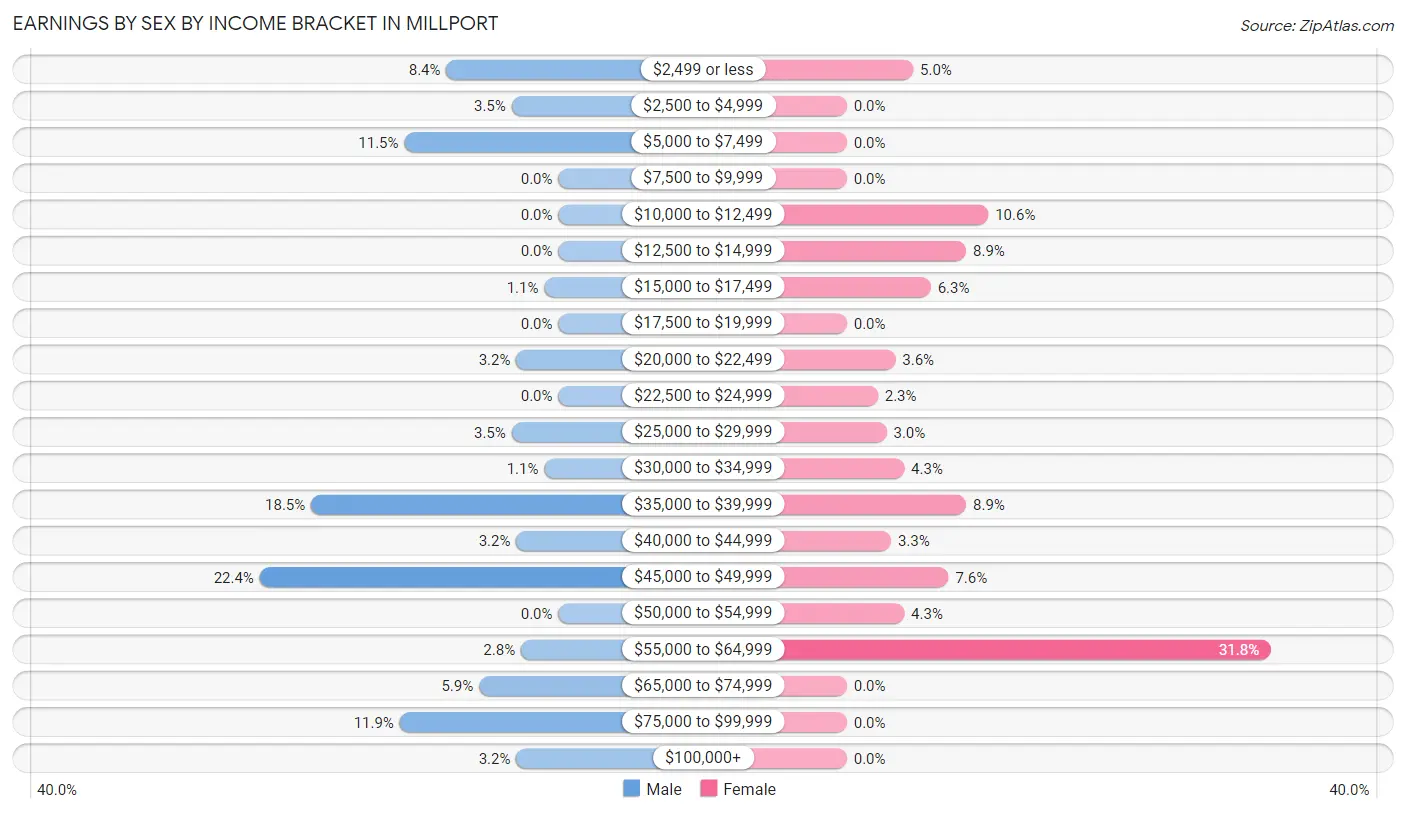
Earnings by Sex by Income Bracket in Millport
The most common earnings brackets in Millport are $45,000 to $49,999 for men (64 | 22.4%) and $55,000 to $64,999 for women (96 | 31.8%).
| Income | Male | Female |
| $2,499 or less | 24 (8.4%) | 15 (5.0%) |
| $2,500 to $4,999 | 10 (3.5%) | 0 (0.0%) |
| $5,000 to $7,499 | 33 (11.5%) | 0 (0.0%) |
| $7,500 to $9,999 | 0 (0.0%) | 0 (0.0%) |
| $10,000 to $12,499 | 0 (0.0%) | 32 (10.6%) |
| $12,500 to $14,999 | 0 (0.0%) | 27 (8.9%) |
| $15,000 to $17,499 | 3 (1.1%) | 19 (6.3%) |
| $17,500 to $19,999 | 0 (0.0%) | 0 (0.0%) |
| $20,000 to $22,499 | 9 (3.2%) | 11 (3.6%) |
| $22,500 to $24,999 | 0 (0.0%) | 7 (2.3%) |
| $25,000 to $29,999 | 10 (3.5%) | 9 (3.0%) |
| $30,000 to $34,999 | 3 (1.1%) | 13 (4.3%) |
| $35,000 to $39,999 | 53 (18.5%) | 27 (8.9%) |
| $40,000 to $44,999 | 9 (3.2%) | 10 (3.3%) |
| $45,000 to $49,999 | 64 (22.4%) | 23 (7.6%) |
| $50,000 to $54,999 | 0 (0.0%) | 13 (4.3%) |
| $55,000 to $64,999 | 8 (2.8%) | 96 (31.8%) |
| $65,000 to $74,999 | 17 (5.9%) | 0 (0.0%) |
| $75,000 to $99,999 | 34 (11.9%) | 0 (0.0%) |
| $100,000+ | 9 (3.2%) | 0 (0.0%) |
| Total | 286 (100.0%) | 302 (100.0%) |
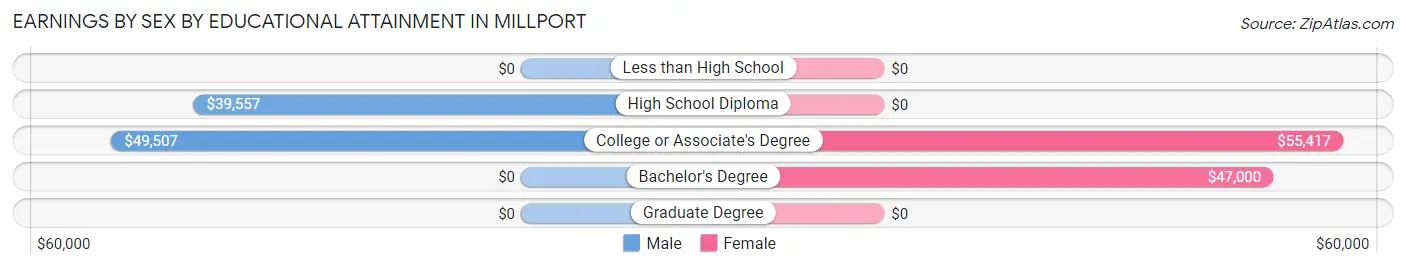
Earnings by Sex by Educational Attainment in Millport
Average earnings in Millport are $47,356 for men and $45,598 for women, a difference of 3.7%. Men with an educational attainment of college or associate's degree enjoy the highest average annual earnings of $49,507, while those with high school diploma education earn the least with $39,557. Women with an educational attainment of college or associate's degree earn the most with the average annual earnings of $55,417, while those with bachelor's degree education have the smallest earnings of $47,000.
| Educational Attainment | Male Income | Female Income |
| Less than High School | - | - |
| High School Diploma | $39,557 | $0 |
| College or Associate's Degree | $49,507 | $55,417 |
| Bachelor's Degree | - | - |
| Graduate Degree | - | - |
| Total | $47,356 | $45,598 |
Family Income in Millport
Family Income Brackets in Millport
According to the Millport family income data, there are 170 families falling into the $100,000 to $149,999 income range, which is the most common income bracket and makes up 49.8% of all families.
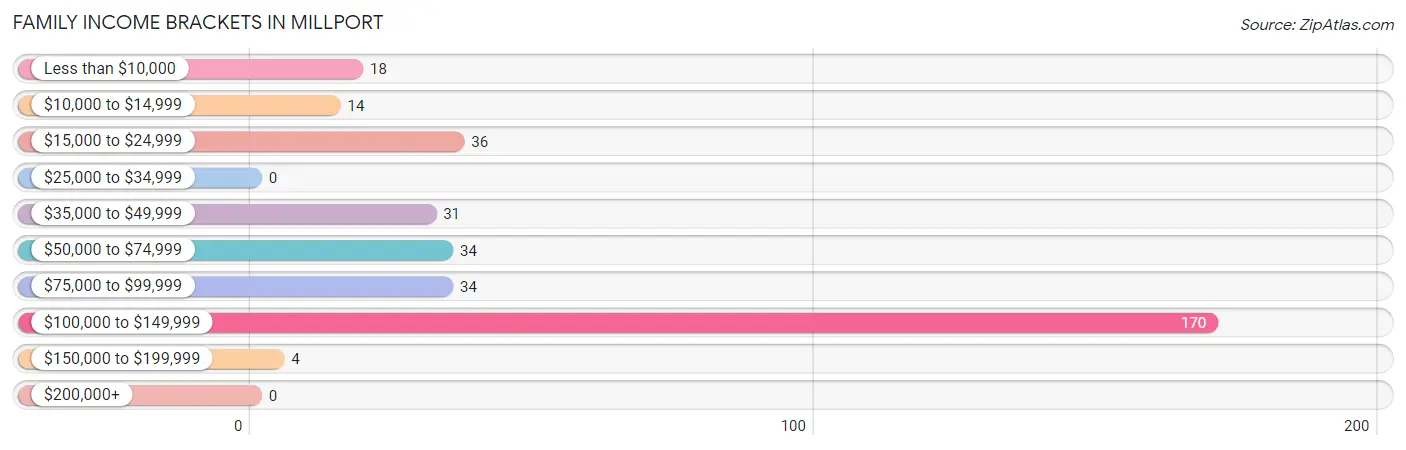
| Income Bracket | # Families | % Families |
| Less than $10,000 | 18 | 5.3% |
| $10,000 to $14,999 | 14 | 4.1% |
| $15,000 to $24,999 | 36 | 10.6% |
| $25,000 to $34,999 | 0 | 0.0% |
| $35,000 to $49,999 | 31 | 9.1% |
| $50,000 to $74,999 | 34 | 10.0% |
| $75,000 to $99,999 | 34 | 10.0% |
| $100,000 to $149,999 | 170 | 49.9% |
| $150,000 to $199,999 | 4 | 1.2% |
| $200,000+ | 0 | 0.0% |
Family Income by Famaliy Size in Millport
4-person families (123 | 36.1%) account for the highest median family income in Millport with $118,398 per family, while 4-person families (123 | 36.1%) have the highest median income of $29,600 per family member.
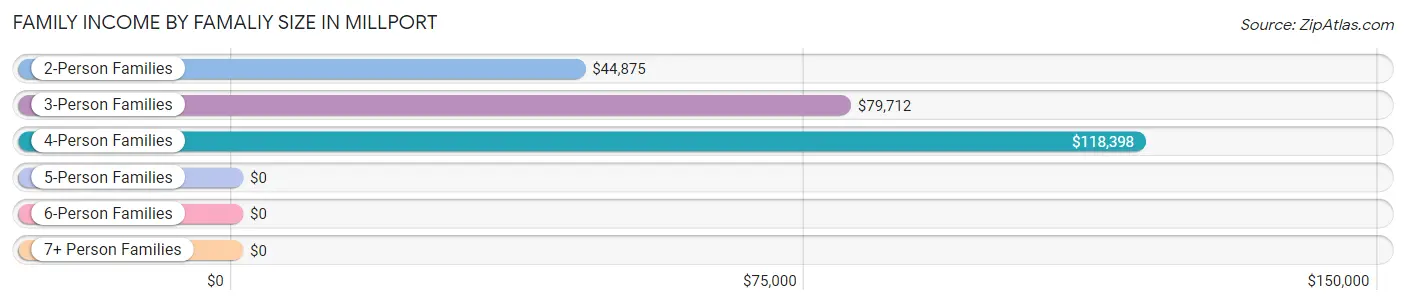
| Income Bracket | # Families | Median Income |
| 2-Person Families | 111 (32.6%) | $44,875 |
| 3-Person Families | 99 (29.0%) | $79,712 |
| 4-Person Families | 123 (36.1%) | $118,398 |
| 5-Person Families | 3 (0.9%) | $0 |
| 6-Person Families | 5 (1.5%) | $0 |
| 7+ Person Families | 0 (0.0%) | $0 |
| Total | 341 (100.0%) | $100,583 |
Family Income by Number of Earners in Millport
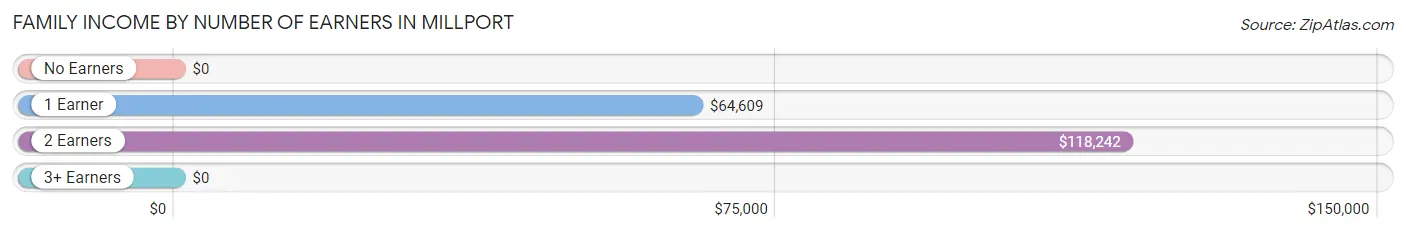
| Number of Earners | # Families | Median Income |
| No Earners | 58 (17.0%) | $0 |
| 1 Earner | 99 (29.0%) | $64,609 |
| 2 Earners | 159 (46.6%) | $118,242 |
| 3+ Earners | 25 (7.3%) | $0 |
| Total | 341 (100.0%) | $100,583 |
Household Income in Millport
Household Income Brackets in Millport
With 175 households falling in the category, the $100,000 to $149,999 income range is the most frequent in Millport, accounting for 41.3% of all households.
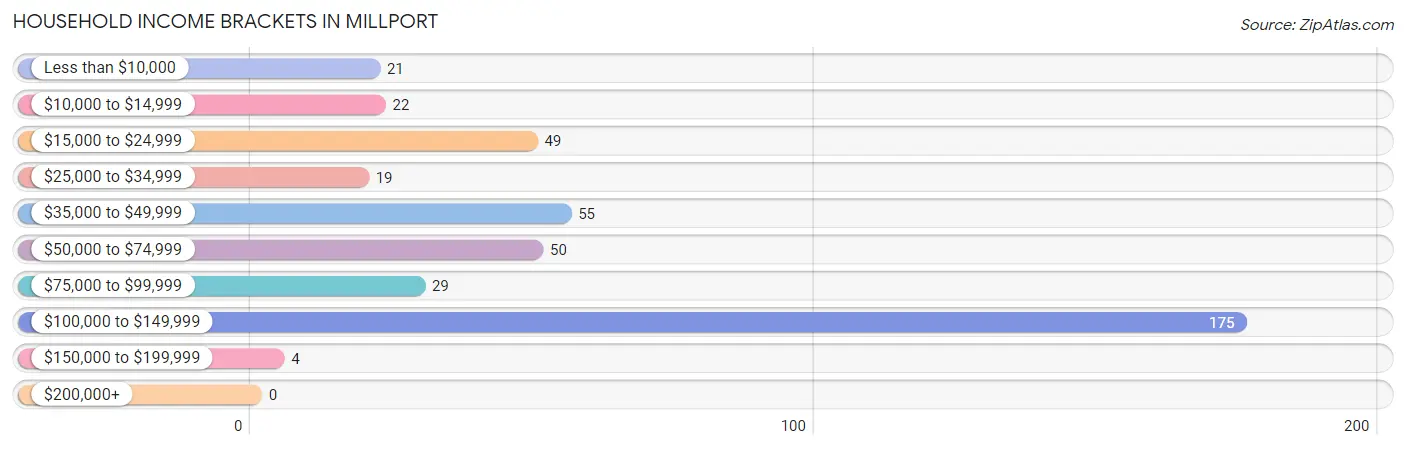
| Income Bracket | # Households | % Households |
| Less than $10,000 | 21 | 5.0% |
| $10,000 to $14,999 | 22 | 5.2% |
| $15,000 to $24,999 | 49 | 11.6% |
| $25,000 to $34,999 | 19 | 4.5% |
| $35,000 to $49,999 | 55 | 13.0% |
| $50,000 to $74,999 | 50 | 11.8% |
| $75,000 to $99,999 | 29 | 6.8% |
| $100,000 to $149,999 | 175 | 41.3% |
| $150,000 to $199,999 | 4 | 0.9% |
| $200,000+ | 0 | 0.0% |
Household Income by Householder Age in Millport
The median household income in Millport is $68,750, with the highest median household income of $118,151 found in the 25 to 44 years age bracket for the primary householder. A total of 170 households (40.1%) fall into this category. Meanwhile, the 15 to 24 years age bracket for the primary householder has the lowest median household income of $0, with 7 households (1.7%) in this group.
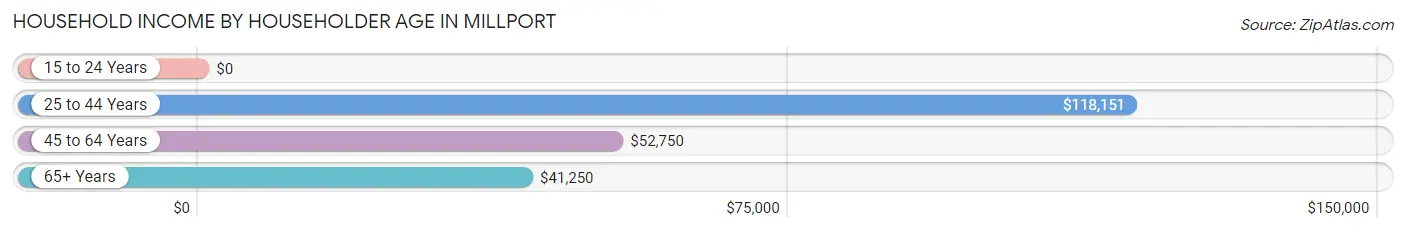
| Income Bracket | # Households | Median Income |
| 15 to 24 Years | 7 (1.7%) | $0 |
| 25 to 44 Years | 170 (40.1%) | $118,151 |
| 45 to 64 Years | 99 (23.4%) | $52,750 |
| 65+ Years | 148 (34.9%) | $41,250 |
| Total | 424 (100.0%) | $68,750 |
Poverty in Millport
Income Below Poverty by Sex and Age in Millport
With 12.2% poverty level for males and 23.3% for females among the residents of Millport, under 5 year old males and 16 and 17 year old females are the most vulnerable to poverty, with 11 males (32.4%) and 4 females (100.0%) in their respective age groups living below the poverty level.
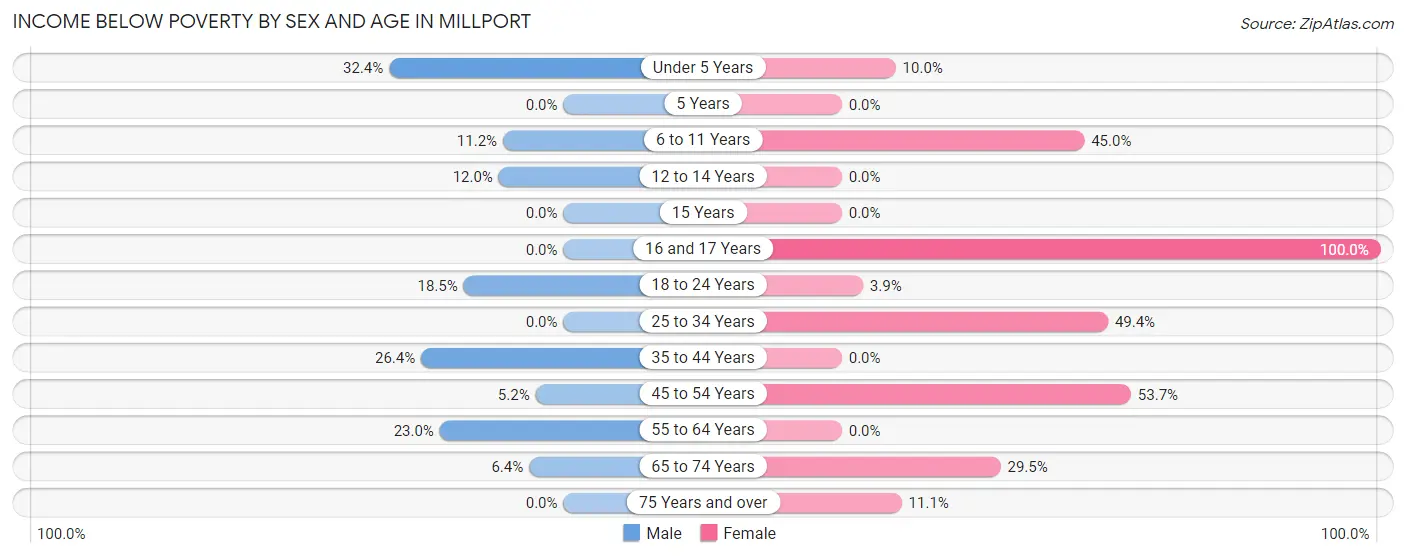
| Age Bracket | Male | Female |
| Under 5 Years | 11 (32.4%) | 3 (10.0%) |
| 5 Years | 0 (0.0%) | 0 (0.0%) |
| 6 to 11 Years | 11 (11.2%) | 9 (45.0%) |
| 12 to 14 Years | 3 (12.0%) | 0 (0.0%) |
| 15 Years | 0 (0.0%) | 0 (0.0%) |
| 16 and 17 Years | 0 (0.0%) | 4 (100.0%) |
| 18 to 24 Years | 10 (18.5%) | 2 (3.9%) |
| 25 to 34 Years | 0 (0.0%) | 41 (49.4%) |
| 35 to 44 Years | 28 (26.4%) | 0 (0.0%) |
| 45 to 54 Years | 3 (5.2%) | 44 (53.7%) |
| 55 to 64 Years | 14 (23.0%) | 0 (0.0%) |
| 65 to 74 Years | 7 (6.4%) | 28 (29.5%) |
| 75 Years and over | 0 (0.0%) | 3 (11.1%) |
| Total | 87 (12.2%) | 134 (23.3%) |
Income Above Poverty by Sex and Age in Millport
According to the poverty statistics in Millport, males aged 15 years and females aged 12 to 14 years are the age groups that are most secure financially, with 100.0% of males and 100.0% of females in these age groups living above the poverty line.
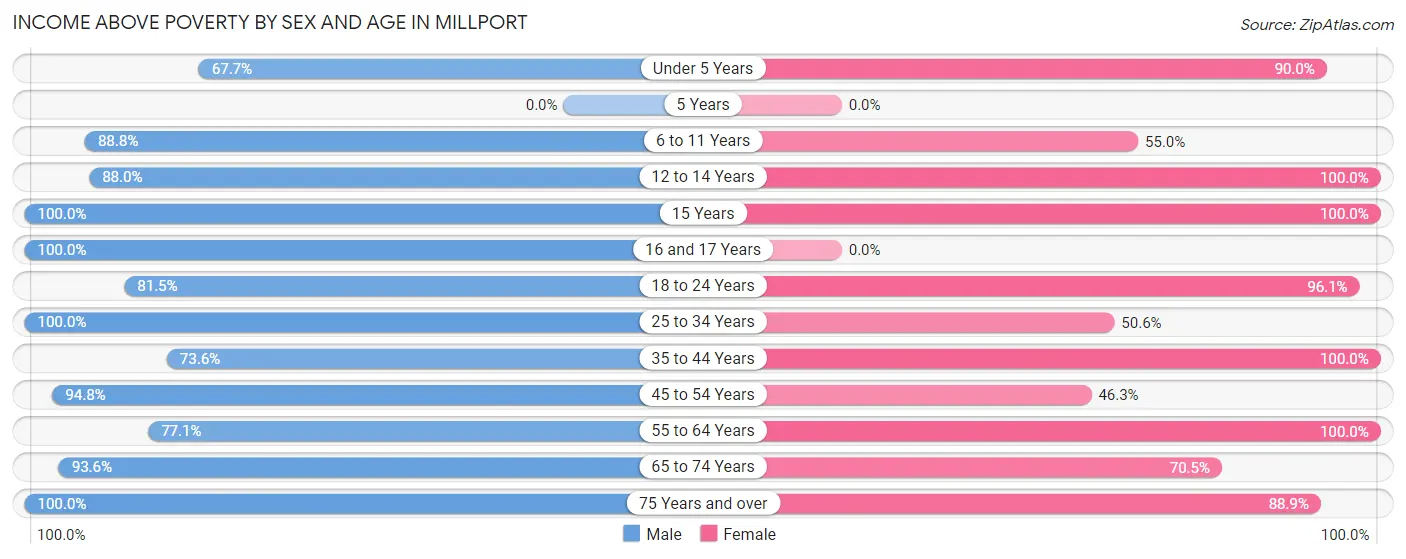
| Age Bracket | Male | Female |
| Under 5 Years | 23 (67.6%) | 27 (90.0%) |
| 5 Years | 0 (0.0%) | 0 (0.0%) |
| 6 to 11 Years | 87 (88.8%) | 11 (55.0%) |
| 12 to 14 Years | 22 (88.0%) | 21 (100.0%) |
| 15 Years | 90 (100.0%) | 4 (100.0%) |
| 16 and 17 Years | 24 (100.0%) | 0 (0.0%) |
| 18 to 24 Years | 44 (81.5%) | 49 (96.1%) |
| 25 to 34 Years | 27 (100.0%) | 42 (50.6%) |
| 35 to 44 Years | 78 (73.6%) | 124 (100.0%) |
| 45 to 54 Years | 55 (94.8%) | 38 (46.3%) |
| 55 to 64 Years | 47 (77.0%) | 34 (100.0%) |
| 65 to 74 Years | 103 (93.6%) | 67 (70.5%) |
| 75 Years and over | 26 (100.0%) | 24 (88.9%) |
| Total | 626 (87.8%) | 441 (76.7%) |
Income Below Poverty Among Married-Couple Families in Millport
The poverty statistics for married-couple families in Millport show that 3.4% or 7 of the total 206 families live below the poverty line. Families with 1 or 2 children have the highest poverty rate of 5.1%, comprising of 7 families. On the other hand, families with no children have the lowest poverty rate of 0.0%, which includes 0 families.
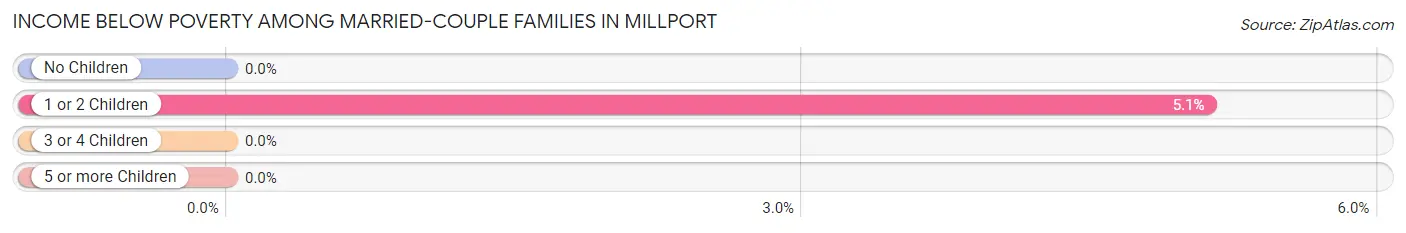
| Children | Above Poverty | Below Poverty |
| No Children | 69 (100.0%) | 0 (0.0%) |
| 1 or 2 Children | 130 (94.9%) | 7 (5.1%) |
| 3 or 4 Children | 0 (0.0%) | 0 (0.0%) |
| 5 or more Children | 0 (0.0%) | 0 (0.0%) |
| Total | 199 (96.6%) | 7 (3.4%) |
Income Below Poverty Among Single-Parent Households in Millport
According to the poverty data in Millport, 22.6% or 7 single-father households and 43.3% or 45 single-mother households are living below the poverty line. Among single-father households, those with no children have the highest poverty rate, with 7 households (100.0%) experiencing poverty. Likewise, among single-mother households, those with 3 or 4 children have the highest poverty rate, with 4 households (100.0%) falling below the poverty line.
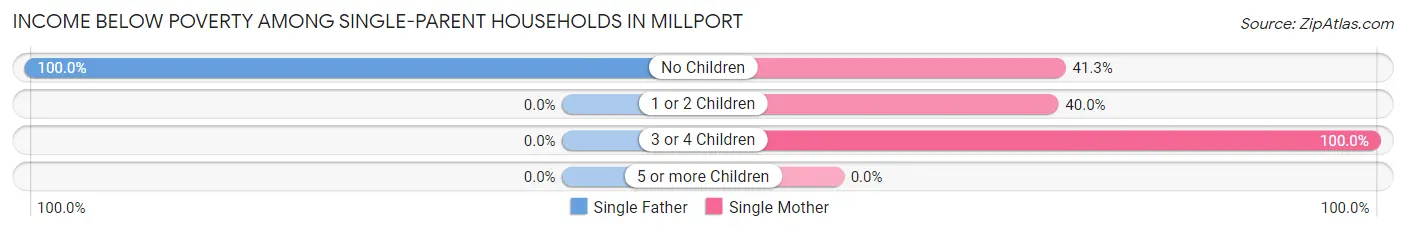
| Children | Single Father | Single Mother |
| No Children | 7 (100.0%) | 31 (41.3%) |
| 1 or 2 Children | 0 (0.0%) | 10 (40.0%) |
| 3 or 4 Children | 0 (0.0%) | 4 (100.0%) |
| 5 or more Children | 0 (0.0%) | 0 (0.0%) |
| Total | 7 (22.6%) | 45 (43.3%) |
Income Below Poverty Among Married-Couple vs Single-Parent Households in Millport
The poverty data for Millport shows that 7 of the married-couple family households (3.4%) and 52 of the single-parent households (38.5%) are living below the poverty level. Within the married-couple family households, those with 1 or 2 children have the highest poverty rate, with 7 households (5.1%) falling below the poverty line. Among the single-parent households, those with 3 or 4 children have the highest poverty rate, with 4 household (100.0%) living below poverty.
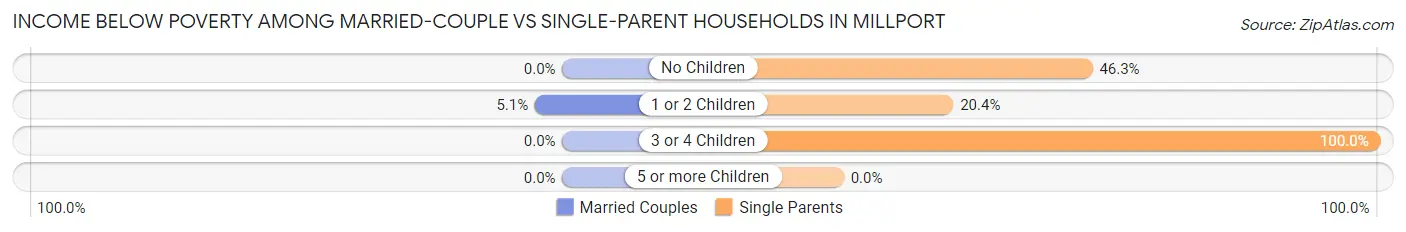
| Children | Married-Couple Families | Single-Parent Households |
| No Children | 0 (0.0%) | 38 (46.3%) |
| 1 or 2 Children | 7 (5.1%) | 10 (20.4%) |
| 3 or 4 Children | 0 (0.0%) | 4 (100.0%) |
| 5 or more Children | 0 (0.0%) | 0 (0.0%) |
| Total | 7 (3.4%) | 52 (38.5%) |
Race in Millport
The most populous races in Millport are White / Caucasian (841 | 65.3%), Black / African American (423 | 32.8%), and Two or more Races (24 | 1.9%).
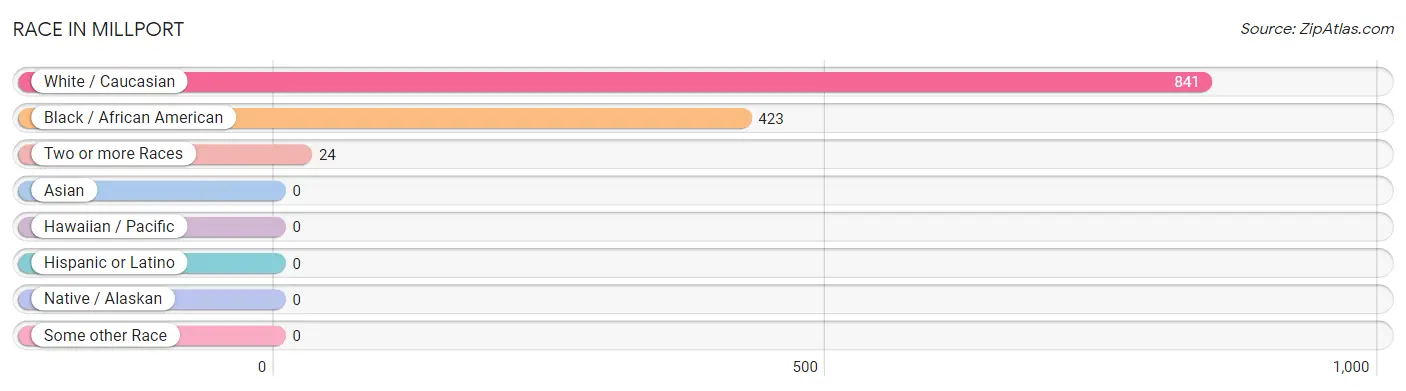
| Race | # Population | % Population |
| Asian | 0 | 0.0% |
| Black / African American | 423 | 32.8% |
| Hawaiian / Pacific | 0 | 0.0% |
| Hispanic or Latino | 0 | 0.0% |
| Native / Alaskan | 0 | 0.0% |
| White / Caucasian | 841 | 65.3% |
| Two or more Races | 24 | 1.9% |
| Some other Race | 0 | 0.0% |
| Total | 1,288 | 100.0% |
Ancestry in Millport
The most populous ancestries reported in Millport are American (67 | 5.2%), Irish (60 | 4.7%), English (53 | 4.1%), German (53 | 4.1%), and French (44 | 3.4%), together accounting for 21.5% of all Millport residents.
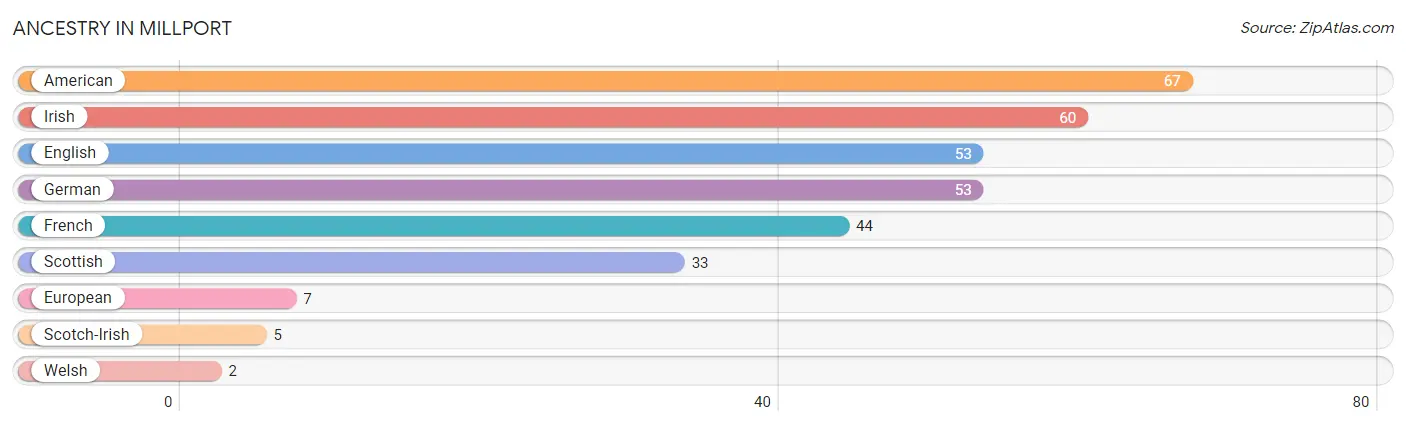
| Ancestry | # Population | % Population |
| American | 67 | 5.2% |
| English | 53 | 4.1% |
| European | 7 | 0.5% |
| French | 44 | 3.4% |
| German | 53 | 4.1% |
| Irish | 60 | 4.7% |
| Scotch-Irish | 5 | 0.4% |
| Scottish | 33 | 2.6% |
| Welsh | 2 | 0.2% | View All 9 Rows |
Immigrants in Millport

| Immigration Origin | # Population | % Population | View All 0 Rows |
Sex and Age in Millport
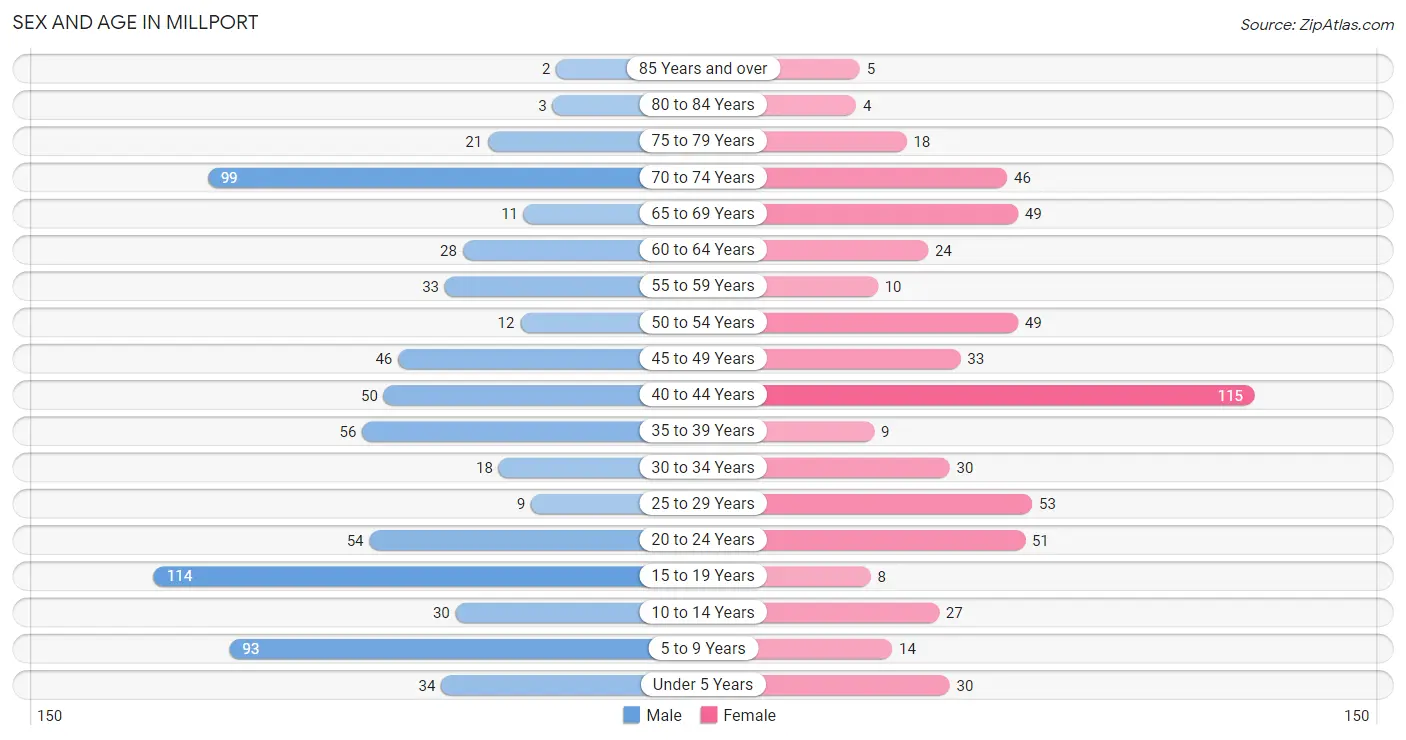
Sex and Age in Millport
The most populous age groups in Millport are 15 to 19 Years (114 | 16.0%) for men and 40 to 44 Years (115 | 20.0%) for women.
| Age Bracket | Male | Female |
| Under 5 Years | 34 (4.8%) | 30 (5.2%) |
| 5 to 9 Years | 93 (13.0%) | 14 (2.4%) |
| 10 to 14 Years | 30 (4.2%) | 27 (4.7%) |
| 15 to 19 Years | 114 (16.0%) | 8 (1.4%) |
| 20 to 24 Years | 54 (7.6%) | 51 (8.9%) |
| 25 to 29 Years | 9 (1.3%) | 53 (9.2%) |
| 30 to 34 Years | 18 (2.5%) | 30 (5.2%) |
| 35 to 39 Years | 56 (7.9%) | 9 (1.6%) |
| 40 to 44 Years | 50 (7.0%) | 115 (20.0%) |
| 45 to 49 Years | 46 (6.5%) | 33 (5.7%) |
| 50 to 54 Years | 12 (1.7%) | 49 (8.5%) |
| 55 to 59 Years | 33 (4.6%) | 10 (1.7%) |
| 60 to 64 Years | 28 (3.9%) | 24 (4.2%) |
| 65 to 69 Years | 11 (1.5%) | 49 (8.5%) |
| 70 to 74 Years | 99 (13.9%) | 46 (8.0%) |
| 75 to 79 Years | 21 (2.9%) | 18 (3.1%) |
| 80 to 84 Years | 3 (0.4%) | 4 (0.7%) |
| 85 Years and over | 2 (0.3%) | 5 (0.9%) |
| Total | 713 (100.0%) | 575 (100.0%) |
Families and Households in Millport
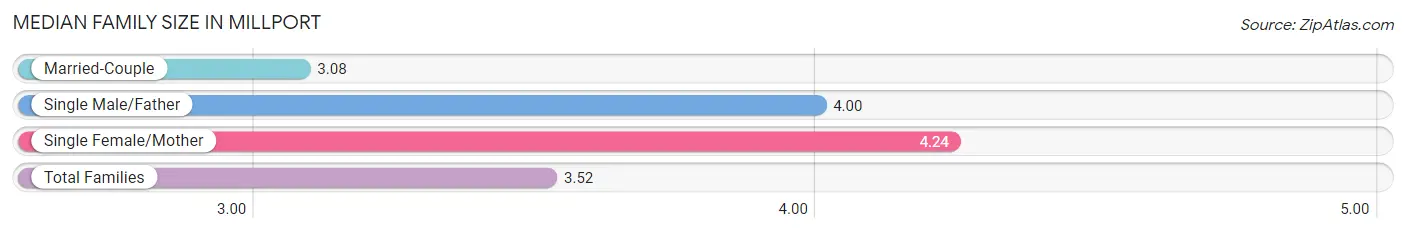
Median Family Size in Millport
The median family size in Millport is 3.52 persons per family, with single female/mother families (104 | 30.5%) accounting for the largest median family size of 4.24 persons per family. On the other hand, married-couple families (206 | 60.4%) represent the smallest median family size with 3.08 persons per family.
| Family Type | # Families | Family Size |
| Married-Couple | 206 (60.4%) | 3.08 |
| Single Male/Father | 31 (9.1%) | 4.00 |
| Single Female/Mother | 104 (30.5%) | 4.24 |
| Total Families | 341 (100.0%) | 3.52 |
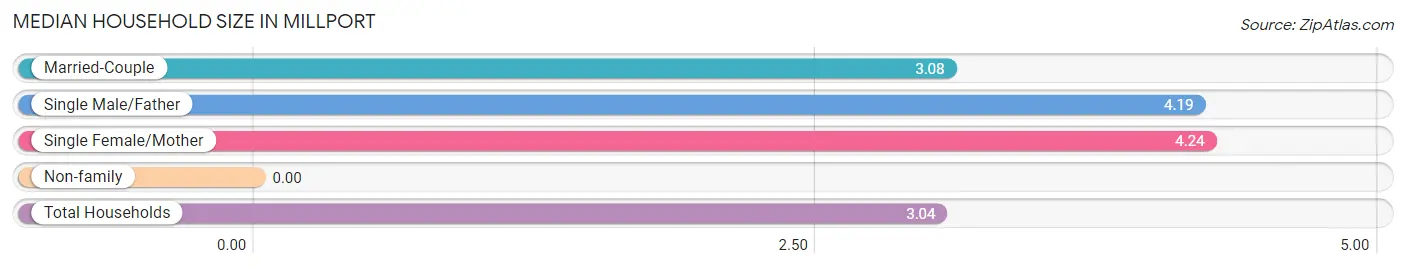
Median Household Size in Millport
| Household Type | # Households | Household Size |
| Married-Couple | 206 (48.6%) | 3.08 |
| Single Male/Father | 31 (7.3%) | 4.19 |
| Single Female/Mother | 104 (24.5%) | 4.24 |
| Non-family | 83 (19.6%) | - |
| Total Households | 424 (100.0%) | 3.04 |
Household Size by Marriage Status in Millport
Out of a total of 424 households in Millport, 341 (80.4%) are family households, while 83 (19.6%) are nonfamily households. The most numerous type of family households are 4-person households, comprising 128, and the most common type of nonfamily households are 1-person households, comprising 83.
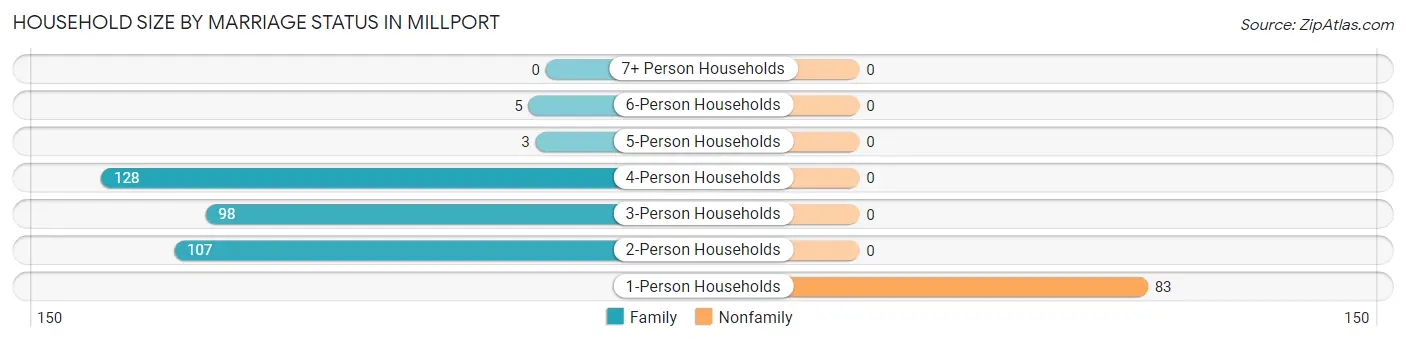
| Household Size | Family Households | Nonfamily Households |
| 1-Person Households | - | 83 (19.6%) |
| 2-Person Households | 107 (25.2%) | 0 (0.0%) |
| 3-Person Households | 98 (23.1%) | 0 (0.0%) |
| 4-Person Households | 128 (30.2%) | 0 (0.0%) |
| 5-Person Households | 3 (0.7%) | 0 (0.0%) |
| 6-Person Households | 5 (1.2%) | 0 (0.0%) |
| 7+ Person Households | 0 (0.0%) | 0 (0.0%) |
| Total | 341 (80.4%) | 83 (19.6%) |
Female Fertility in Millport
Fertility by Age in Millport
Average fertility rate in Millport is 59.0 births per 1,000 women. Women in the age bracket of 20 to 34 years have the highest fertility rate with 134.0 births per 1,000 women. Women in the age bracket of 20 to 34 years acount for 100.0% of all women with births.
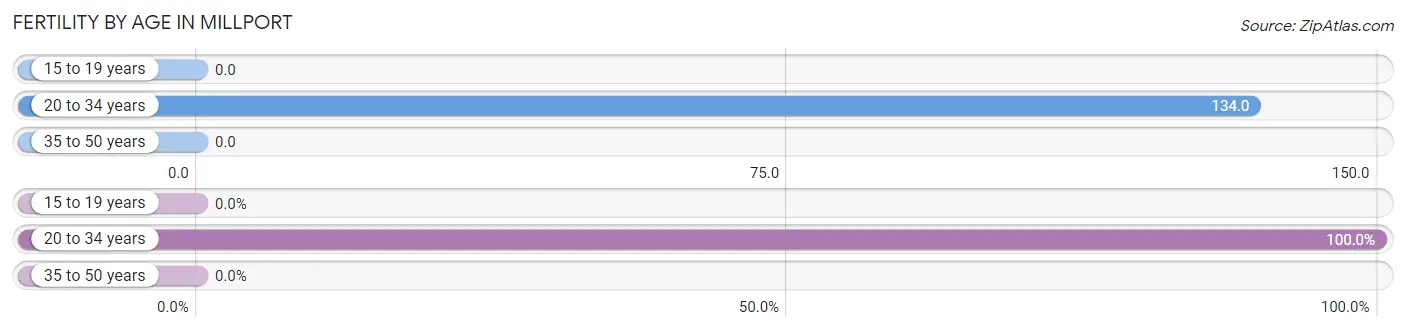
| Age Bracket | Women with Births | Births / 1,000 Women |
| 15 to 19 years | 0 (0.0%) | 0.0 |
| 20 to 34 years | 18 (100.0%) | 134.0 |
| 35 to 50 years | 0 (0.0%) | 0.0 |
| Total | 18 (100.0%) | 59.0 |
Fertility by Age by Marriage Status in Millport
61.1% of women with births (18) in Millport are married. The highest percentage of unmarried women with births falls into 20 to 34 years age bracket with 38.9% of them unmarried at the time of birth, while the lowest percentage of unmarried women with births belong to 20 to 34 years age bracket with 38.9% of them unmarried.
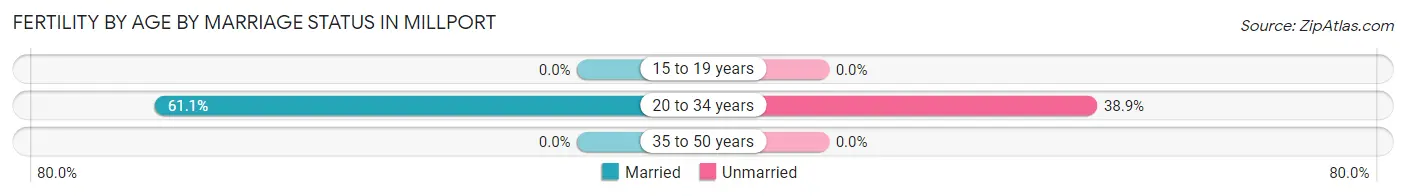
| Age Bracket | Married | Unmarried |
| 15 to 19 years | 0 (0.0%) | 0 (0.0%) |
| 20 to 34 years | 11 (61.1%) | 7 (38.9%) |
| 35 to 50 years | 0 (0.0%) | 0 (0.0%) |
| Total | 11 (61.1%) | 7 (38.9%) |
Fertility by Education in Millport
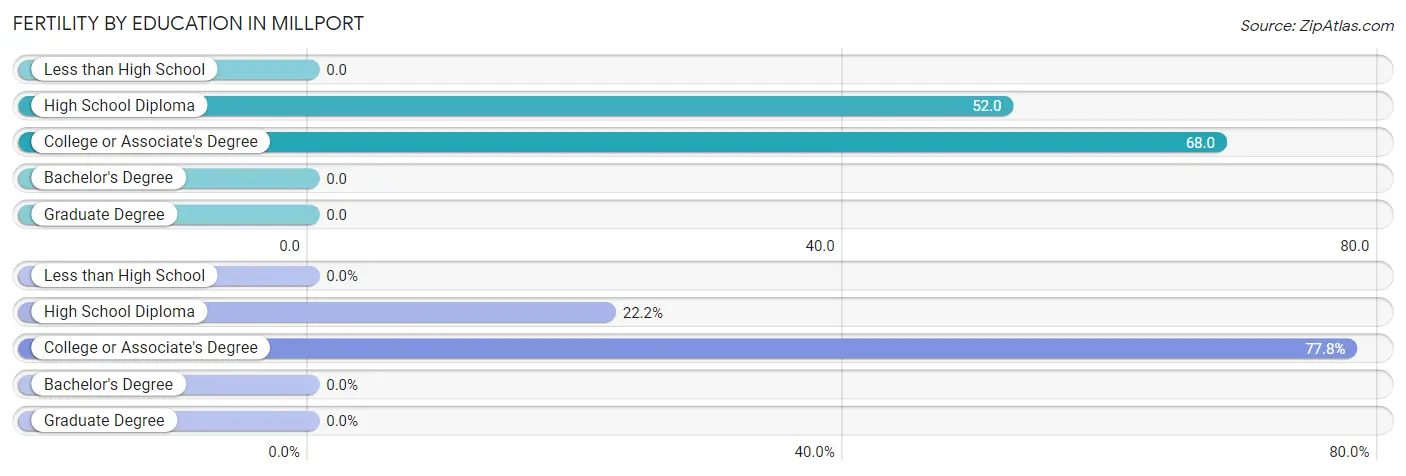
| Educational Attainment | Women with Births | Births / 1,000 Women |
| Less than High School | 0 (0.0%) | 0.0 |
| High School Diploma | 4 (22.2%) | 52.0 |
| College or Associate's Degree | 14 (77.8%) | 68.0 |
| Bachelor's Degree | 0 (0.0%) | 0.0 |
| Graduate Degree | 0 (0.0%) | 0.0 |
| Total | 18 (100.0%) | 59.0 |
Fertility by Education by Marriage Status in Millport
38.9% of women with births in Millport are unmarried. Women with the educational attainment of college or associate's degree are most likely to be married with 78.6% of them married at childbirth, while women with the educational attainment of high school diploma are least likely to be married with 100.0% of them unmarried at childbirth.
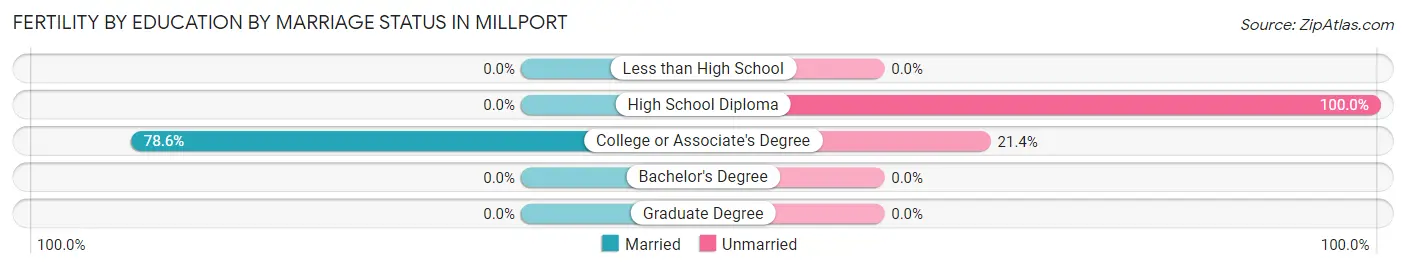
| Educational Attainment | Married | Unmarried |
| Less than High School | 0 (0.0%) | 0 (0.0%) |
| High School Diploma | 0 (0.0%) | 4 (100.0%) |
| College or Associate's Degree | 11 (78.6%) | 3 (21.4%) |
| Bachelor's Degree | 0 (0.0%) | 0 (0.0%) |
| Graduate Degree | 0 (0.0%) | 0 (0.0%) |
| Total | 11 (61.1%) | 7 (38.9%) |
Employment Characteristics in Millport
Employment by Class of Employer in Millport
Among the 488 employed individuals in Millport, private company employees (328 | 67.2%), state government employees (67 | 13.7%), and not-for-profit organizations (59 | 12.1%) make up the most common classes of employment.
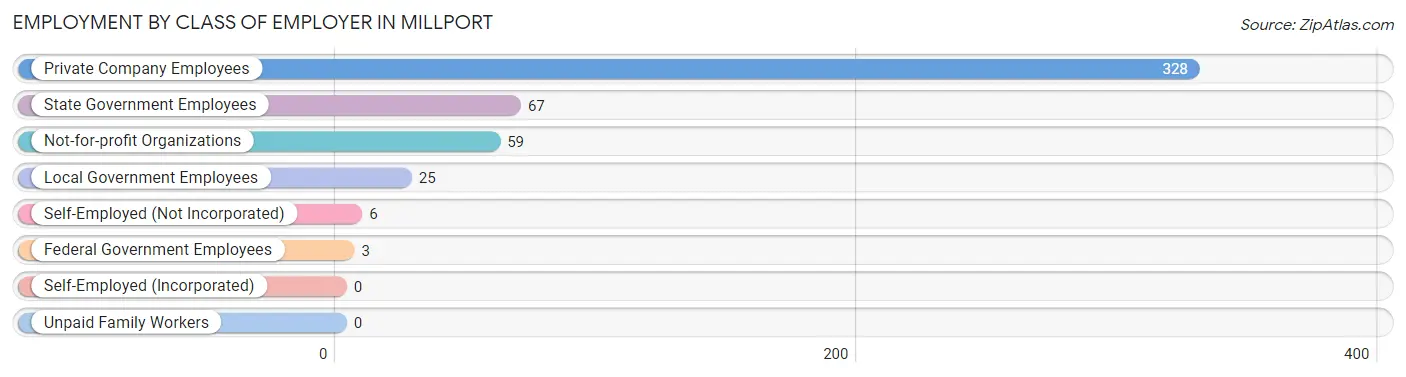
| Employer Class | # Employees | % Employees |
| Private Company Employees | 328 | 67.2% |
| Self-Employed (Incorporated) | 0 | 0.0% |
| Self-Employed (Not Incorporated) | 6 | 1.2% |
| Not-for-profit Organizations | 59 | 12.1% |
| Local Government Employees | 25 | 5.1% |
| State Government Employees | 67 | 13.7% |
| Federal Government Employees | 3 | 0.6% |
| Unpaid Family Workers | 0 | 0.0% |
| Total | 488 | 100.0% |
Employment Status by Age in Millport
According to the labor force statistics for Millport, out of the total population over 16 years of age (966), 61.8% or 597 individuals are in the labor force, with 1.5% or 9 of them unemployed. The age group with the highest labor force participation rate is 30 to 34 years, with 100.0% or 48 individuals in the labor force. Within the labor force, the 25 to 29 years age range has the highest percentage of unemployed individuals, with 36.0% or 9 of them being unemployed.
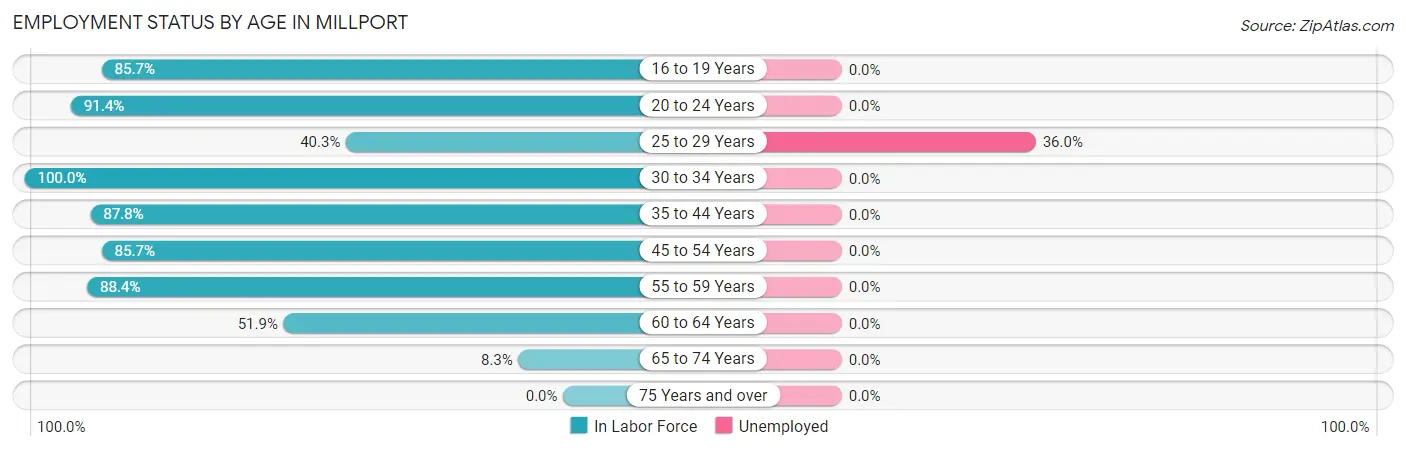
| Age Bracket | In Labor Force | Unemployed |
| 16 to 19 Years | 24 (85.7%) | 0 (0.0%) |
| 20 to 24 Years | 96 (91.4%) | 0 (0.0%) |
| 25 to 29 Years | 25 (40.3%) | 9 (36.0%) |
| 30 to 34 Years | 48 (100.0%) | 0 (0.0%) |
| 35 to 44 Years | 202 (87.8%) | 0 (0.0%) |
| 45 to 54 Years | 120 (85.7%) | 0 (0.0%) |
| 55 to 59 Years | 38 (88.4%) | 0 (0.0%) |
| 60 to 64 Years | 27 (51.9%) | 0 (0.0%) |
| 65 to 74 Years | 17 (8.3%) | 0 (0.0%) |
| 75 Years and over | 0 (0.0%) | 0 (0.0%) |
| Total | 597 (61.8%) | 9 (1.5%) |
Employment Status by Educational Attainment in Millport
According to labor force statistics for Millport, 80.0% of individuals (460) out of the total population between 25 and 64 years of age (575) are in the labor force, with 2.0% or 9 of them being unemployed. The group with the highest labor force participation rate are those with the educational attainment of college / associate degree, with 96.0% or 261 individuals in the labor force. Within the labor force, individuals with college / associate degree education have the highest percentage of unemployment, with 3.4% or 9 of them being unemployed.
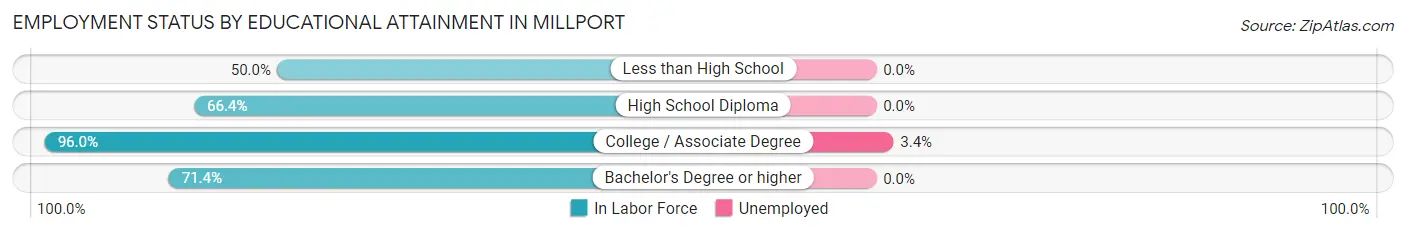
| Educational Attainment | In Labor Force | Unemployed |
| Less than High School | 14 (50.0%) | 0 (0.0%) |
| High School Diploma | 150 (66.4%) | 0 (0.0%) |
| College / Associate Degree | 261 (96.0%) | 9 (3.4%) |
| Bachelor's Degree or higher | 35 (71.4%) | 0 (0.0%) |
| Total | 460 (80.0%) | 12 (2.0%) |
Employment Occupations by Sex in Millport
Management, Business, Science and Arts Occupations
The most common Management, Business, Science and Arts occupations in Millport are Community & Social Service (51 | 8.7%), Education Instruction & Library (48 | 8.2%), Health Diagnosing & Treating (45 | 7.6%), Management (29 | 4.9%), and Health Technologists (28 | 4.8%).
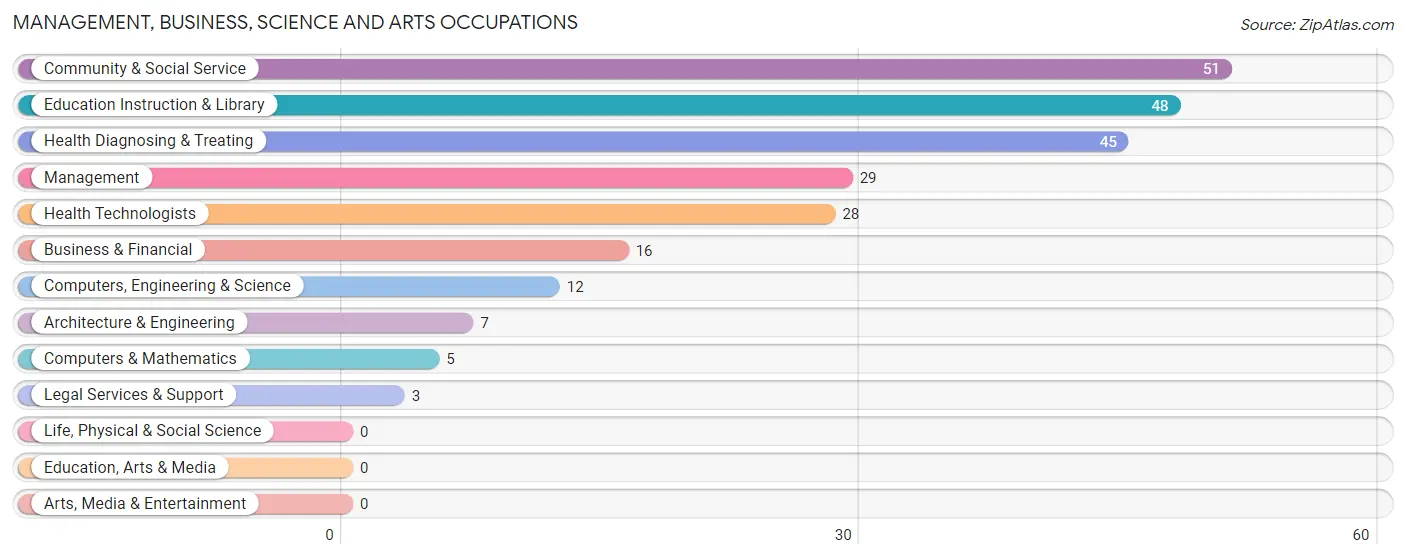
Management, Business, Science and Arts Occupations by Sex
Within the Management, Business, Science and Arts occupations in Millport, the most male-oriented occupations are Computers, Engineering & Science (100.0%), Computers & Mathematics (100.0%), and Architecture & Engineering (100.0%), while the most female-oriented occupations are Health Diagnosing & Treating (100.0%), Health Technologists (100.0%), and Management (62.1%).
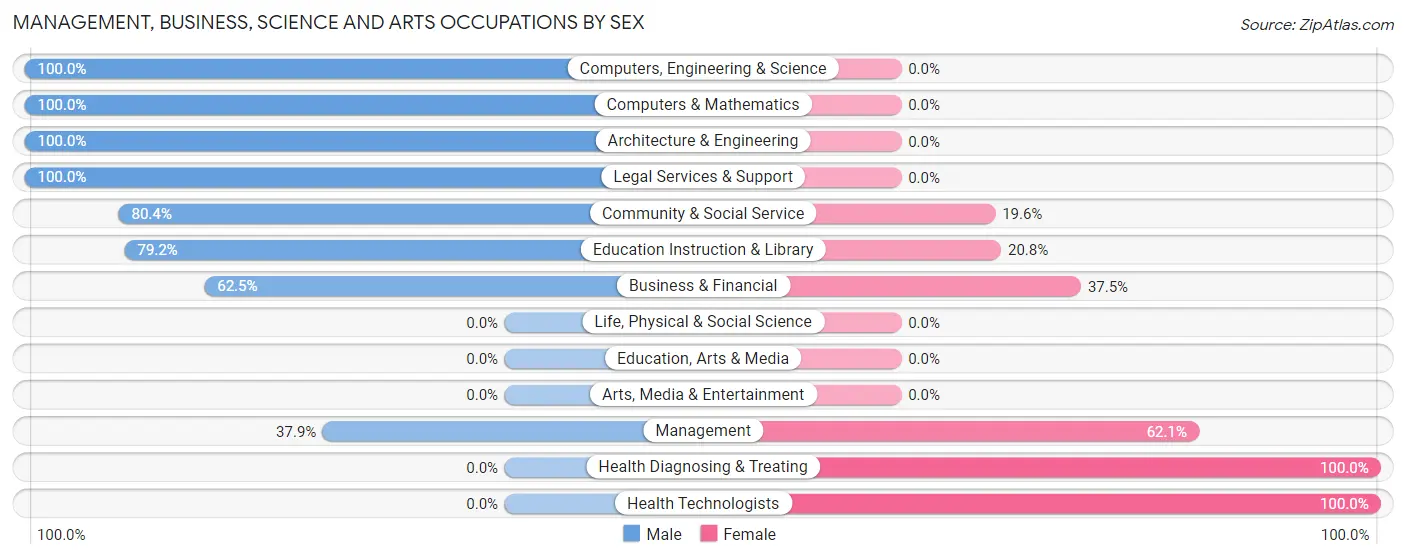
| Occupation | Male | Female |
| Management | 11 (37.9%) | 18 (62.1%) |
| Business & Financial | 10 (62.5%) | 6 (37.5%) |
| Computers, Engineering & Science | 12 (100.0%) | 0 (0.0%) |
| Computers & Mathematics | 5 (100.0%) | 0 (0.0%) |
| Architecture & Engineering | 7 (100.0%) | 0 (0.0%) |
| Life, Physical & Social Science | 0 (0.0%) | 0 (0.0%) |
| Community & Social Service | 41 (80.4%) | 10 (19.6%) |
| Education, Arts & Media | 0 (0.0%) | 0 (0.0%) |
| Legal Services & Support | 3 (100.0%) | 0 (0.0%) |
| Education Instruction & Library | 38 (79.2%) | 10 (20.8%) |
| Arts, Media & Entertainment | 0 (0.0%) | 0 (0.0%) |
| Health Diagnosing & Treating | 0 (0.0%) | 45 (100.0%) |
| Health Technologists | 0 (0.0%) | 28 (100.0%) |
| Total (Category) | 74 (48.4%) | 79 (51.6%) |
| Total (Overall) | 286 (48.6%) | 302 (51.4%) |
Services Occupations
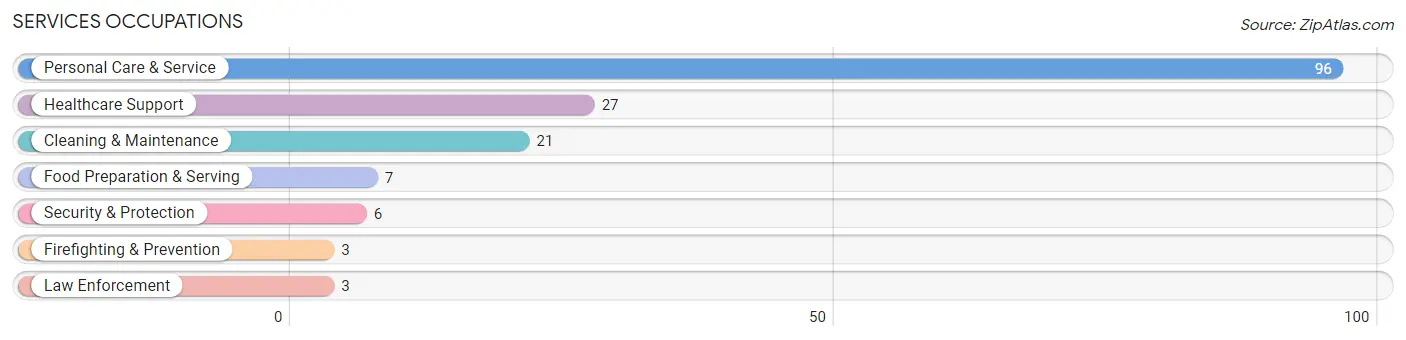
The most common Services occupations in Millport are Personal Care & Service (96 | 16.3%), Healthcare Support (27 | 4.6%), Cleaning & Maintenance (21 | 3.6%), Food Preparation & Serving (7 | 1.2%), and Security & Protection (6 | 1.0%).
Services Occupations by Sex
Within the Services occupations in Millport, the most male-oriented occupations are Security & Protection (100.0%), Firefighting & Prevention (100.0%), and Law Enforcement (100.0%), while the most female-oriented occupations are Healthcare Support (100.0%), Food Preparation & Serving (100.0%), and Personal Care & Service (100.0%).
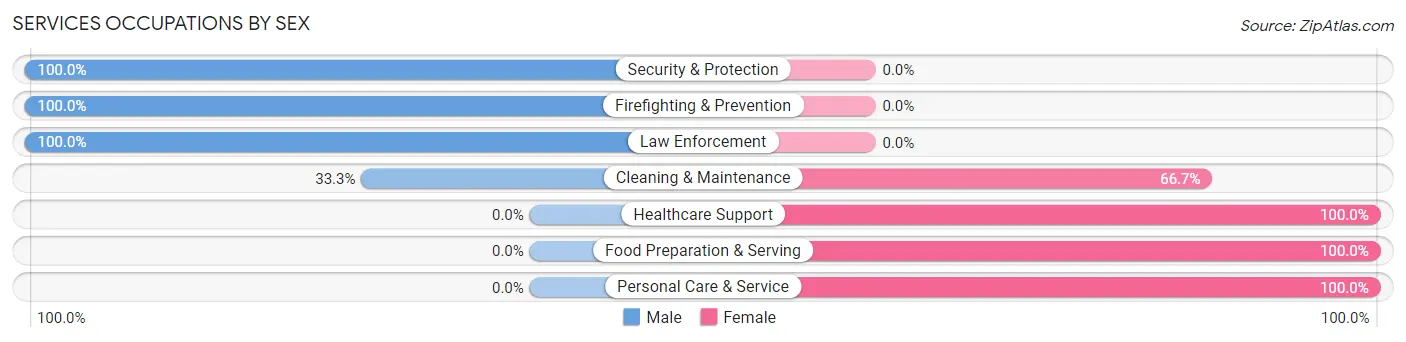
| Occupation | Male | Female |
| Healthcare Support | 0 (0.0%) | 27 (100.0%) |
| Security & Protection | 6 (100.0%) | 0 (0.0%) |
| Firefighting & Prevention | 3 (100.0%) | 0 (0.0%) |
| Law Enforcement | 3 (100.0%) | 0 (0.0%) |
| Food Preparation & Serving | 0 (0.0%) | 7 (100.0%) |
| Cleaning & Maintenance | 7 (33.3%) | 14 (66.7%) |
| Personal Care & Service | 0 (0.0%) | 96 (100.0%) |
| Total (Category) | 13 (8.3%) | 144 (91.7%) |
| Total (Overall) | 286 (48.6%) | 302 (51.4%) |
Sales and Office Occupations
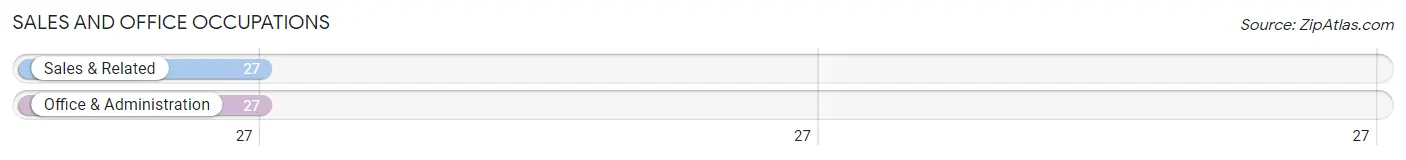
The most common Sales and Office occupations in Millport are Sales & Related (27 | 4.6%), and Office & Administration (27 | 4.6%).
Sales and Office Occupations by Sex

| Occupation | Male | Female |
| Sales & Related | 0 (0.0%) | 27 (100.0%) |
| Office & Administration | 8 (29.6%) | 19 (70.4%) |
| Total (Category) | 8 (14.8%) | 46 (85.2%) |
| Total (Overall) | 286 (48.6%) | 302 (51.4%) |
Natural Resources, Construction and Maintenance Occupations
The most common Natural Resources, Construction and Maintenance occupations in Millport are Installation, Maintenance & Repair (29 | 4.9%), and Construction & Extraction (9 | 1.5%).
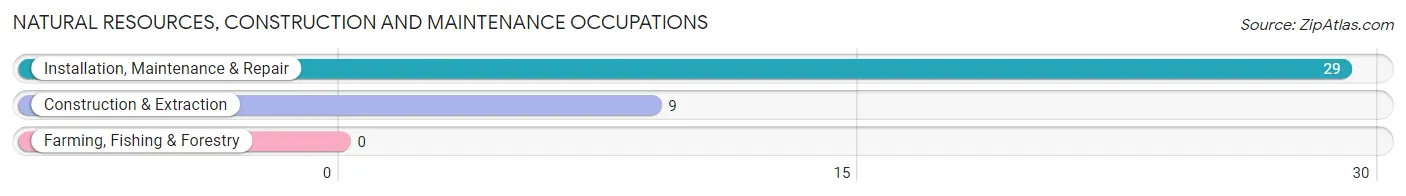
Natural Resources, Construction and Maintenance Occupations by Sex

| Occupation | Male | Female |
| Farming, Fishing & Forestry | 0 (0.0%) | 0 (0.0%) |
| Construction & Extraction | 9 (100.0%) | 0 (0.0%) |
| Installation, Maintenance & Repair | 29 (100.0%) | 0 (0.0%) |
| Total (Category) | 38 (100.0%) | 0 (0.0%) |
| Total (Overall) | 286 (48.6%) | 302 (51.4%) |
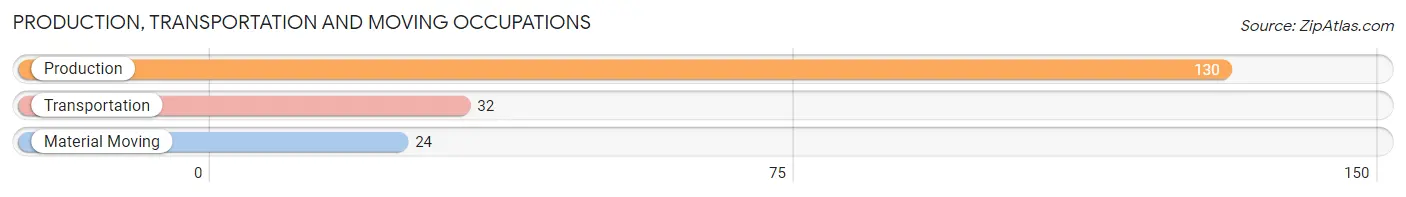
Production, Transportation and Moving Occupations
The most common Production, Transportation and Moving occupations in Millport are Production (130 | 22.1%), Transportation (32 | 5.4%), and Material Moving (24 | 4.1%).
Production, Transportation and Moving Occupations by Sex
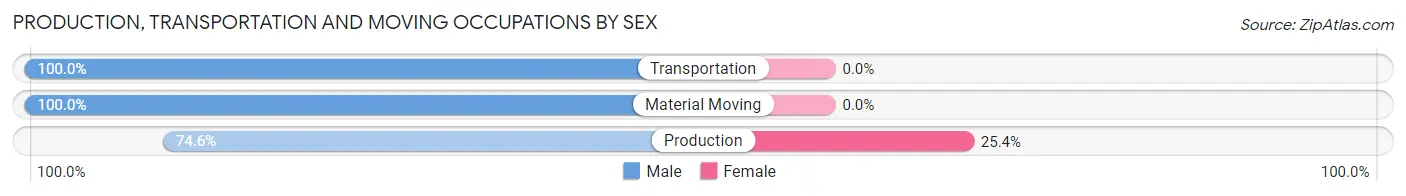
| Occupation | Male | Female |
| Production | 97 (74.6%) | 33 (25.4%) |
| Transportation | 32 (100.0%) | 0 (0.0%) |
| Material Moving | 24 (100.0%) | 0 (0.0%) |
| Total (Category) | 153 (82.3%) | 33 (17.7%) |
| Total (Overall) | 286 (48.6%) | 302 (51.4%) |
Employment Industries by Sex in Millport
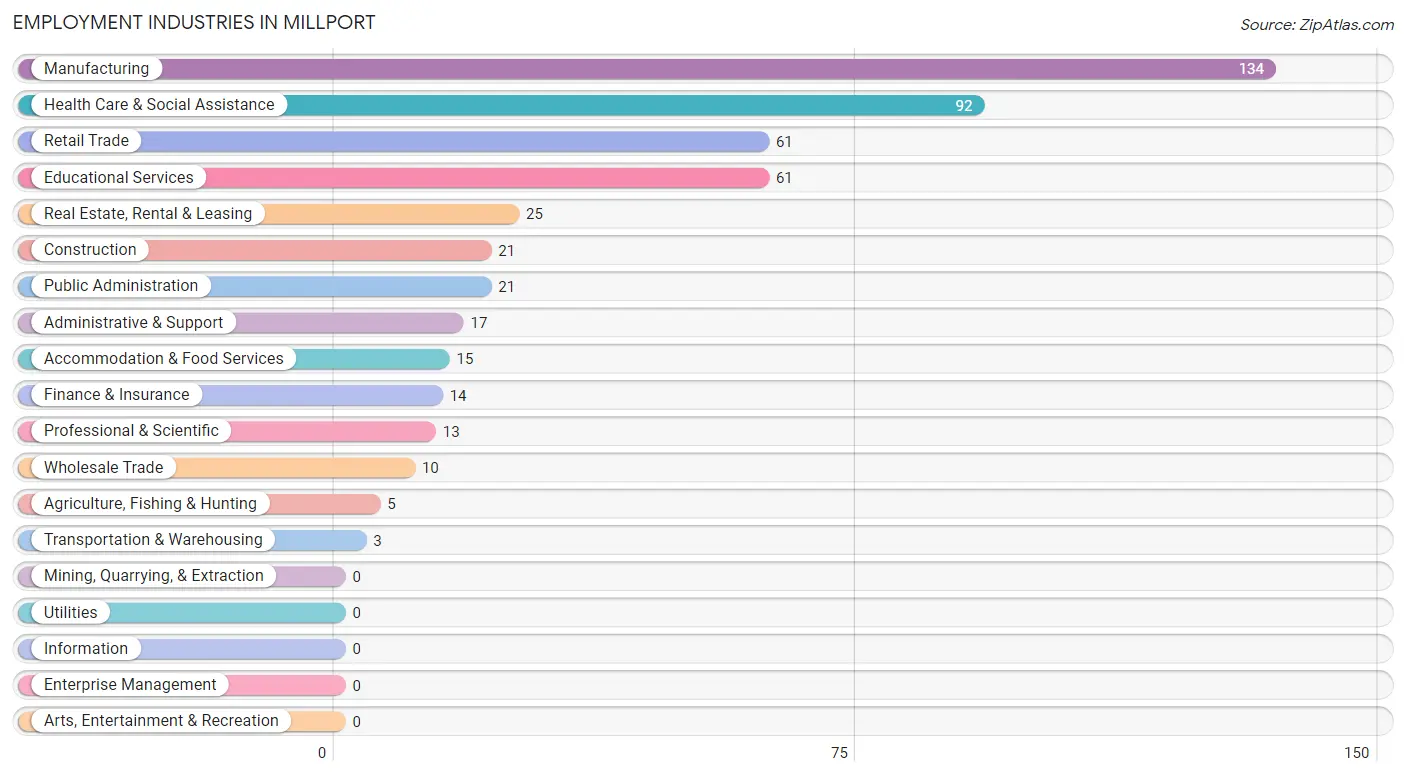
Employment Industries in Millport
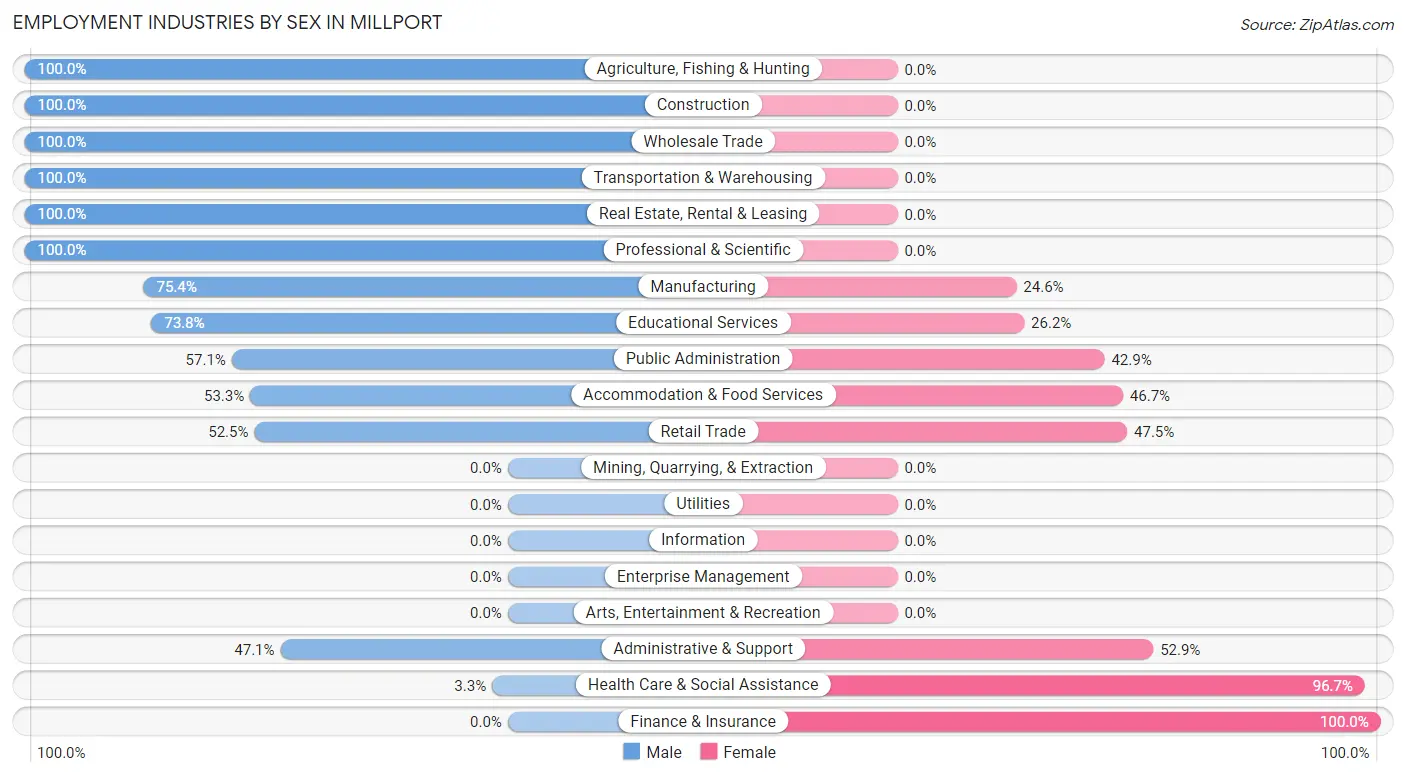
The major employment industries in Millport include Manufacturing (134 | 22.8%), Health Care & Social Assistance (92 | 15.7%), Retail Trade (61 | 10.4%), Educational Services (61 | 10.4%), and Real Estate, Rental & Leasing (25 | 4.3%).
Employment Industries by Sex in Millport
The Millport industries that see more men than women are Agriculture, Fishing & Hunting (100.0%), Construction (100.0%), and Wholesale Trade (100.0%), whereas the industries that tend to have a higher number of women are Finance & Insurance (100.0%), Health Care & Social Assistance (96.7%), and Administrative & Support (52.9%).
| Industry | Male | Female |
| Agriculture, Fishing & Hunting | 5 (100.0%) | 0 (0.0%) |
| Mining, Quarrying, & Extraction | 0 (0.0%) | 0 (0.0%) |
| Construction | 21 (100.0%) | 0 (0.0%) |
| Manufacturing | 101 (75.4%) | 33 (24.6%) |
| Wholesale Trade | 10 (100.0%) | 0 (0.0%) |
| Retail Trade | 32 (52.5%) | 29 (47.5%) |
| Transportation & Warehousing | 3 (100.0%) | 0 (0.0%) |
| Utilities | 0 (0.0%) | 0 (0.0%) |
| Information | 0 (0.0%) | 0 (0.0%) |
| Finance & Insurance | 0 (0.0%) | 14 (100.0%) |
| Real Estate, Rental & Leasing | 25 (100.0%) | 0 (0.0%) |
| Professional & Scientific | 13 (100.0%) | 0 (0.0%) |
| Enterprise Management | 0 (0.0%) | 0 (0.0%) |
| Administrative & Support | 8 (47.1%) | 9 (52.9%) |
| Educational Services | 45 (73.8%) | 16 (26.2%) |
| Health Care & Social Assistance | 3 (3.3%) | 89 (96.7%) |
| Arts, Entertainment & Recreation | 0 (0.0%) | 0 (0.0%) |
| Accommodation & Food Services | 8 (53.3%) | 7 (46.7%) |
| Public Administration | 12 (57.1%) | 9 (42.9%) |
| Total | 286 (48.6%) | 302 (51.4%) |
Education in Millport
School Enrollment in Millport
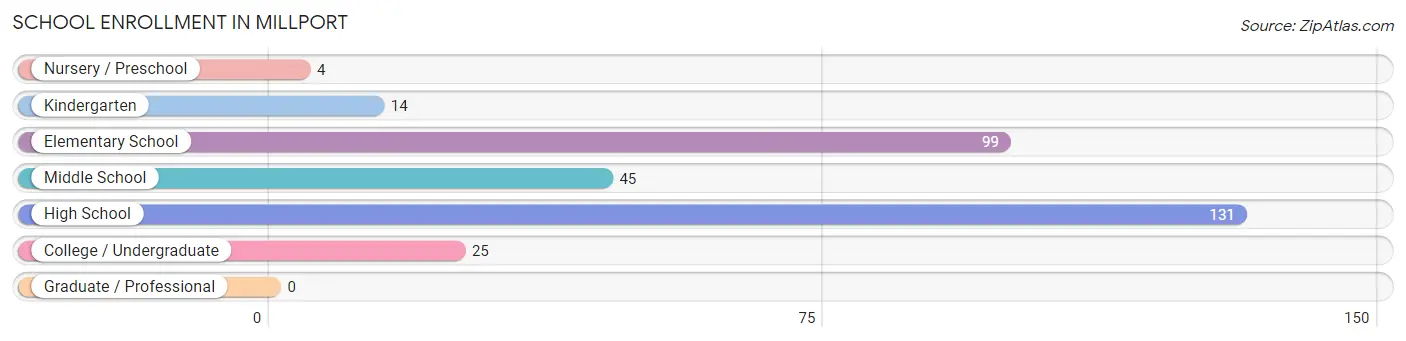
The most common levels of schooling among the 318 students in Millport are high school (131 | 41.2%), elementary school (99 | 31.1%), and middle school (45 | 14.1%).
| School Level | # Students | % Students |
| Nursery / Preschool | 4 | 1.3% |
| Kindergarten | 14 | 4.4% |
| Elementary School | 99 | 31.1% |
| Middle School | 45 | 14.1% |
| High School | 131 | 41.2% |
| College / Undergraduate | 25 | 7.9% |
| Graduate / Professional | 0 | 0.0% |
| Total | 318 | 100.0% |
School Enrollment by Age by Funding Source in Millport
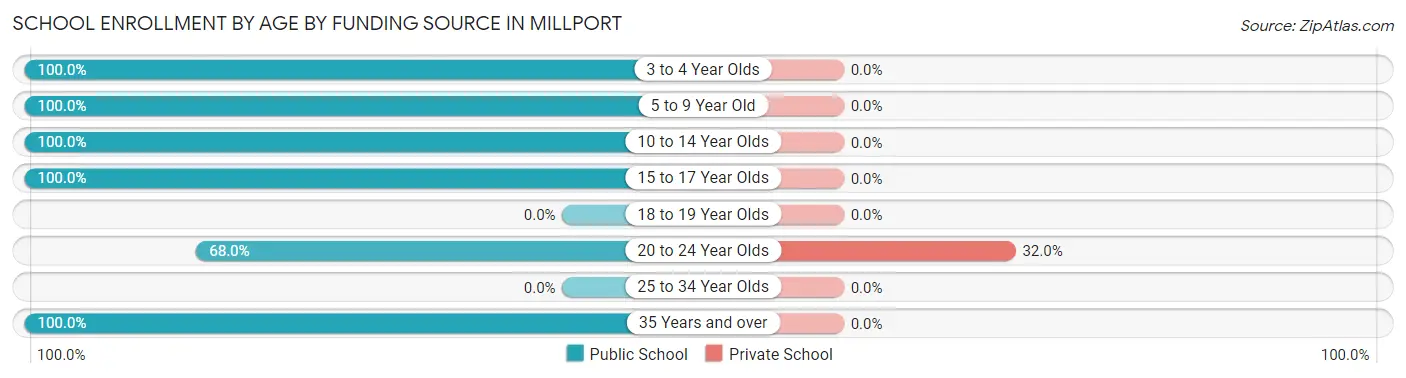
Out of a total of 318 students who are enrolled in schools in Millport, 8 (2.5%) attend a private institution, while the remaining 310 (97.5%) are enrolled in public schools. The age group of 20 to 24 year olds has the highest likelihood of being enrolled in private schools, with 8 (32.0% in the age bracket) enrolled. Conversely, the age group of 3 to 4 year olds has the lowest likelihood of being enrolled in a private school, with 4 (100.0% in the age bracket) attending a public institution.
| Age Bracket | Public School | Private School |
| 3 to 4 Year Olds | 4 (100.0%) | 0 (0.0%) |
| 5 to 9 Year Old | 107 (100.0%) | 0 (0.0%) |
| 10 to 14 Year Olds | 57 (100.0%) | 0 (0.0%) |
| 15 to 17 Year Olds | 122 (100.0%) | 0 (0.0%) |
| 18 to 19 Year Olds | 0 (0.0%) | 0 (0.0%) |
| 20 to 24 Year Olds | 17 (68.0%) | 8 (32.0%) |
| 25 to 34 Year Olds | 0 (0.0%) | 0 (0.0%) |
| 35 Years and over | 3 (100.0%) | 0 (0.0%) |
| Total | 310 (97.5%) | 8 (2.5%) |
Educational Attainment by Field of Study in Millport
Science & technology (19 | 35.8%), bio, nature & agricultural (14 | 26.4%), arts & humanities (13 | 24.5%), business (4 | 7.5%), and psychology (3 | 5.7%) are the most common fields of study among 53 individuals in Millport who have obtained a bachelor's degree or higher.
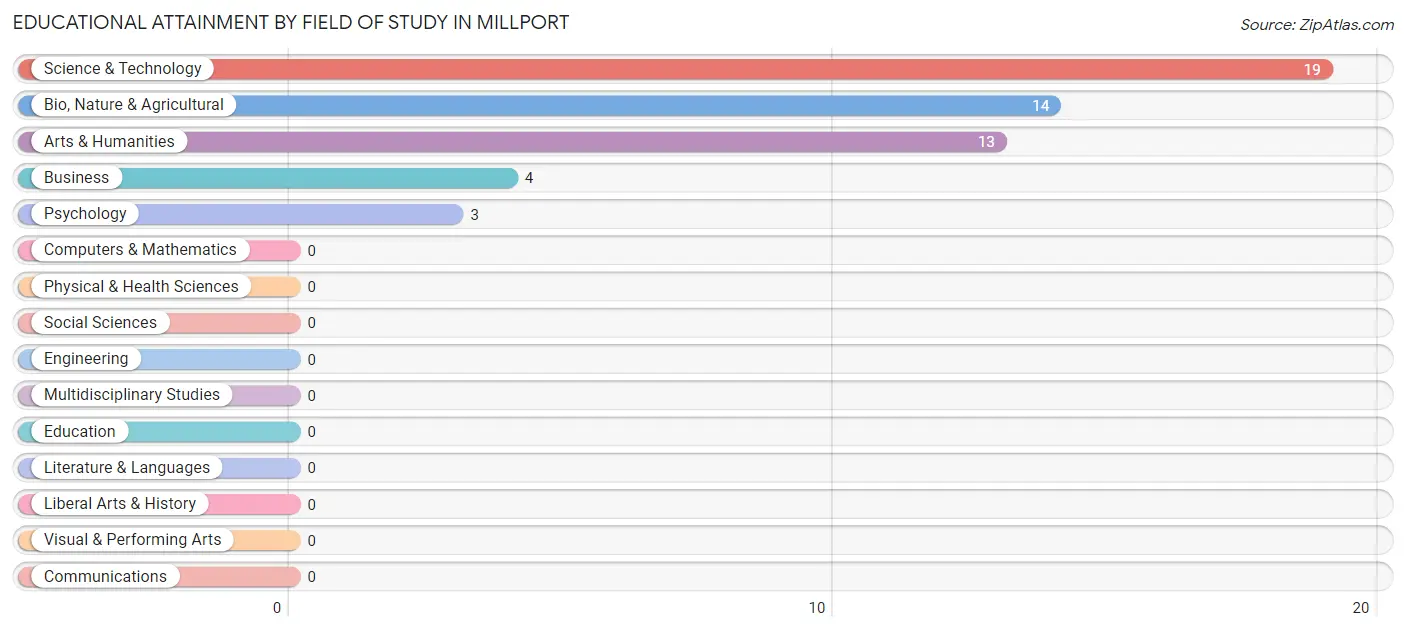
| Field of Study | # Graduates | % Graduates |
| Computers & Mathematics | 0 | 0.0% |
| Bio, Nature & Agricultural | 14 | 26.4% |
| Physical & Health Sciences | 0 | 0.0% |
| Psychology | 3 | 5.7% |
| Social Sciences | 0 | 0.0% |
| Engineering | 0 | 0.0% |
| Multidisciplinary Studies | 0 | 0.0% |
| Science & Technology | 19 | 35.8% |
| Business | 4 | 7.5% |
| Education | 0 | 0.0% |
| Literature & Languages | 0 | 0.0% |
| Liberal Arts & History | 0 | 0.0% |
| Visual & Performing Arts | 0 | 0.0% |
| Communications | 0 | 0.0% |
| Arts & Humanities | 13 | 24.5% |
| Total | 53 | 100.0% |
Transportation & Commute in Millport
Vehicle Availability by Sex in Millport
The most prevalent vehicle ownership categories in Millport are males with 2 vehicles (113, accounting for 39.5%) and females with 2 vehicles (74, making up 55.9%).
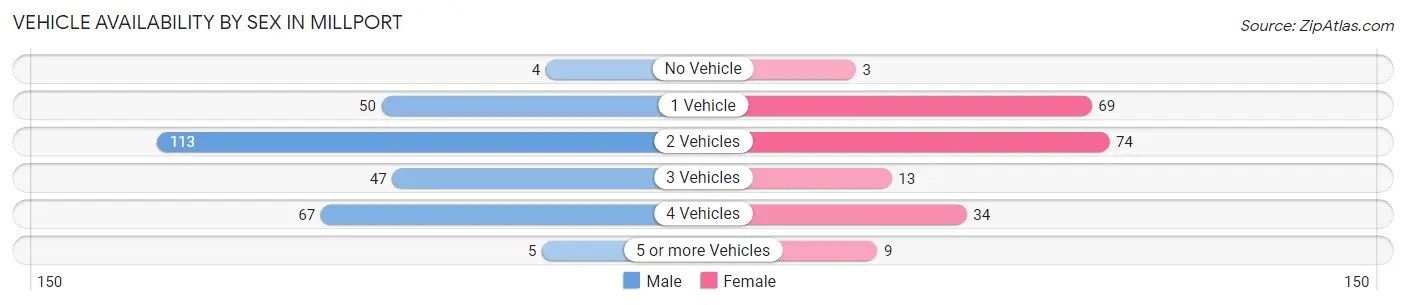
| Vehicles Available | Male | Female |
| No Vehicle | 4 (1.4%) | 3 (1.5%) |
| 1 Vehicle | 50 (17.5%) | 69 (34.2%) |
| 2 Vehicles | 113 (39.5%) | 74 (36.6%) |
| 3 Vehicles | 47 (16.4%) | 13 (6.4%) |
| 4 Vehicles | 67 (23.4%) | 34 (16.8%) |
| 5 or more Vehicles | 5 (1.8%) | 9 (4.5%) |
| Total | 286 (100.0%) | 202 (100.0%) |
Commute Time in Millport
The most frequently occuring commute durations in Millport are 5 to 9 minutes (81 commuters, 16.6%), 30 to 34 minutes (74 commuters, 15.2%), and 60 to 89 minutes (73 commuters, 15.0%).
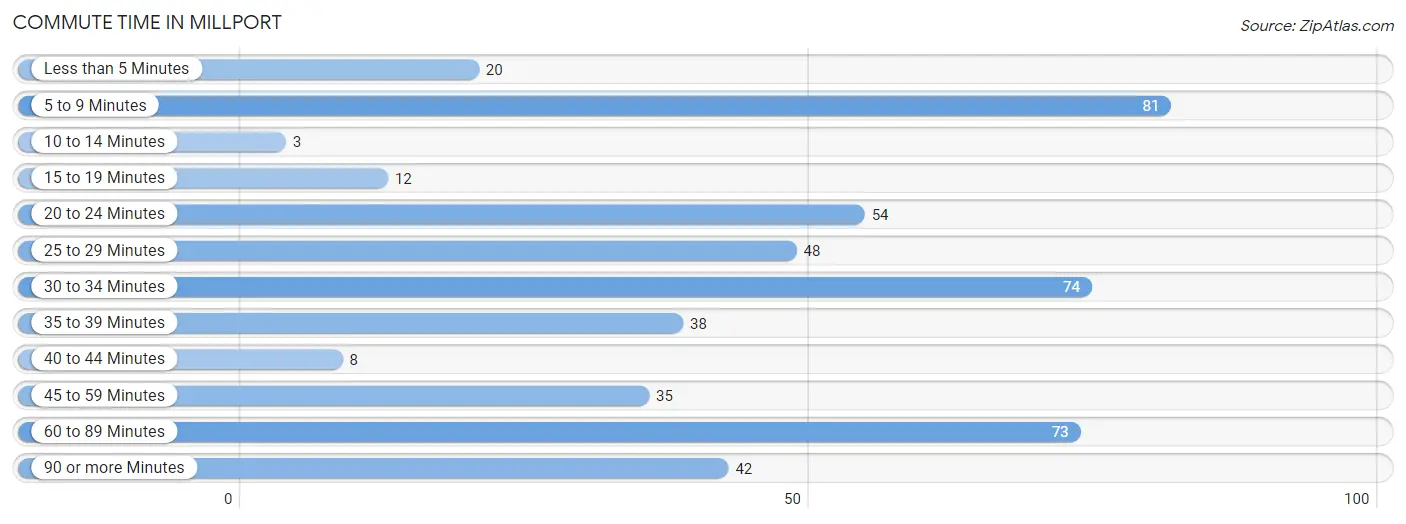
| Commute Time | # Commuters | % Commuters |
| Less than 5 Minutes | 20 | 4.1% |
| 5 to 9 Minutes | 81 | 16.6% |
| 10 to 14 Minutes | 3 | 0.6% |
| 15 to 19 Minutes | 12 | 2.5% |
| 20 to 24 Minutes | 54 | 11.1% |
| 25 to 29 Minutes | 48 | 9.8% |
| 30 to 34 Minutes | 74 | 15.2% |
| 35 to 39 Minutes | 38 | 7.8% |
| 40 to 44 Minutes | 8 | 1.6% |
| 45 to 59 Minutes | 35 | 7.2% |
| 60 to 89 Minutes | 73 | 15.0% |
| 90 or more Minutes | 42 | 8.6% |
Commute Time by Sex in Millport
The most common commute times in Millport are 60 to 89 minutes (73 commuters, 25.5%) for males and 30 to 34 minutes (57 commuters, 28.2%) for females.
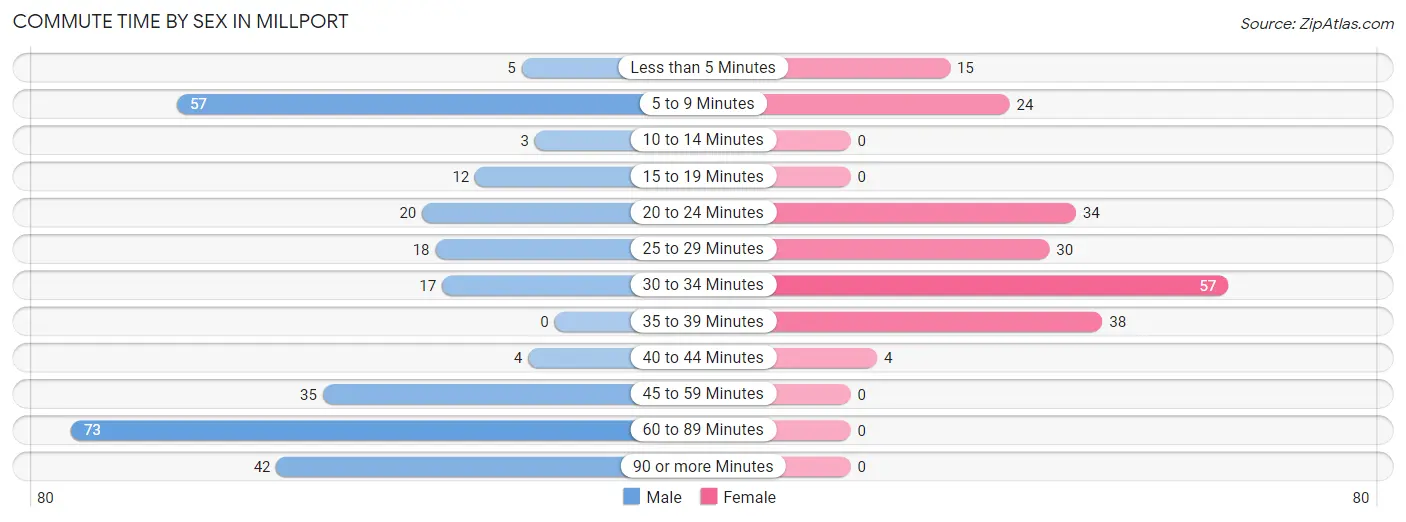
| Commute Time | Male | Female |
| Less than 5 Minutes | 5 (1.8%) | 15 (7.4%) |
| 5 to 9 Minutes | 57 (19.9%) | 24 (11.9%) |
| 10 to 14 Minutes | 3 (1.1%) | 0 (0.0%) |
| 15 to 19 Minutes | 12 (4.2%) | 0 (0.0%) |
| 20 to 24 Minutes | 20 (7.0%) | 34 (16.8%) |
| 25 to 29 Minutes | 18 (6.3%) | 30 (14.8%) |
| 30 to 34 Minutes | 17 (5.9%) | 57 (28.2%) |
| 35 to 39 Minutes | 0 (0.0%) | 38 (18.8%) |
| 40 to 44 Minutes | 4 (1.4%) | 4 (2.0%) |
| 45 to 59 Minutes | 35 (12.2%) | 0 (0.0%) |
| 60 to 89 Minutes | 73 (25.5%) | 0 (0.0%) |
| 90 or more Minutes | 42 (14.7%) | 0 (0.0%) |
Time of Departure to Work by Sex in Millport
The most frequent times of departure to work in Millport are 12:00 PM to 3:59 PM (66, 23.1%) for males and 12:00 PM to 3:59 PM (58, 28.7%) for females.
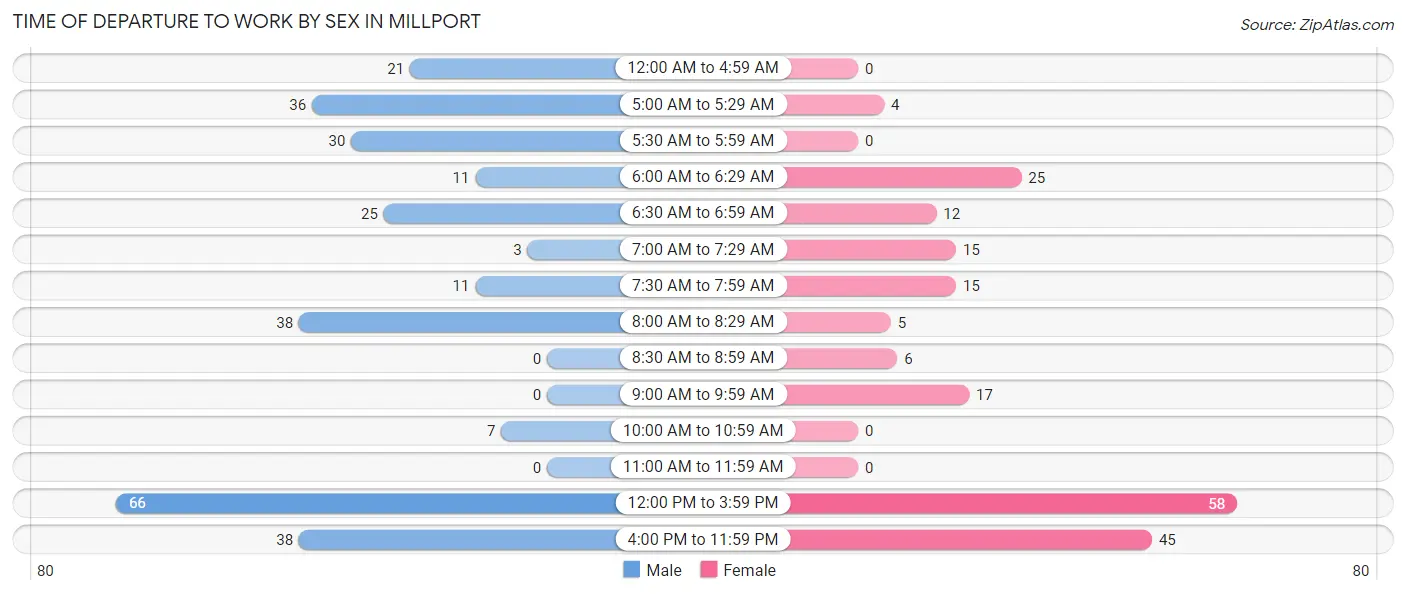
| Time of Departure | Male | Female |
| 12:00 AM to 4:59 AM | 21 (7.3%) | 0 (0.0%) |
| 5:00 AM to 5:29 AM | 36 (12.6%) | 4 (2.0%) |
| 5:30 AM to 5:59 AM | 30 (10.5%) | 0 (0.0%) |
| 6:00 AM to 6:29 AM | 11 (3.8%) | 25 (12.4%) |
| 6:30 AM to 6:59 AM | 25 (8.7%) | 12 (5.9%) |
| 7:00 AM to 7:29 AM | 3 (1.1%) | 15 (7.4%) |
| 7:30 AM to 7:59 AM | 11 (3.8%) | 15 (7.4%) |
| 8:00 AM to 8:29 AM | 38 (13.3%) | 5 (2.5%) |
| 8:30 AM to 8:59 AM | 0 (0.0%) | 6 (3.0%) |
| 9:00 AM to 9:59 AM | 0 (0.0%) | 17 (8.4%) |
| 10:00 AM to 10:59 AM | 7 (2.5%) | 0 (0.0%) |
| 11:00 AM to 11:59 AM | 0 (0.0%) | 0 (0.0%) |
| 12:00 PM to 3:59 PM | 66 (23.1%) | 58 (28.7%) |
| 4:00 PM to 11:59 PM | 38 (13.3%) | 45 (22.3%) |
| Total | 286 (100.0%) | 202 (100.0%) |
Housing Occupancy in Millport
Occupancy by Ownership in Millport
Of the total 424 dwellings in Millport, owner-occupied units account for 343 (80.9%), while renter-occupied units make up 81 (19.1%).
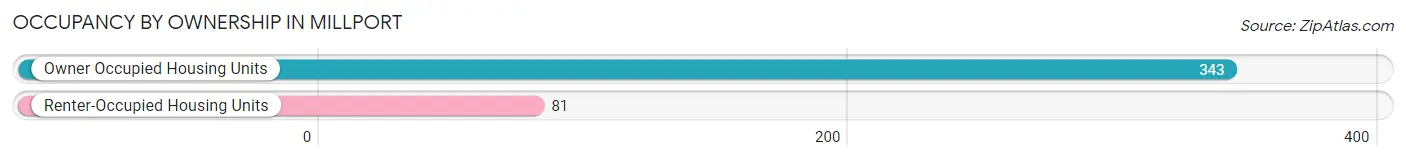
| Occupancy | # Housing Units | % Housing Units |
| Owner Occupied Housing Units | 343 | 80.9% |
| Renter-Occupied Housing Units | 81 | 19.1% |
| Total Occupied Housing Units | 424 | 100.0% |
Occupancy by Household Size in Millport
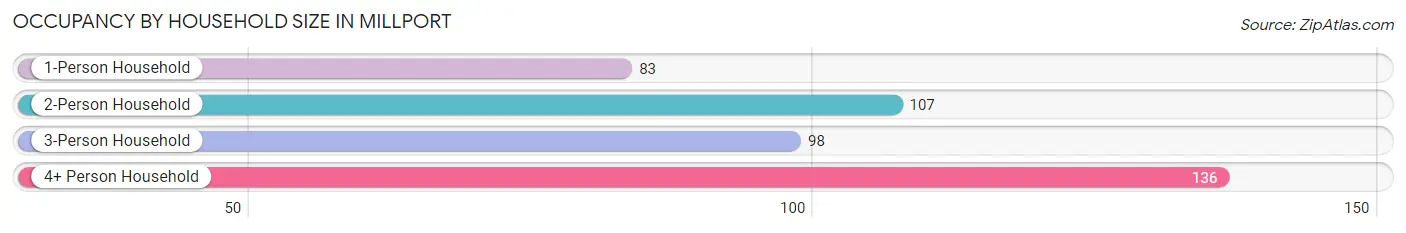
| Household Size | # Housing Units | % Housing Units |
| 1-Person Household | 83 | 19.6% |
| 2-Person Household | 107 | 25.2% |
| 3-Person Household | 98 | 23.1% |
| 4+ Person Household | 136 | 32.1% |
| Total Housing Units | 424 | 100.0% |
Occupancy by Ownership by Household Size in Millport
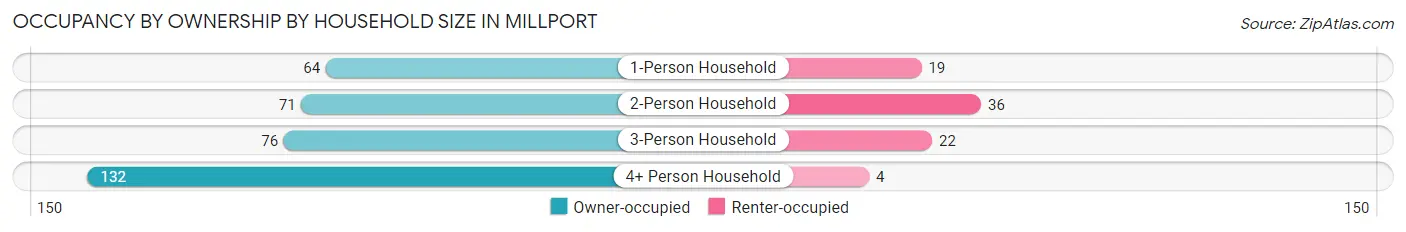
| Household Size | Owner-occupied | Renter-occupied |
| 1-Person Household | 64 (77.1%) | 19 (22.9%) |
| 2-Person Household | 71 (66.4%) | 36 (33.6%) |
| 3-Person Household | 76 (77.5%) | 22 (22.5%) |
| 4+ Person Household | 132 (97.1%) | 4 (2.9%) |
| Total Housing Units | 343 (80.9%) | 81 (19.1%) |
Occupancy by Educational Attainment in Millport
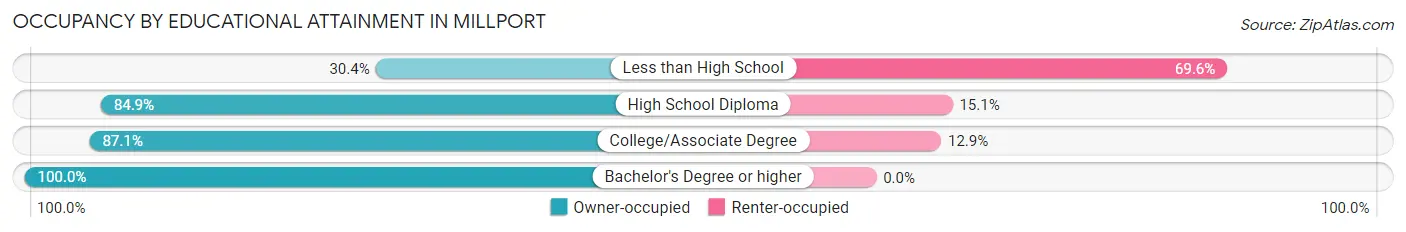
| Household Size | Owner-occupied | Renter-occupied |
| Less than High School | 14 (30.4%) | 32 (69.6%) |
| High School Diploma | 129 (84.9%) | 23 (15.1%) |
| College/Associate Degree | 176 (87.1%) | 26 (12.9%) |
| Bachelor's Degree or higher | 24 (100.0%) | 0 (0.0%) |
Occupancy by Age of Householder in Millport
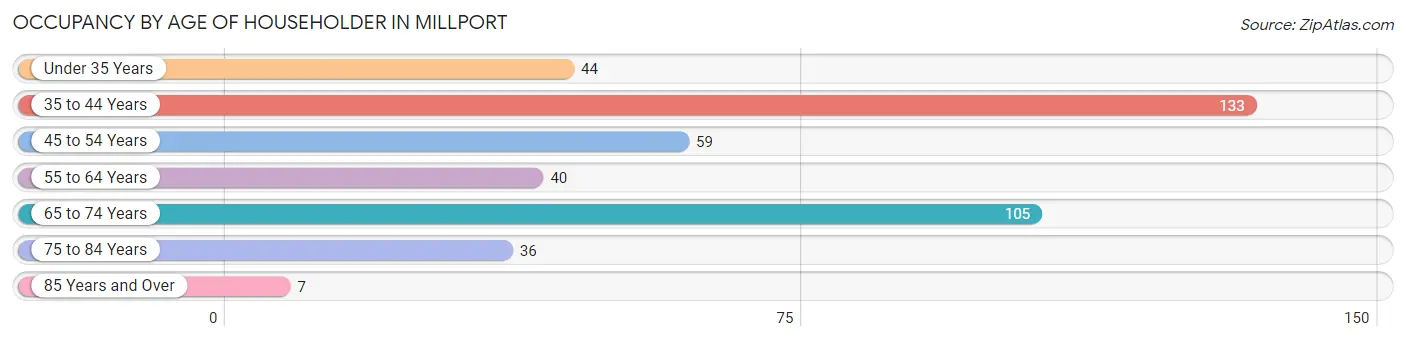
| Age Bracket | # Households | % Households |
| Under 35 Years | 44 | 10.4% |
| 35 to 44 Years | 133 | 31.4% |
| 45 to 54 Years | 59 | 13.9% |
| 55 to 64 Years | 40 | 9.4% |
| 65 to 74 Years | 105 | 24.8% |
| 75 to 84 Years | 36 | 8.5% |
| 85 Years and Over | 7 | 1.7% |
| Total | 424 | 100.0% |
Housing Finances in Millport
Median Income by Occupancy in Millport
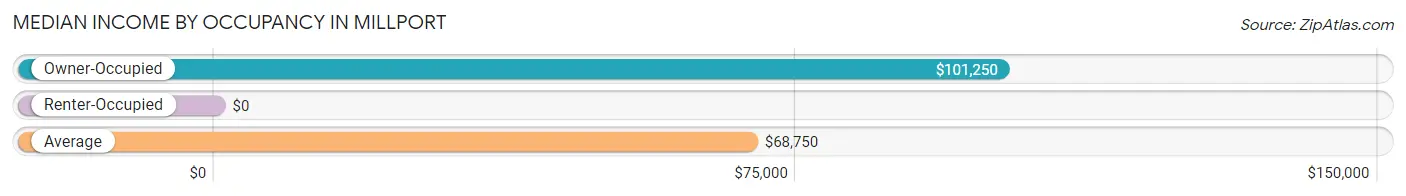
| Occupancy Type | # Households | Median Income |
| Owner-Occupied | 343 (80.9%) | $101,250 |
| Renter-Occupied | 81 (19.1%) | $0 |
| Average | 424 (100.0%) | $68,750 |
Occupancy by Householder Income Bracket in Millport
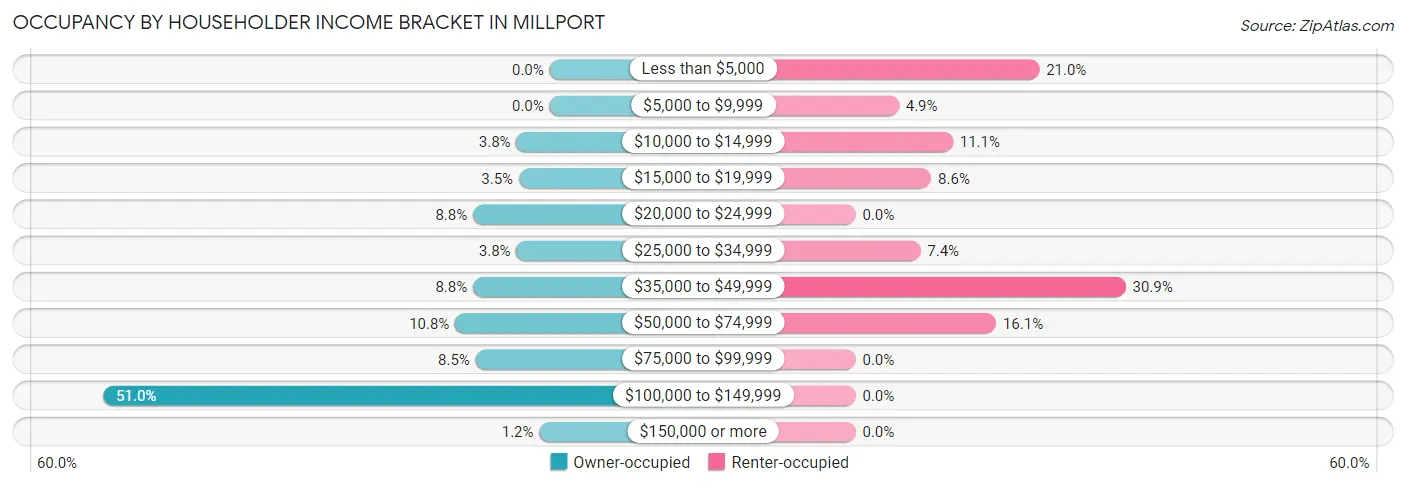
| Income Bracket | Owner-occupied | Renter-occupied |
| Less than $5,000 | 0 (0.0%) | 17 (21.0%) |
| $5,000 to $9,999 | 0 (0.0%) | 4 (4.9%) |
| $10,000 to $14,999 | 13 (3.8%) | 9 (11.1%) |
| $15,000 to $19,999 | 12 (3.5%) | 7 (8.6%) |
| $20,000 to $24,999 | 30 (8.7%) | 0 (0.0%) |
| $25,000 to $34,999 | 13 (3.8%) | 6 (7.4%) |
| $35,000 to $49,999 | 30 (8.7%) | 25 (30.9%) |
| $50,000 to $74,999 | 37 (10.8%) | 13 (16.1%) |
| $75,000 to $99,999 | 29 (8.5%) | 0 (0.0%) |
| $100,000 to $149,999 | 175 (51.0%) | 0 (0.0%) |
| $150,000 or more | 4 (1.2%) | 0 (0.0%) |
| Total | 343 (100.0%) | 81 (100.0%) |
Monthly Housing Cost Tiers in Millport
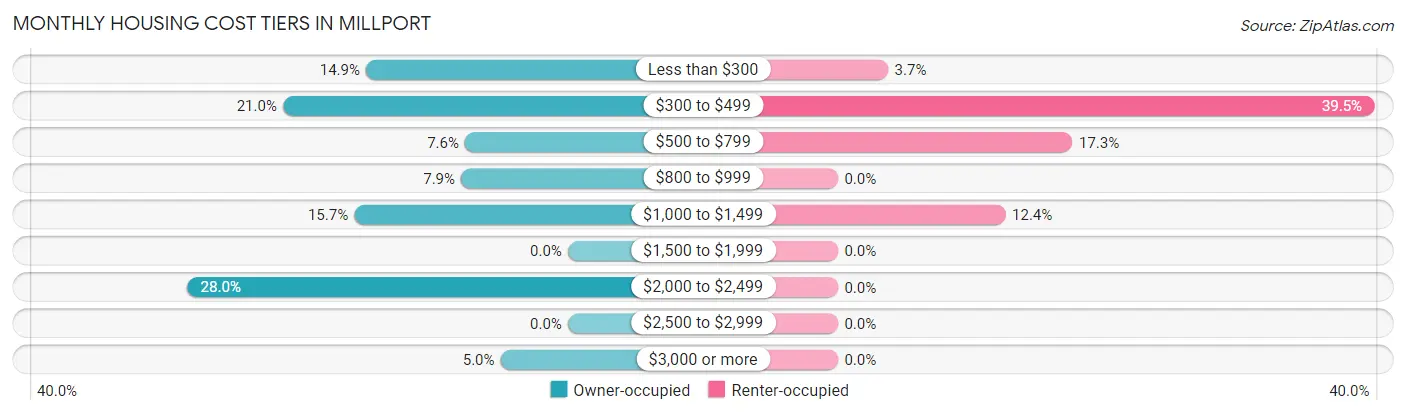
| Monthly Cost | Owner-occupied | Renter-occupied |
| Less than $300 | 51 (14.9%) | 3 (3.7%) |
| $300 to $499 | 72 (21.0%) | 32 (39.5%) |
| $500 to $799 | 26 (7.6%) | 14 (17.3%) |
| $800 to $999 | 27 (7.9%) | 0 (0.0%) |
| $1,000 to $1,499 | 54 (15.7%) | 10 (12.3%) |
| $1,500 to $1,999 | 0 (0.0%) | 0 (0.0%) |
| $2,000 to $2,499 | 96 (28.0%) | 0 (0.0%) |
| $2,500 to $2,999 | 0 (0.0%) | 0 (0.0%) |
| $3,000 or more | 17 (5.0%) | 0 (0.0%) |
| Total | 343 (100.0%) | 81 (100.0%) |
Physical Housing Characteristics in Millport
Housing Structures in Millport
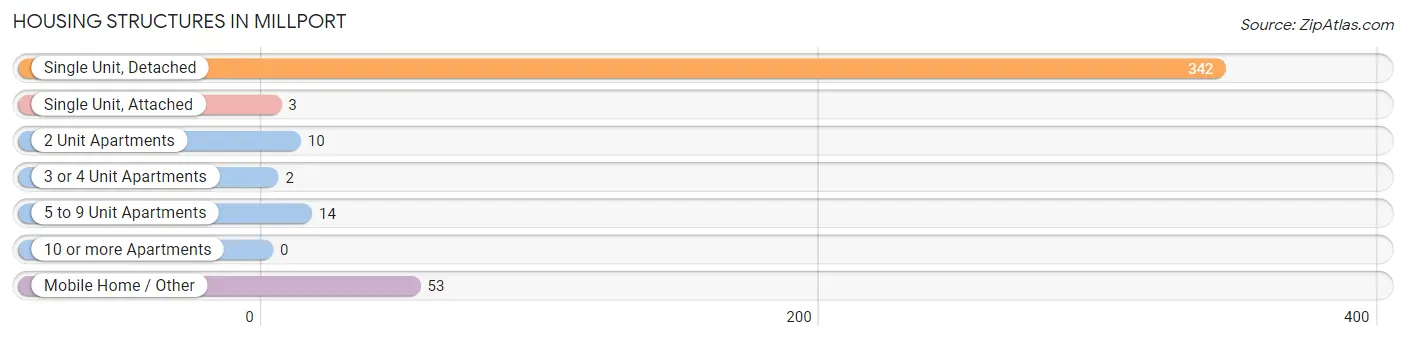
| Structure Type | # Housing Units | % Housing Units |
| Single Unit, Detached | 342 | 80.7% |
| Single Unit, Attached | 3 | 0.7% |
| 2 Unit Apartments | 10 | 2.4% |
| 3 or 4 Unit Apartments | 2 | 0.5% |
| 5 to 9 Unit Apartments | 14 | 3.3% |
| 10 or more Apartments | 0 | 0.0% |
| Mobile Home / Other | 53 | 12.5% |
| Total | 424 | 100.0% |
Housing Structures by Occupancy in Millport
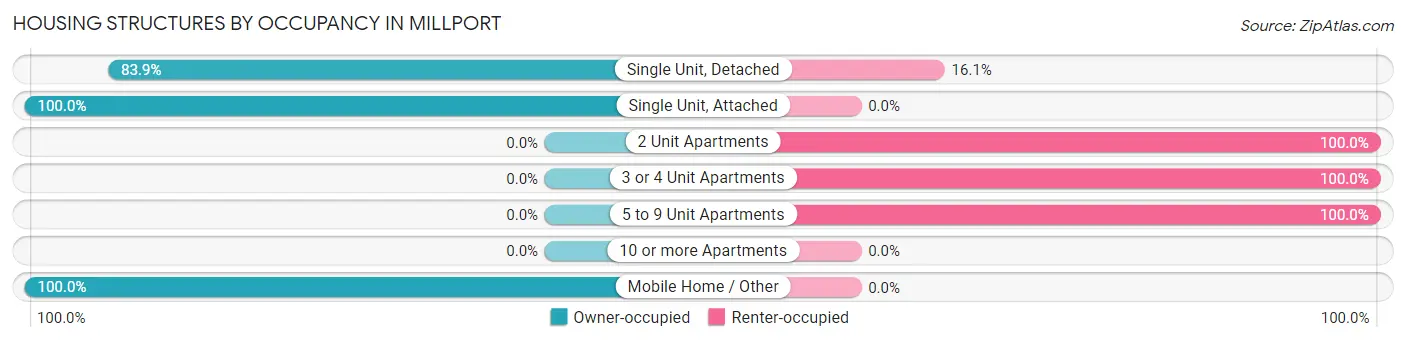
| Structure Type | Owner-occupied | Renter-occupied |
| Single Unit, Detached | 287 (83.9%) | 55 (16.1%) |
| Single Unit, Attached | 3 (100.0%) | 0 (0.0%) |
| 2 Unit Apartments | 0 (0.0%) | 10 (100.0%) |
| 3 or 4 Unit Apartments | 0 (0.0%) | 2 (100.0%) |
| 5 to 9 Unit Apartments | 0 (0.0%) | 14 (100.0%) |
| 10 or more Apartments | 0 (0.0%) | 0 (0.0%) |
| Mobile Home / Other | 53 (100.0%) | 0 (0.0%) |
| Total | 343 (80.9%) | 81 (19.1%) |
Housing Structures by Number of Rooms in Millport
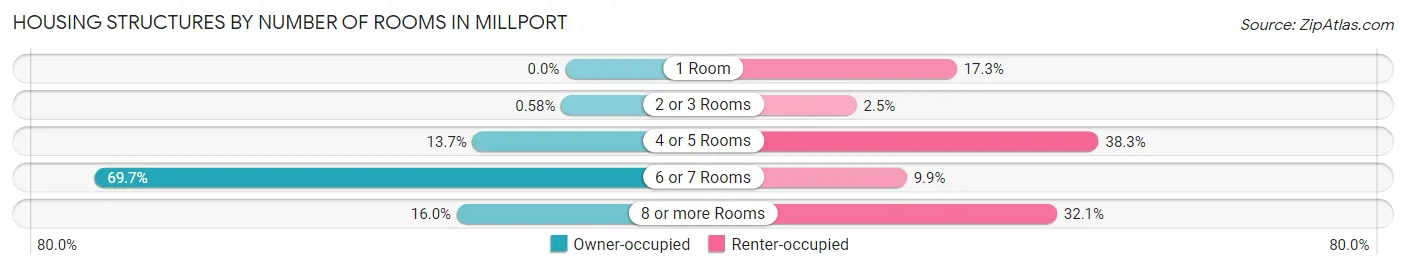
| Number of Rooms | Owner-occupied | Renter-occupied |
| 1 Room | 0 (0.0%) | 14 (17.3%) |
| 2 or 3 Rooms | 2 (0.6%) | 2 (2.5%) |
| 4 or 5 Rooms | 47 (13.7%) | 31 (38.3%) |
| 6 or 7 Rooms | 239 (69.7%) | 8 (9.9%) |
| 8 or more Rooms | 55 (16.0%) | 26 (32.1%) |
| Total | 343 (100.0%) | 81 (100.0%) |
Housing Structure by Heating Type in Millport
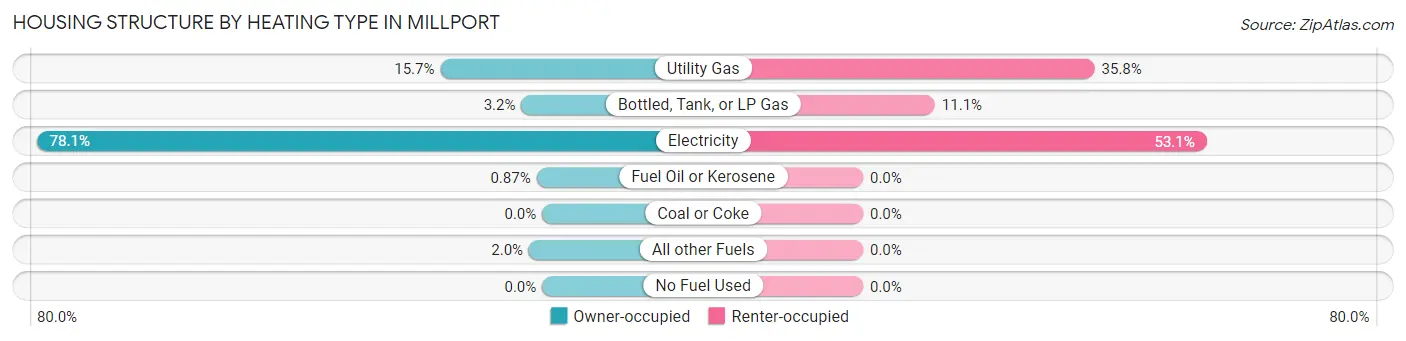
| Heating Type | Owner-occupied | Renter-occupied |
| Utility Gas | 54 (15.7%) | 29 (35.8%) |
| Bottled, Tank, or LP Gas | 11 (3.2%) | 9 (11.1%) |
| Electricity | 268 (78.1%) | 43 (53.1%) |
| Fuel Oil or Kerosene | 3 (0.9%) | 0 (0.0%) |
| Coal or Coke | 0 (0.0%) | 0 (0.0%) |
| All other Fuels | 7 (2.0%) | 0 (0.0%) |
| No Fuel Used | 0 (0.0%) | 0 (0.0%) |
| Total | 343 (100.0%) | 81 (100.0%) |
Household Vehicle Usage in Millport
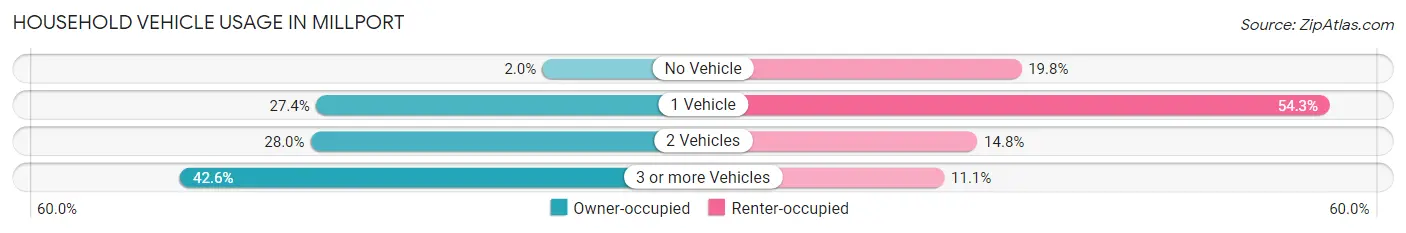
| Vehicles per Household | Owner-occupied | Renter-occupied |
| No Vehicle | 7 (2.0%) | 16 (19.8%) |
| 1 Vehicle | 94 (27.4%) | 44 (54.3%) |
| 2 Vehicles | 96 (28.0%) | 12 (14.8%) |
| 3 or more Vehicles | 146 (42.6%) | 9 (11.1%) |
| Total | 343 (100.0%) | 81 (100.0%) |
Real Estate & Mortgages in Millport
Real Estate and Mortgage Overview in Millport
| Characteristic | Without Mortgage | With Mortgage |
| Housing Units | 150 | 193 |
| Median Property Value | $55,500 | $111,000 |
| Median Household Income | $39,211 | $0 |
| Monthly Housing Costs | $372 | $0 |
| Real Estate Taxes | $219 | $0 |
Property Value by Mortgage Status in Millport
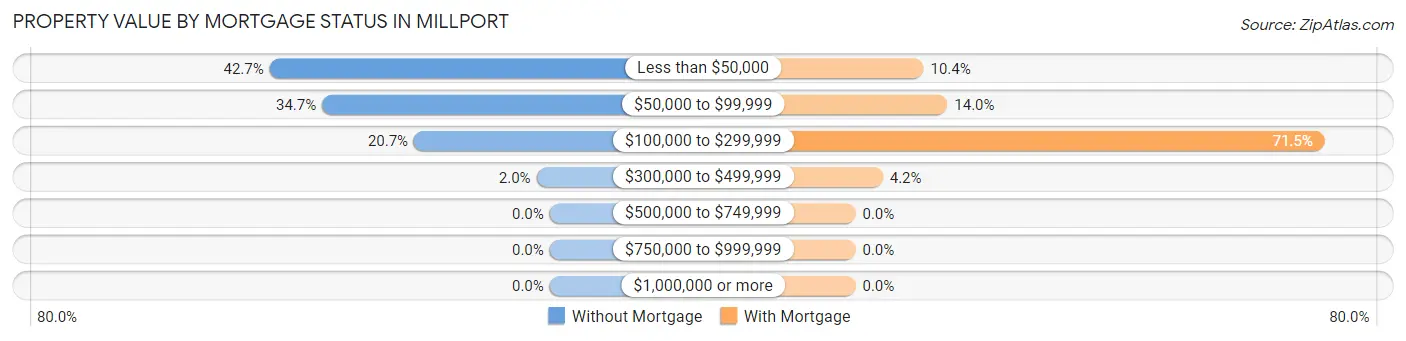
| Property Value | Without Mortgage | With Mortgage |
| Less than $50,000 | 64 (42.7%) | 20 (10.4%) |
| $50,000 to $99,999 | 52 (34.7%) | 27 (14.0%) |
| $100,000 to $299,999 | 31 (20.7%) | 138 (71.5%) |
| $300,000 to $499,999 | 3 (2.0%) | 8 (4.2%) |
| $500,000 to $749,999 | 0 (0.0%) | 0 (0.0%) |
| $750,000 to $999,999 | 0 (0.0%) | 0 (0.0%) |
| $1,000,000 or more | 0 (0.0%) | 0 (0.0%) |
| Total | 150 (100.0%) | 193 (100.0%) |
Household Income by Mortgage Status in Millport
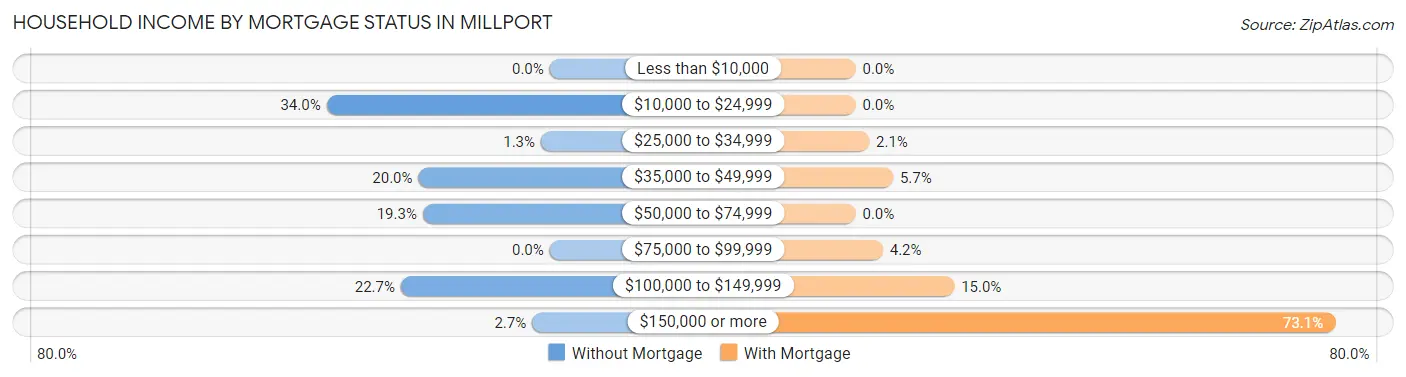
| Household Income | Without Mortgage | With Mortgage |
| Less than $10,000 | 0 (0.0%) | 0 (0.0%) |
| $10,000 to $24,999 | 51 (34.0%) | 0 (0.0%) |
| $25,000 to $34,999 | 2 (1.3%) | 4 (2.1%) |
| $35,000 to $49,999 | 30 (20.0%) | 11 (5.7%) |
| $50,000 to $74,999 | 29 (19.3%) | 0 (0.0%) |
| $75,000 to $99,999 | 0 (0.0%) | 8 (4.2%) |
| $100,000 to $149,999 | 34 (22.7%) | 29 (15.0%) |
| $150,000 or more | 4 (2.7%) | 141 (73.1%) |
| Total | 150 (100.0%) | 193 (100.0%) |
Property Value to Household Income Ratio in Millport
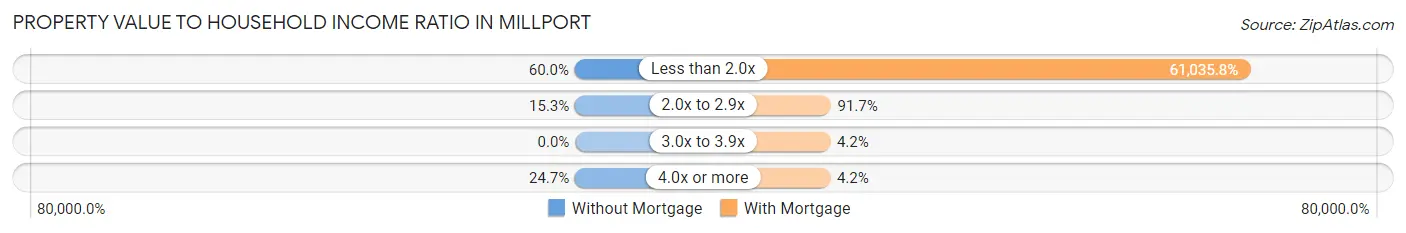
| Value-to-Income Ratio | Without Mortgage | With Mortgage |
| Less than 2.0x | 90 (60.0%) | 117,799 (61,035.7%) |
| 2.0x to 2.9x | 23 (15.3%) | 177 (91.7%) |
| 3.0x to 3.9x | 0 (0.0%) | 8 (4.2%) |
| 4.0x or more | 37 (24.7%) | 8 (4.2%) |
| Total | 150 (100.0%) | 193 (100.0%) |
Real Estate Taxes by Mortgage Status in Millport

| Property Taxes | Without Mortgage | With Mortgage |
| Less than $800 | 85 (56.7%) | 0 (0.0%) |
| $800 to $1,499 | 0 (0.0%) | 193 (100.0%) |
| $800 to $1,499 | 3 (2.0%) | 0 (0.0%) |
| Total | 150 (100.0%) | 193 (100.0%) |
Health & Disability in Millport
Health Insurance Coverage by Age in Millport
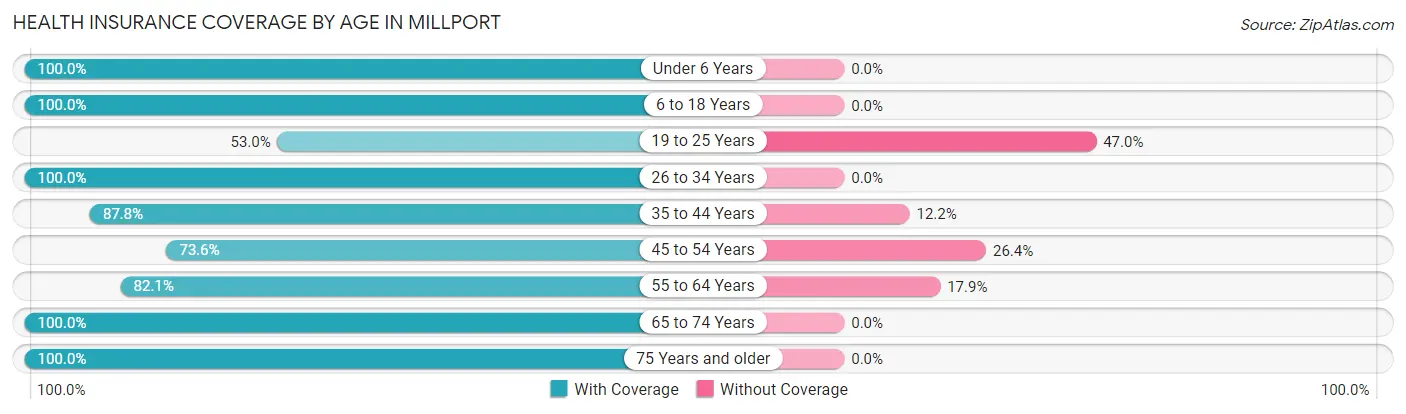
| Age Bracket | With Coverage | Without Coverage |
| Under 6 Years | 64 (100.0%) | 0 (0.0%) |
| 6 to 18 Years | 286 (100.0%) | 0 (0.0%) |
| 19 to 25 Years | 79 (53.0%) | 70 (47.0%) |
| 26 to 34 Years | 66 (100.0%) | 0 (0.0%) |
| 35 to 44 Years | 202 (87.8%) | 28 (12.2%) |
| 45 to 54 Years | 103 (73.6%) | 37 (26.4%) |
| 55 to 64 Years | 78 (82.1%) | 17 (17.9%) |
| 65 to 74 Years | 205 (100.0%) | 0 (0.0%) |
| 75 Years and older | 53 (100.0%) | 0 (0.0%) |
| Total | 1,136 (88.2%) | 152 (11.8%) |
Health Insurance Coverage by Citizenship Status in Millport

| Citizenship Status | With Coverage | Without Coverage |
| Native Born | 64 (100.0%) | 0 (0.0%) |
| Foreign Born, Citizen | 286 (100.0%) | 0 (0.0%) |
| Foreign Born, not a Citizen | 79 (53.0%) | 70 (47.0%) |
Health Insurance Coverage by Household Income in Millport
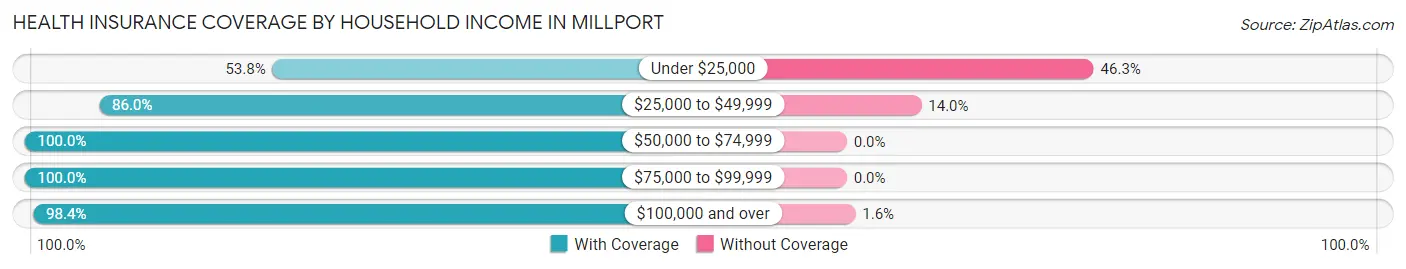
| Household Income | With Coverage | Without Coverage |
| Under $25,000 | 136 (53.7%) | 117 (46.3%) |
| $25,000 to $49,999 | 154 (86.0%) | 25 (14.0%) |
| $50,000 to $74,999 | 111 (100.0%) | 0 (0.0%) |
| $75,000 to $99,999 | 122 (100.0%) | 0 (0.0%) |
| $100,000 and over | 613 (98.4%) | 10 (1.6%) |
Public vs Private Health Insurance Coverage by Age in Millport
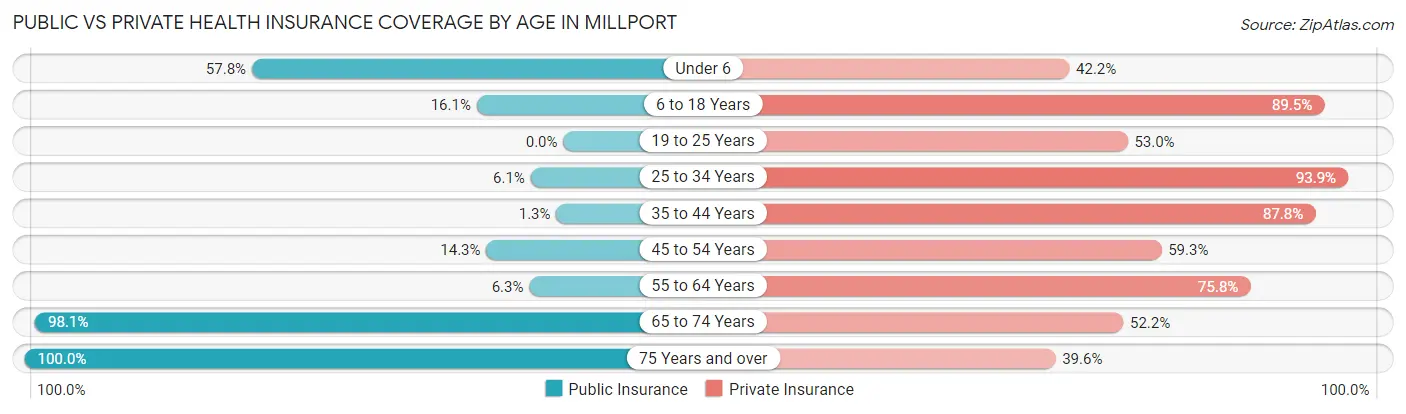
| Age Bracket | Public Insurance | Private Insurance |
| Under 6 | 37 (57.8%) | 27 (42.2%) |
| 6 to 18 Years | 46 (16.1%) | 256 (89.5%) |
| 19 to 25 Years | 0 (0.0%) | 79 (53.0%) |
| 25 to 34 Years | 4 (6.1%) | 62 (93.9%) |
| 35 to 44 Years | 3 (1.3%) | 202 (87.8%) |
| 45 to 54 Years | 20 (14.3%) | 83 (59.3%) |
| 55 to 64 Years | 6 (6.3%) | 72 (75.8%) |
| 65 to 74 Years | 201 (98.1%) | 107 (52.2%) |
| 75 Years and over | 53 (100.0%) | 21 (39.6%) |
| Total | 370 (28.7%) | 909 (70.6%) |
Disability Status by Sex by Age in Millport
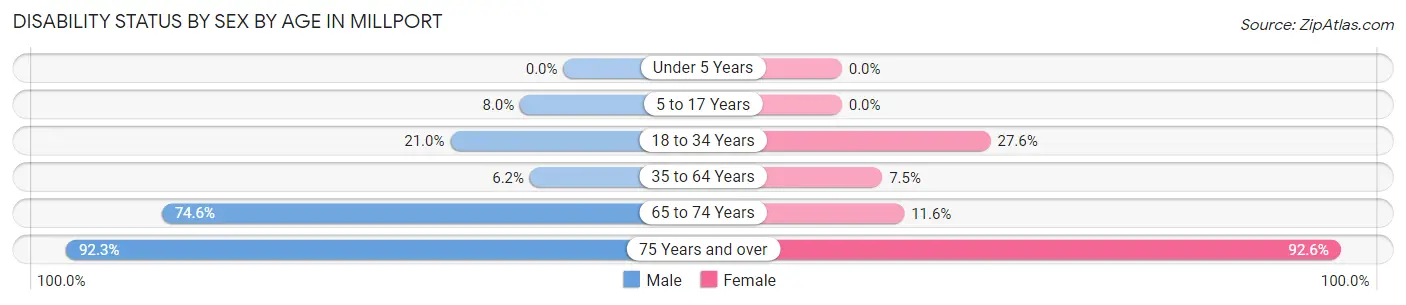
| Age Bracket | Male | Female |
| Under 5 Years | 0 (0.0%) | 0 (0.0%) |
| 5 to 17 Years | 19 (8.0%) | 0 (0.0%) |
| 18 to 34 Years | 17 (21.0%) | 37 (27.6%) |
| 35 to 64 Years | 14 (6.2%) | 18 (7.5%) |
| 65 to 74 Years | 82 (74.6%) | 11 (11.6%) |
| 75 Years and over | 24 (92.3%) | 25 (92.6%) |
Disability Class by Sex by Age in Millport
Disability Class: Hearing Difficulty
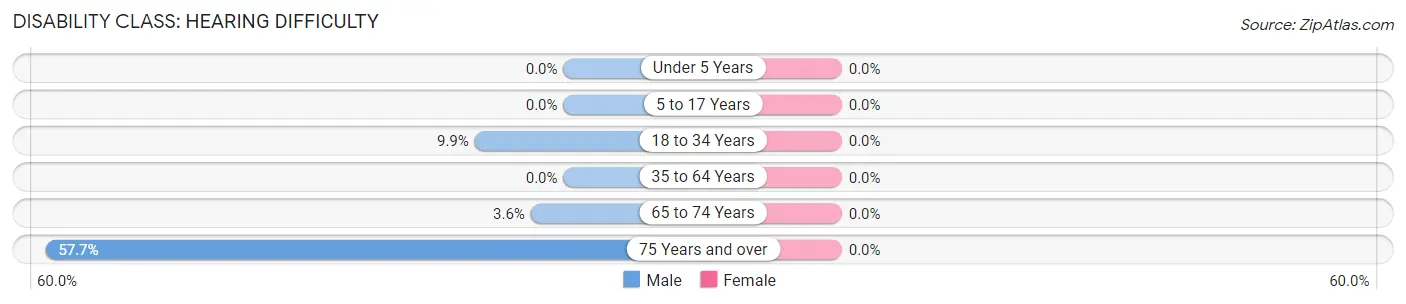
| Age Bracket | Male | Female |
| Under 5 Years | 0 (0.0%) | 0 (0.0%) |
| 5 to 17 Years | 0 (0.0%) | 0 (0.0%) |
| 18 to 34 Years | 8 (9.9%) | 0 (0.0%) |
| 35 to 64 Years | 0 (0.0%) | 0 (0.0%) |
| 65 to 74 Years | 4 (3.6%) | 0 (0.0%) |
| 75 Years and over | 15 (57.7%) | 0 (0.0%) |
Disability Class: Vision Difficulty
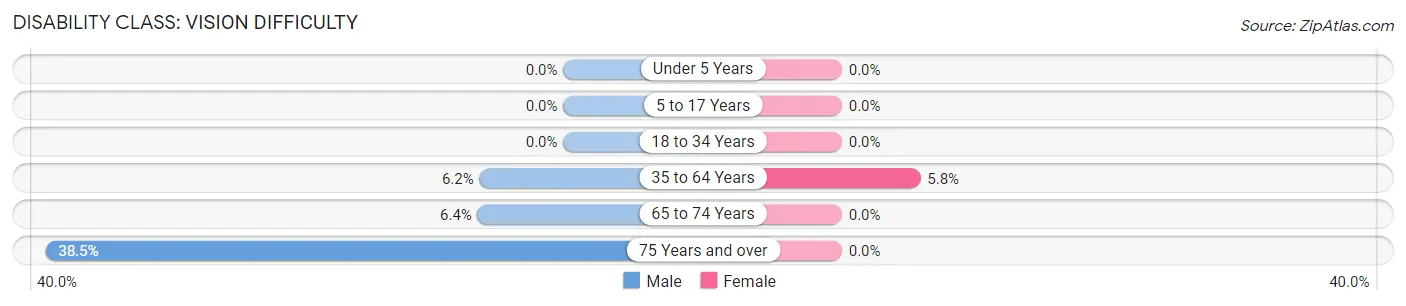
| Age Bracket | Male | Female |
| Under 5 Years | 0 (0.0%) | 0 (0.0%) |
| 5 to 17 Years | 0 (0.0%) | 0 (0.0%) |
| 18 to 34 Years | 0 (0.0%) | 0 (0.0%) |
| 35 to 64 Years | 14 (6.2%) | 14 (5.8%) |
| 65 to 74 Years | 7 (6.4%) | 0 (0.0%) |
| 75 Years and over | 10 (38.5%) | 0 (0.0%) |
Disability Class: Cognitive Difficulty
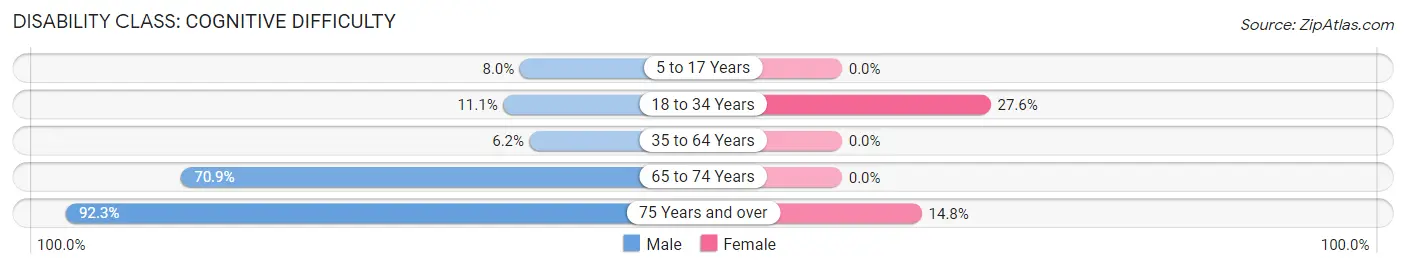
| Age Bracket | Male | Female |
| 5 to 17 Years | 19 (8.0%) | 0 (0.0%) |
| 18 to 34 Years | 9 (11.1%) | 37 (27.6%) |
| 35 to 64 Years | 14 (6.2%) | 0 (0.0%) |
| 65 to 74 Years | 78 (70.9%) | 0 (0.0%) |
| 75 Years and over | 24 (92.3%) | 4 (14.8%) |
Disability Class: Ambulatory Difficulty
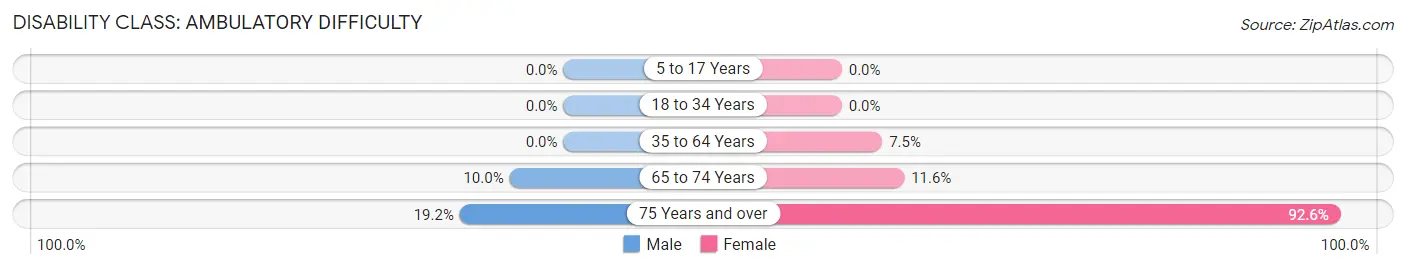
| Age Bracket | Male | Female |
| 5 to 17 Years | 0 (0.0%) | 0 (0.0%) |
| 18 to 34 Years | 0 (0.0%) | 0 (0.0%) |
| 35 to 64 Years | 0 (0.0%) | 18 (7.5%) |
| 65 to 74 Years | 11 (10.0%) | 11 (11.6%) |
| 75 Years and over | 5 (19.2%) | 25 (92.6%) |
Disability Class: Self-Care Difficulty
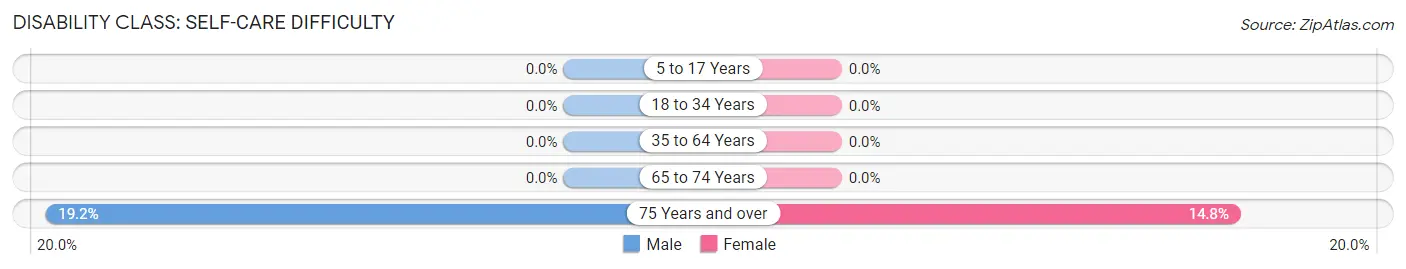
| Age Bracket | Male | Female |
| 5 to 17 Years | 0 (0.0%) | 0 (0.0%) |
| 18 to 34 Years | 0 (0.0%) | 0 (0.0%) |
| 35 to 64 Years | 0 (0.0%) | 0 (0.0%) |
| 65 to 74 Years | 0 (0.0%) | 0 (0.0%) |
| 75 Years and over | 5 (19.2%) | 4 (14.8%) |
Technology Access in Millport
Computing Device Access in Millport
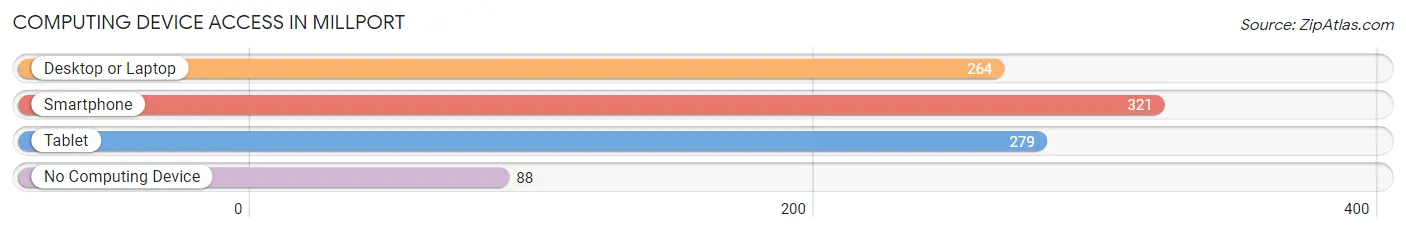
| Device Type | # Households | % Households |
| Desktop or Laptop | 264 | 62.3% |
| Smartphone | 321 | 75.7% |
| Tablet | 279 | 65.8% |
| No Computing Device | 88 | 20.7% |
| Total | 424 | 100.0% |
Internet Access in Millport
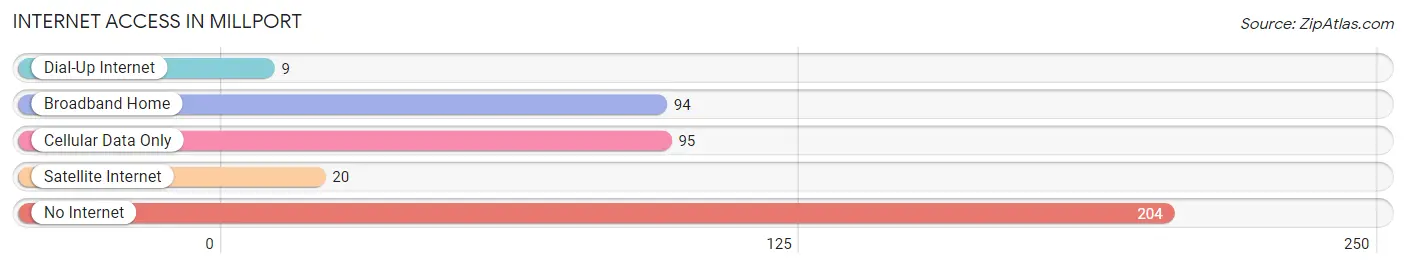
| Internet Type | # Households | % Households |
| Dial-Up Internet | 9 | 2.1% |
| Broadband Home | 94 | 22.2% |
| Cellular Data Only | 95 | 22.4% |
| Satellite Internet | 20 | 4.7% |
| No Internet | 204 | 48.1% |
| Total | 424 | 100.0% |
Millport Summary
Millport is a small town located in Lamar County, Alabama. It is situated in the northwest corner of the state, about 30 miles from the Mississippi border. The town was founded in 1837 and has a population of approximately 1,000 people.
History
Millport was founded in 1837 by a group of settlers from Georgia. The town was named after a nearby mill, which was built by the settlers to grind corn and wheat. The mill was powered by a water wheel, which was fed by a nearby creek. The town grew quickly and by the mid-1800s, it had become a thriving community.
The town was an important stop on the Mobile and Ohio Railroad, which ran through the area. The railroad brought new people and businesses to the area, and Millport soon became a bustling center of commerce.
In the late 1800s, the town was home to several cotton gins, a sawmill, a gristmill, and a brickyard. The town also had several stores, a hotel, and a post office.
In the early 1900s, the town began to decline. The railroad was rerouted, and the town’s businesses began to close. By the mid-1900s, the town had become a quiet, rural community.
Geography
Millport is located in the northwest corner of Lamar County, Alabama. It is situated on the banks of the Tombigbee River, about 30 miles from the Mississippi border. The town is surrounded by rolling hills and forests, and is located in the foothills of the Appalachian Mountains.
The climate in Millport is humid subtropical, with hot, humid summers and mild winters. The average annual temperature is around 70 degrees Fahrenheit, and the average annual precipitation is around 50 inches.
Economy
Millport’s economy is largely based on agriculture. The town is home to several farms, which produce corn, soybeans, cotton, and other crops. The town also has several small businesses, including a grocery store, a hardware store, and a few restaurants.
The town is also home to a few manufacturing companies, which produce furniture, clothing, and other goods.
Demographics
As of the 2010 census, Millport had a population of 1,000 people. The racial makeup of the town was 97.2% White, 0.7% African American, 0.3% Native American, 0.2% Asian, and 1.6% from other races.
The median household income in Millport was $30,000, and the median family income was $35,000. The per capita income was $15,000. About 15.7% of the population was below the poverty line.
Conclusion
Millport is a small town located in Lamar County, Alabama. It was founded in 1837 and has a population of approximately 1,000 people. The town’s economy is largely based on agriculture, and it is home to several small businesses. The town has a humid subtropical climate, and the median household income is around $30,000. Millport is a quiet, rural community that has managed to maintain its small-town charm.
Common Questions
What is Per Capita Income in Millport?
Per Capita income in Millport is $24,363.
What is the Median Family Income in Millport?
Median Family Income in Millport is $100,583.
What is the Median Household income in Millport?
Median Household Income in Millport is $68,750.
What is Income or Wage Gap in Millport?
Income or Wage Gap in Millport is 1.8%.
Women in Millport earn 98.2 cents for every dollar earned by a man.
What is Inequality or Gini Index in Millport?
Inequality or Gini Index in Millport is 0.34.
What is the Total Population of Millport?
Total Population of Millport is 1,288.
What is the Total Male Population of Millport?
Total Male Population of Millport is 713.
What is the Total Female Population of Millport?
Total Female Population of Millport is 575.
What is the Ratio of Males per 100 Females in Millport?
There are 124.00 Males per 100 Females in Millport.
What is the Ratio of Females per 100 Males in Millport?
There are 80.65 Females per 100 Males in Millport.
What is the Median Population Age in Millport?
Median Population Age in Millport is 40.1 Years.
What is the Average Family Size in Millport
Average Family Size in Millport is 3.5 People.
What is the Average Household Size in Millport
Average Household Size in Millport is 3.0 People.
How Large is the Labor Force in Millport?
There are 597 People in the Labor Forcein in Millport.
What is the Percentage of People in the Labor Force in Millport?
61.8% of People are in the Labor Force in Millport.
What is the Unemployment Rate in Millport?
Unemployment Rate in Millport is 1.5%.