Zip Codes with the Highest Percentage of Households with Income Above $100,000 in Mobile, AL
RELATED REPORTS & OPTIONS
Household Income | $100k+
Mobile
Compare Zip Codes
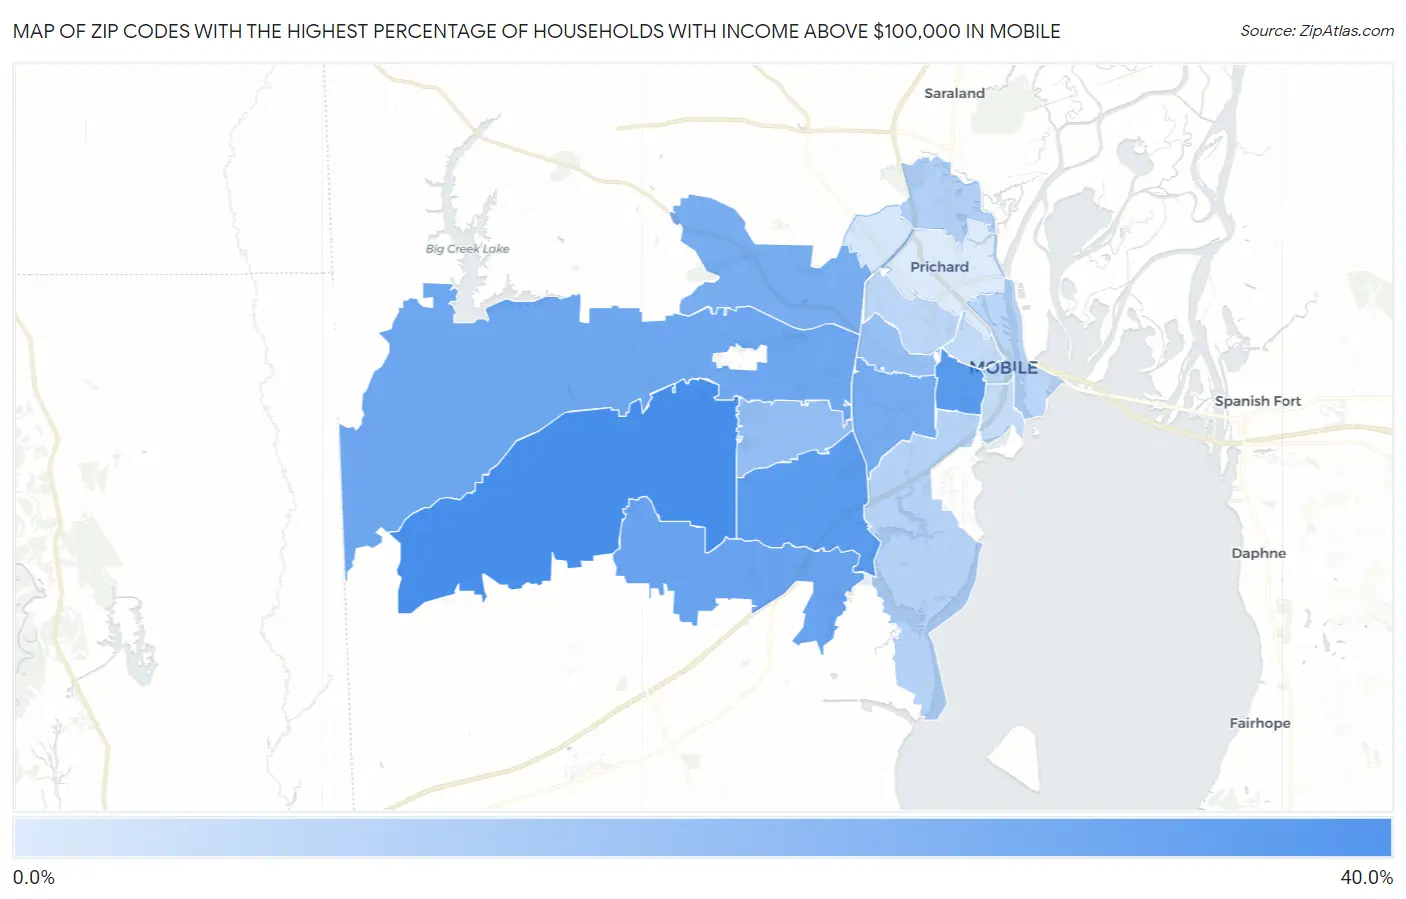
Map of Zip Codes with the Highest Percentage of Households with Income Above $100,000 in Mobile
5.6%
35.3%
Zip Codes with the Highest Percentage of Households with Income Above $100,000 in Mobile, AL
| Zip Code | Households with Income > $100k | vs State | vs National | |
| 1. | 36695 | 35.3% | 27.9%(+7.40)#107 | 37.3%(-2.00)#11,585 |
| 2. | 36604 | 31.7% | 27.9%(+3.80)#139 | 37.3%(-5.60)#14,106 |
| 3. | 36693 | 30.7% | 27.9%(+2.80)#152 | 37.3%(-6.60)#14,887 |
| 4. | 36619 | 28.4% | 27.9%(+0.500)#181 | 37.3%(-8.90)#16,784 |
| 5. | 36608 | 26.8% | 27.9%(-1.10)#198 | 37.3%(-10.5)#18,140 |
| 6. | 36606 | 25.3% | 27.9%(-2.60)#223 | 37.3%(-12.0)#19,485 |
| 7. | 36618 | 24.7% | 27.9%(-3.20)#236 | 37.3%(-12.6)#20,015 |
| 8. | 36609 | 19.2% | 27.9%(-8.70)#368 | 37.3%(-18.1)#24,659 |
| 9. | 36607 | 19.0% | 27.9%(-8.90)#376 | 37.3%(-18.3)#24,835 |
| 10. | 36611 | 13.7% | 27.9%(-14.2)#491 | 37.3%(-23.6)#28,256 |
| 11. | 36605 | 12.7% | 27.9%(-15.2)#509 | 37.3%(-24.6)#28,720 |
| 12. | 36602 | 12.0% | 27.9%(-15.9)#518 | 37.3%(-25.3)#29,040 |
| 13. | 36617 | 11.6% | 27.9%(-16.3)#526 | 37.3%(-25.7)#29,185 |
| 14. | 36603 | 10.2% | 27.9%(-17.7)#539 | 37.3%(-27.1)#29,751 |
| 15. | 36612 | 6.7% | 27.9%(-21.2)#571 | 37.3%(-30.6)#30,732 |
| 16. | 36610 | 5.6% | 27.9%(-22.3)#582 | 37.3%(-31.7)#30,937 |
1
Common Questions
What are the Top 10 Zip Codes with the Highest Percentage of Households with Income Above $100,000 in Mobile, AL?
Top 10 Zip Codes with the Highest Percentage of Households with Income Above $100,000 in Mobile, AL are:
What zip code has the Highest Percentage of Households with Income Above $100,000 in Mobile, AL?
36695 has the Highest Percentage of Households with Income Above $100,000 in Mobile, AL with 35.3%.
What is the Percentage of Households with Income Above $100,000 in Mobile, AL?
Percentage of Households with Income Above $100,000 in Mobile is 21.5%.
What is the Percentage of Households with Income Above $100,000 in Alabama?
Percentage of Households with Income Above $100,000 in Alabama is 27.9%.
What is the Percentage of Households with Income Above $100,000 in the United States?
Percentage of Households with Income Above $100,000 in the United States is 37.3%.