Alexandria, AL Map & Demographics
Alexandria Map
Alexandria Overview
$35,542
PER CAPITA INCOME
$98,220
AVG FAMILY INCOME
$95,039
AVG HOUSEHOLD INCOME
54.9%
WAGE / INCOME GAP [ % ]
45.1¢/ $1
WAGE / INCOME GAP [ $ ]
0.32
INEQUALITY / GINI INDEX
3,748
TOTAL POPULATION
1,762
MALE POPULATION
1,986
FEMALE POPULATION
88.72
MALES / 100 FEMALES
112.71
FEMALES / 100 MALES
40.9
MEDIAN AGE
3.3
AVG FAMILY SIZE
2.9
AVG HOUSEHOLD SIZE
1,964
LABOR FORCE [ PEOPLE ]
60.7%
PERCENT IN LABOR FORCE
0.9%
UNEMPLOYMENT RATE
Alexandria Zip Codes
Alexandria Area Codes
Income in Alexandria
Income Overview in Alexandria
Per Capita Income in Alexandria is $35,542, while median incomes of families and households are $98,220 and $95,039 respectively.
| Characteristic | Number | Measure |
| Per Capita Income | 3,748 | $35,542 |
| Median Family Income | 1,027 | $98,220 |
| Mean Family Income | 1,027 | $104,541 |
| Median Household Income | 1,317 | $95,039 |
| Mean Household Income | 1,317 | $90,861 |
| Income Deficit | 1,027 | $0 |
| Wage / Income Gap (%) | 3,748 | 54.86% |
| Wage / Income Gap ($) | 3,748 | 45.14¢ per $1 |
| Gini / Inequality Index | 3,748 | 0.32 |
Earnings by Sex in Alexandria
Average Earnings in Alexandria are $44,330, $63,281 for men and $28,563 for women, a difference of 54.9%.
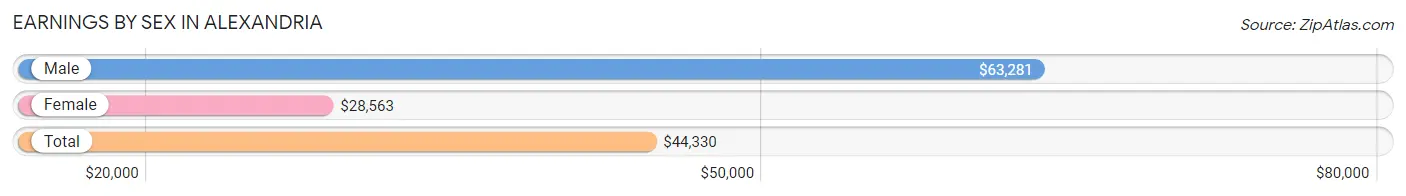
| Sex | Number | Average Earnings |
| Male | 1,010 (50.9%) | $63,281 |
| Female | 973 (49.1%) | $28,563 |
| Total | 1,983 (100.0%) | $44,330 |
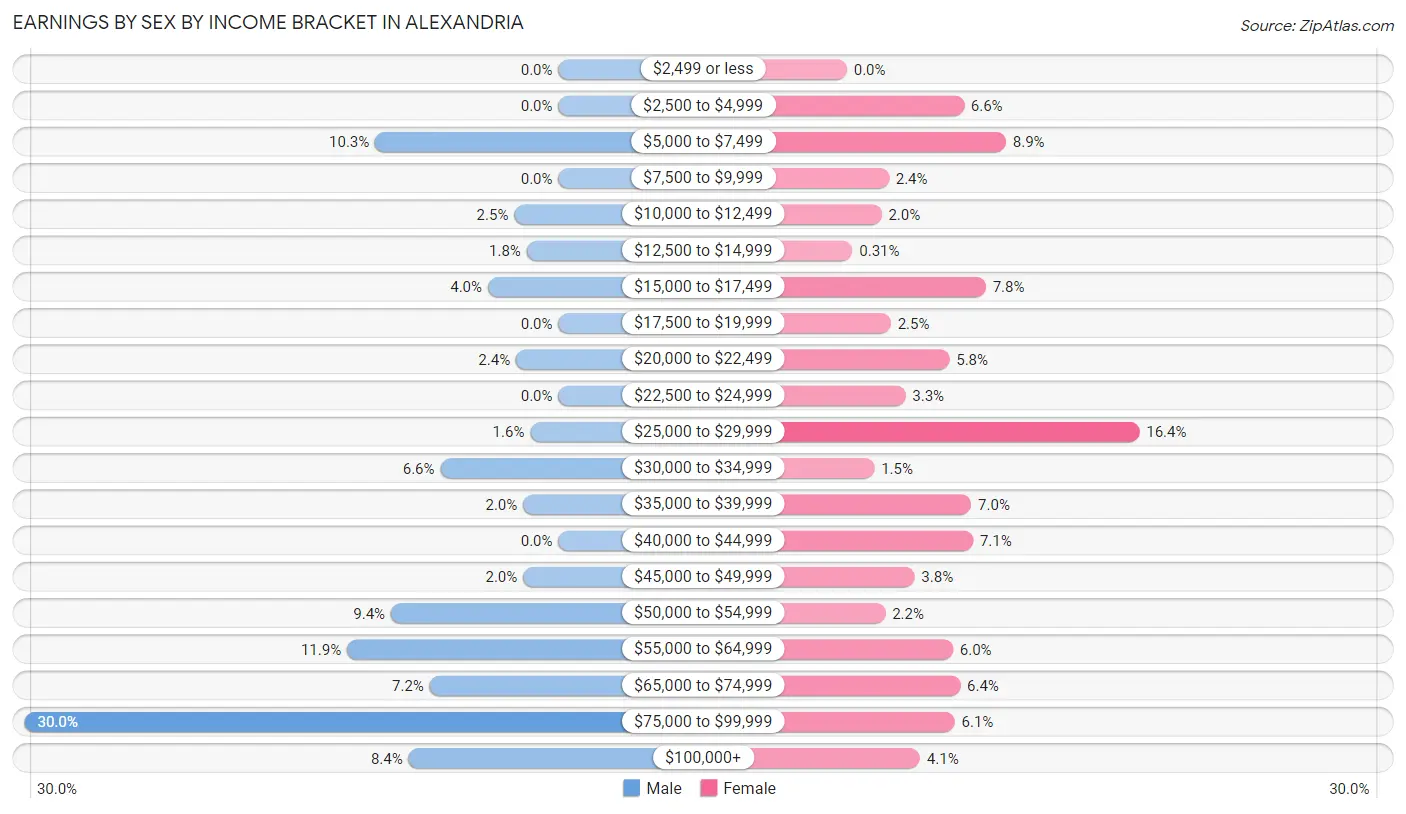
Earnings by Sex by Income Bracket in Alexandria
The most common earnings brackets in Alexandria are $75,000 to $99,999 for men (303 | 30.0%) and $25,000 to $29,999 for women (160 | 16.4%).
| Income | Male | Female |
| $2,499 or less | 0 (0.0%) | 0 (0.0%) |
| $2,500 to $4,999 | 0 (0.0%) | 64 (6.6%) |
| $5,000 to $7,499 | 104 (10.3%) | 87 (8.9%) |
| $7,500 to $9,999 | 0 (0.0%) | 23 (2.4%) |
| $10,000 to $12,499 | 25 (2.5%) | 19 (1.9%) |
| $12,500 to $14,999 | 18 (1.8%) | 3 (0.3%) |
| $15,000 to $17,499 | 40 (4.0%) | 76 (7.8%) |
| $17,500 to $19,999 | 0 (0.0%) | 24 (2.5%) |
| $20,000 to $22,499 | 24 (2.4%) | 56 (5.8%) |
| $22,500 to $24,999 | 0 (0.0%) | 32 (3.3%) |
| $25,000 to $29,999 | 16 (1.6%) | 160 (16.4%) |
| $30,000 to $34,999 | 67 (6.6%) | 15 (1.5%) |
| $35,000 to $39,999 | 20 (2.0%) | 68 (7.0%) |
| $40,000 to $44,999 | 0 (0.0%) | 69 (7.1%) |
| $45,000 to $49,999 | 20 (2.0%) | 37 (3.8%) |
| $50,000 to $54,999 | 95 (9.4%) | 21 (2.2%) |
| $55,000 to $64,999 | 120 (11.9%) | 58 (6.0%) |
| $65,000 to $74,999 | 73 (7.2%) | 62 (6.4%) |
| $75,000 to $99,999 | 303 (30.0%) | 59 (6.1%) |
| $100,000+ | 85 (8.4%) | 40 (4.1%) |
| Total | 1,010 (100.0%) | 973 (100.0%) |
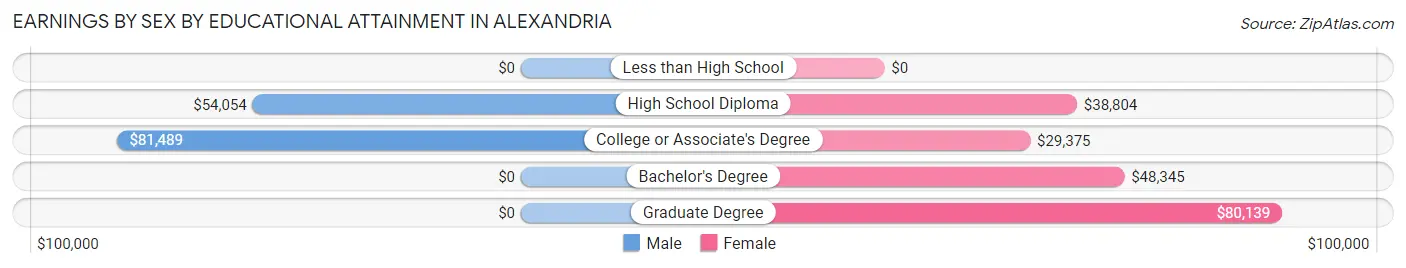
Earnings by Sex by Educational Attainment in Alexandria
Average earnings in Alexandria are $68,149 for men and $37,689 for women, a difference of 44.7%. Men with an educational attainment of college or associate's degree enjoy the highest average annual earnings of $81,489, while those with high school diploma education earn the least with $54,054. Women with an educational attainment of graduate degree earn the most with the average annual earnings of $80,139, while those with college or associate's degree education have the smallest earnings of $29,375.
| Educational Attainment | Male Income | Female Income |
| Less than High School | - | - |
| High School Diploma | $54,054 | $38,804 |
| College or Associate's Degree | $81,489 | $29,375 |
| Bachelor's Degree | - | - |
| Graduate Degree | - | - |
| Total | $68,149 | $37,689 |
Family Income in Alexandria
Family Income Brackets in Alexandria
According to the Alexandria family income data, there are 298 families falling into the $100,000 to $149,999 income range, which is the most common income bracket and makes up 29.0% of all families.
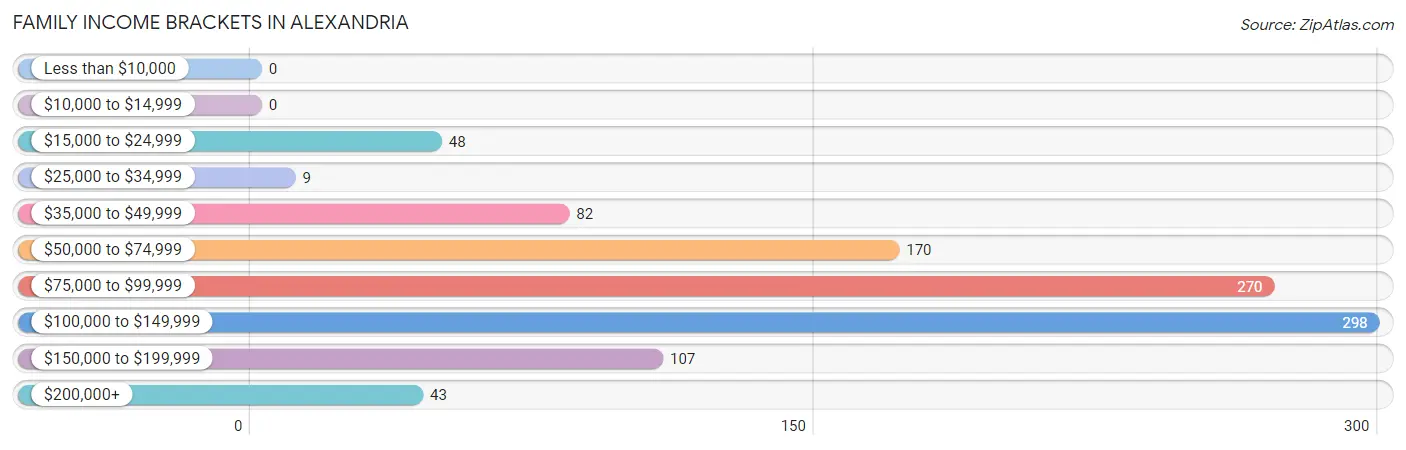
| Income Bracket | # Families | % Families |
| Less than $10,000 | 0 | 0.0% |
| $10,000 to $14,999 | 0 | 0.0% |
| $15,000 to $24,999 | 48 | 4.7% |
| $25,000 to $34,999 | 9 | 0.9% |
| $35,000 to $49,999 | 82 | 8.0% |
| $50,000 to $74,999 | 170 | 16.6% |
| $75,000 to $99,999 | 270 | 26.3% |
| $100,000 to $149,999 | 298 | 29.0% |
| $150,000 to $199,999 | 107 | 10.4% |
| $200,000+ | 43 | 4.2% |
Family Income by Famaliy Size in Alexandria
5-person families (114 | 11.1%) account for the highest median family income in Alexandria with $130,379 per family, while 2-person families (492 | 47.9%) have the highest median income of $50,218 per family member.
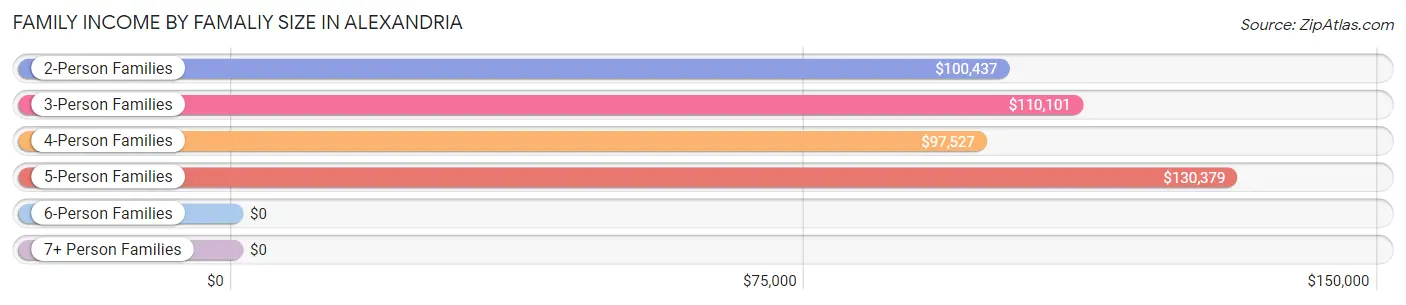
| Income Bracket | # Families | Median Income |
| 2-Person Families | 492 (47.9%) | $100,437 |
| 3-Person Families | 201 (19.6%) | $110,101 |
| 4-Person Families | 212 (20.6%) | $97,527 |
| 5-Person Families | 114 (11.1%) | $130,379 |
| 6-Person Families | 7 (0.7%) | $0 |
| 7+ Person Families | 1 (0.1%) | $0 |
| Total | 1,027 (100.0%) | $98,220 |
Family Income by Number of Earners in Alexandria
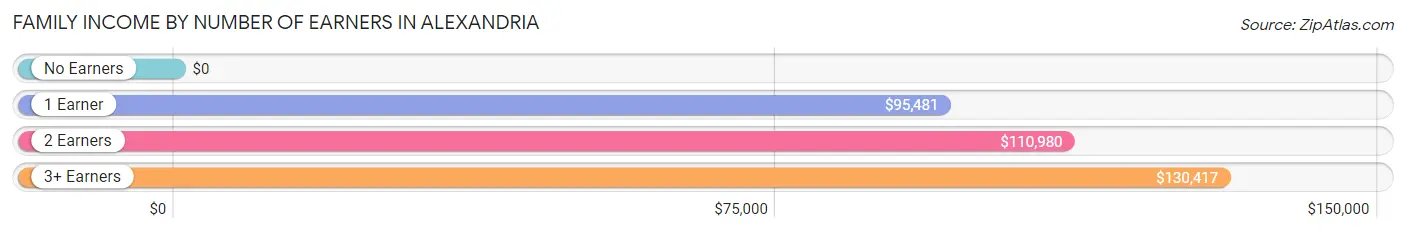
| Number of Earners | # Families | Median Income |
| No Earners | 126 (12.3%) | $0 |
| 1 Earner | 311 (30.3%) | $95,481 |
| 2 Earners | 395 (38.5%) | $110,980 |
| 3+ Earners | 195 (19.0%) | $130,417 |
| Total | 1,027 (100.0%) | $98,220 |
Household Income in Alexandria
Household Income Brackets in Alexandria
With 321 households falling in the category, the $100,000 to $149,999 income range is the most frequent in Alexandria, accounting for 24.4% of all households.
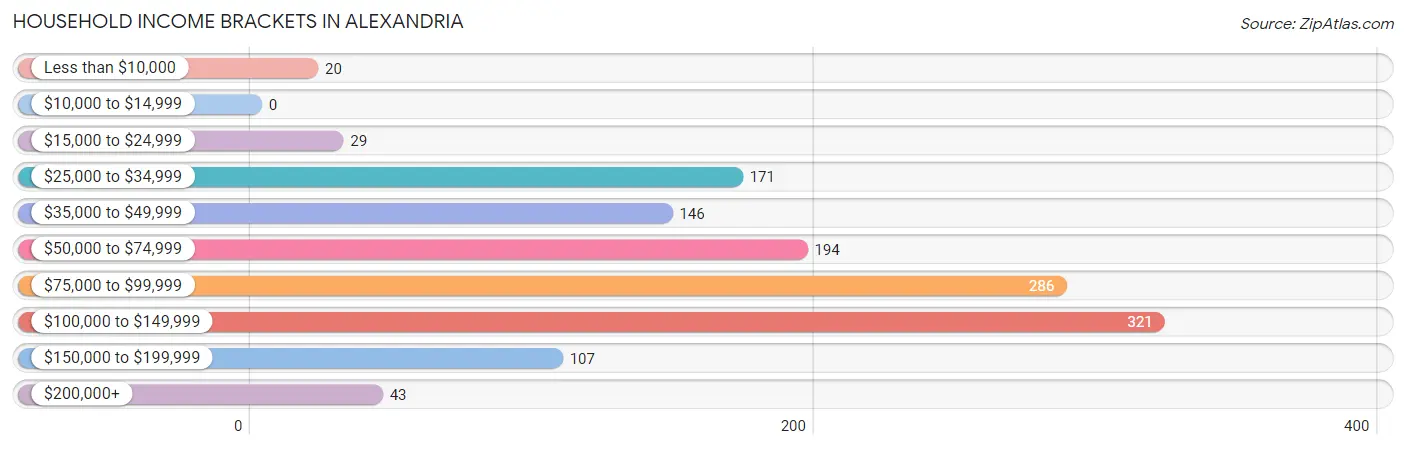
| Income Bracket | # Households | % Households |
| Less than $10,000 | 20 | 1.5% |
| $10,000 to $14,999 | 0 | 0.0% |
| $15,000 to $24,999 | 29 | 2.2% |
| $25,000 to $34,999 | 171 | 13.0% |
| $35,000 to $49,999 | 146 | 11.1% |
| $50,000 to $74,999 | 194 | 14.7% |
| $75,000 to $99,999 | 286 | 21.7% |
| $100,000 to $149,999 | 321 | 24.4% |
| $150,000 to $199,999 | 107 | 8.1% |
| $200,000+ | 43 | 3.3% |
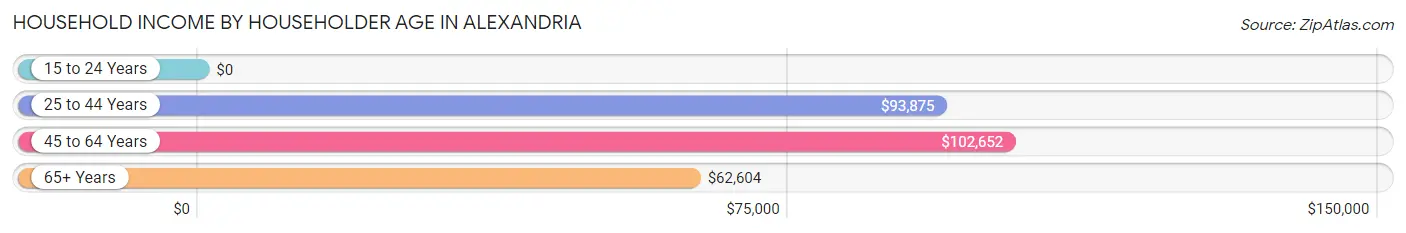
Household Income by Householder Age in Alexandria
The median household income in Alexandria is $95,039, with the highest median household income of $102,652 found in the 45 to 64 years age bracket for the primary householder. A total of 501 households (38.0%) fall into this category.
| Income Bracket | # Households | Median Income |
| 15 to 24 Years | 0 (0.0%) | $0 |
| 25 to 44 Years | 445 (33.8%) | $93,875 |
| 45 to 64 Years | 501 (38.0%) | $102,652 |
| 65+ Years | 371 (28.2%) | $62,604 |
| Total | 1,317 (100.0%) | $95,039 |
Poverty in Alexandria
Income Below Poverty by Sex and Age in Alexandria
With 5.2% poverty level for males and 4.5% for females among the residents of Alexandria, 6 to 11 year old males and 5 year old females are the most vulnerable to poverty, with 73 males (52.5%) and 21 females (100.0%) in their respective age groups living below the poverty level.
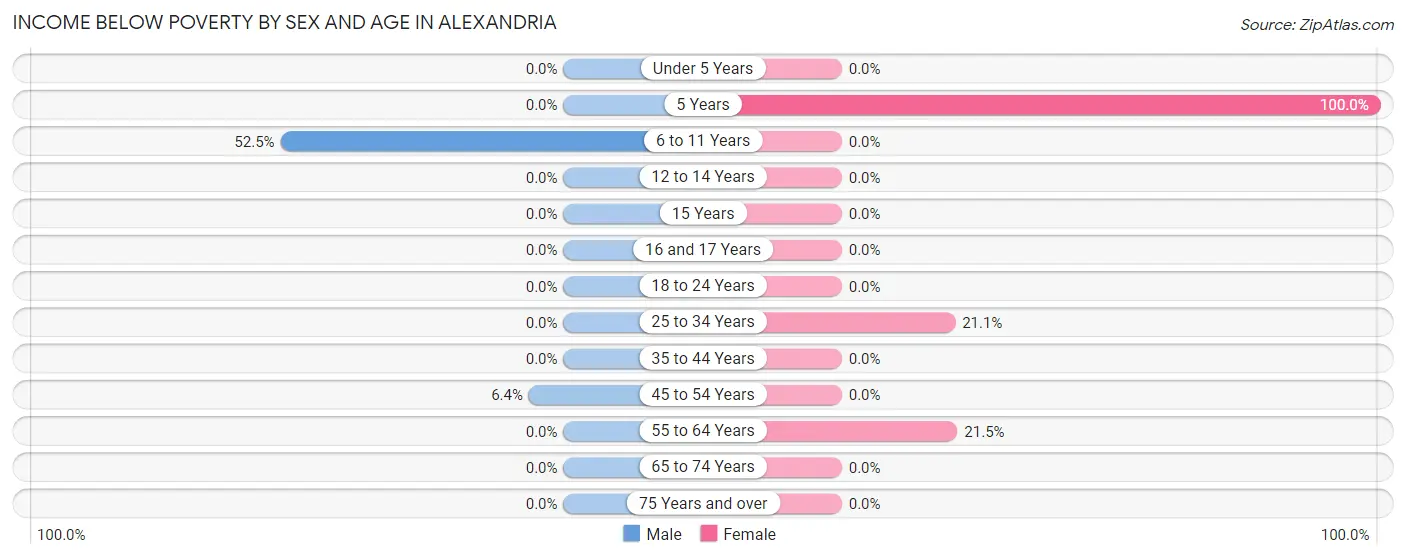
| Age Bracket | Male | Female |
| Under 5 Years | 0 (0.0%) | 0 (0.0%) |
| 5 Years | 0 (0.0%) | 21 (100.0%) |
| 6 to 11 Years | 73 (52.5%) | 0 (0.0%) |
| 12 to 14 Years | 0 (0.0%) | 0 (0.0%) |
| 15 Years | 0 (0.0%) | 0 (0.0%) |
| 16 and 17 Years | 0 (0.0%) | 0 (0.0%) |
| 18 to 24 Years | 0 (0.0%) | 0 (0.0%) |
| 25 to 34 Years | 0 (0.0%) | 24 (21.0%) |
| 35 to 44 Years | 0 (0.0%) | 0 (0.0%) |
| 45 to 54 Years | 18 (6.4%) | 0 (0.0%) |
| 55 to 64 Years | 0 (0.0%) | 44 (21.5%) |
| 65 to 74 Years | 0 (0.0%) | 0 (0.0%) |
| 75 Years and over | 0 (0.0%) | 0 (0.0%) |
| Total | 91 (5.2%) | 89 (4.5%) |
Income Above Poverty by Sex and Age in Alexandria
According to the poverty statistics in Alexandria, males aged under 5 years and females aged under 5 years are the age groups that are most secure financially, with 100.0% of males and 100.0% of females in these age groups living above the poverty line.
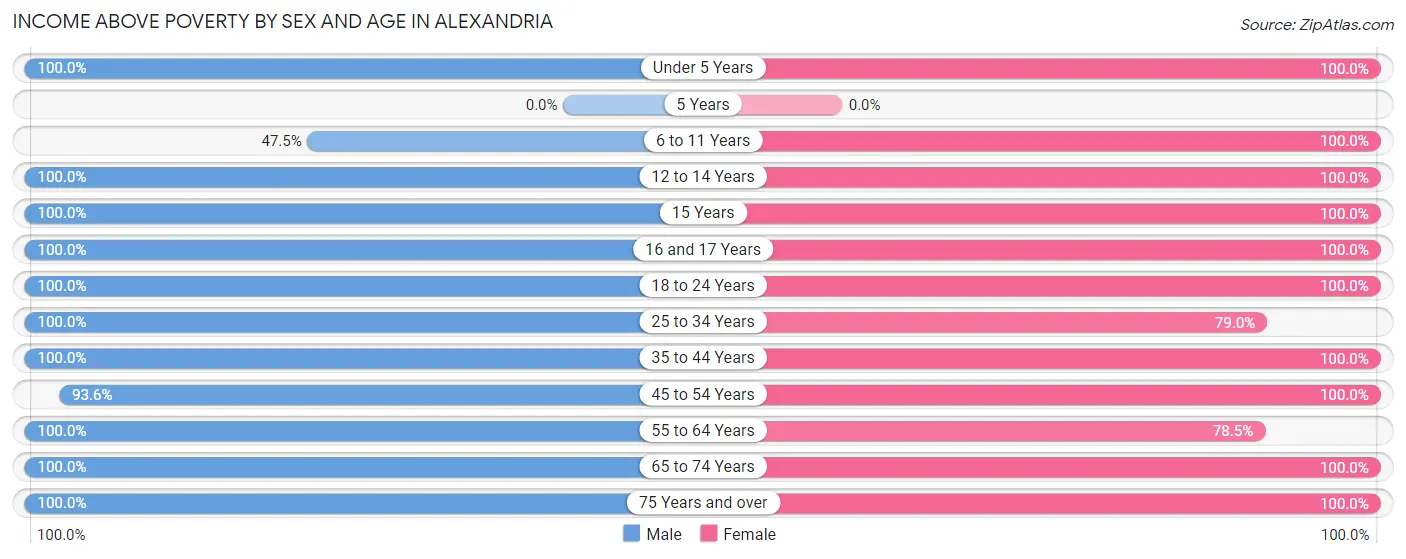
| Age Bracket | Male | Female |
| Under 5 Years | 101 (100.0%) | 60 (100.0%) |
| 5 Years | 0 (0.0%) | 0 (0.0%) |
| 6 to 11 Years | 66 (47.5%) | 91 (100.0%) |
| 12 to 14 Years | 49 (100.0%) | 21 (100.0%) |
| 15 Years | 11 (100.0%) | 20 (100.0%) |
| 16 and 17 Years | 10 (100.0%) | 89 (100.0%) |
| 18 to 24 Years | 141 (100.0%) | 237 (100.0%) |
| 25 to 34 Years | 251 (100.0%) | 90 (78.9%) |
| 35 to 44 Years | 252 (100.0%) | 458 (100.0%) |
| 45 to 54 Years | 263 (93.6%) | 283 (100.0%) |
| 55 to 64 Years | 207 (100.0%) | 161 (78.5%) |
| 65 to 74 Years | 217 (100.0%) | 173 (100.0%) |
| 75 Years and over | 103 (100.0%) | 214 (100.0%) |
| Total | 1,671 (94.8%) | 1,897 (95.5%) |
Income Below Poverty Among Married-Couple Families in Alexandria
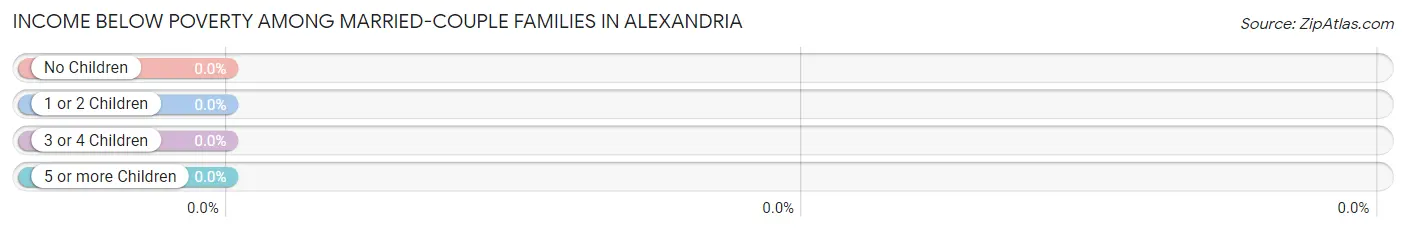
| Children | Above Poverty | Below Poverty |
| No Children | 486 (100.0%) | 0 (0.0%) |
| 1 or 2 Children | 242 (100.0%) | 0 (0.0%) |
| 3 or 4 Children | 31 (100.0%) | 0 (0.0%) |
| 5 or more Children | 0 (0.0%) | 0 (0.0%) |
| Total | 759 (100.0%) | 0 (0.0%) |
Income Below Poverty Among Single-Parent Households in Alexandria
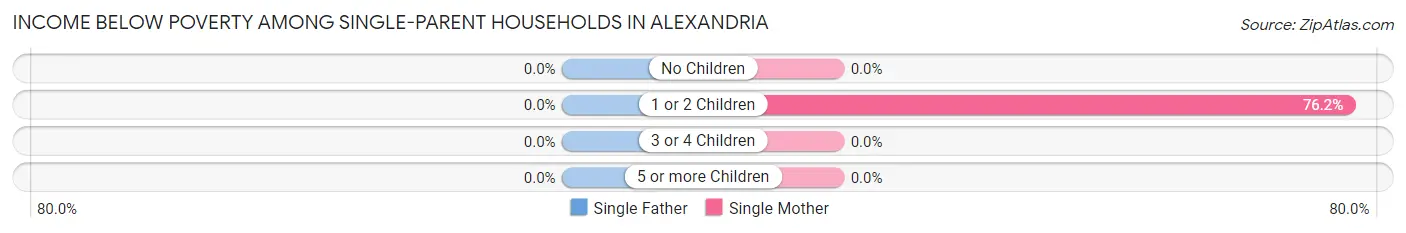
| Children | Single Father | Single Mother |
| No Children | 0 (0.0%) | 0 (0.0%) |
| 1 or 2 Children | 0 (0.0%) | 48 (76.2%) |
| 3 or 4 Children | 0 (0.0%) | 0 (0.0%) |
| 5 or more Children | 0 (0.0%) | 0 (0.0%) |
| Total | 0 (0.0%) | 48 (36.4%) |
Income Below Poverty Among Married-Couple vs Single-Parent Households in Alexandria
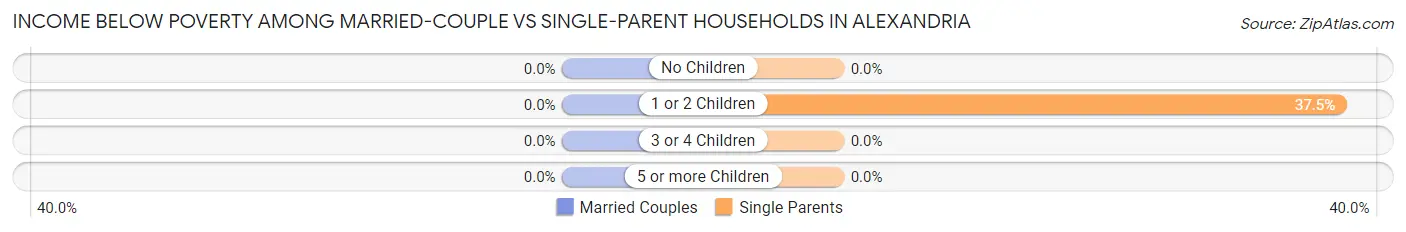
| Children | Married-Couple Families | Single-Parent Households |
| No Children | 0 (0.0%) | 0 (0.0%) |
| 1 or 2 Children | 0 (0.0%) | 48 (37.5%) |
| 3 or 4 Children | 0 (0.0%) | 0 (0.0%) |
| 5 or more Children | 0 (0.0%) | 0 (0.0%) |
| Total | 0 (0.0%) | 48 (17.9%) |
Race in Alexandria
The most populous races in Alexandria are White / Caucasian (3,079 | 82.2%), Black / African American (312 | 8.3%), and Hawaiian / Pacific (193 | 5.1%).
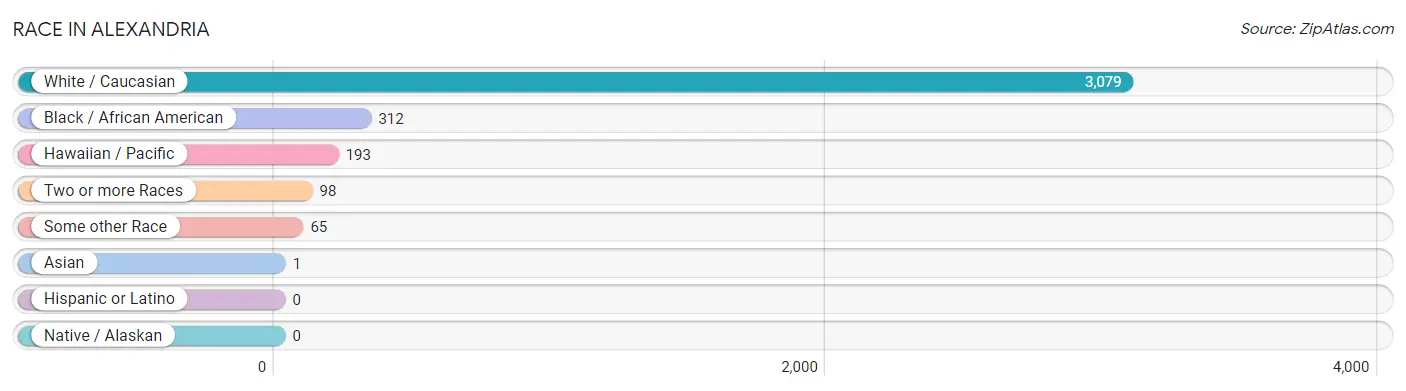
| Race | # Population | % Population |
| Asian | 1 | 0.0% |
| Black / African American | 312 | 8.3% |
| Hawaiian / Pacific | 193 | 5.1% |
| Hispanic or Latino | 0 | 0.0% |
| Native / Alaskan | 0 | 0.0% |
| White / Caucasian | 3,079 | 82.2% |
| Two or more Races | 98 | 2.6% |
| Some other Race | 65 | 1.7% |
| Total | 3,748 | 100.0% |
Ancestry in Alexandria
The most populous ancestries reported in Alexandria are American (800 | 21.3%), English (356 | 9.5%), Irish (310 | 8.3%), German (227 | 6.1%), and Guamanian / Chamorro (183 | 4.9%), together accounting for 50.0% of all Alexandria residents.
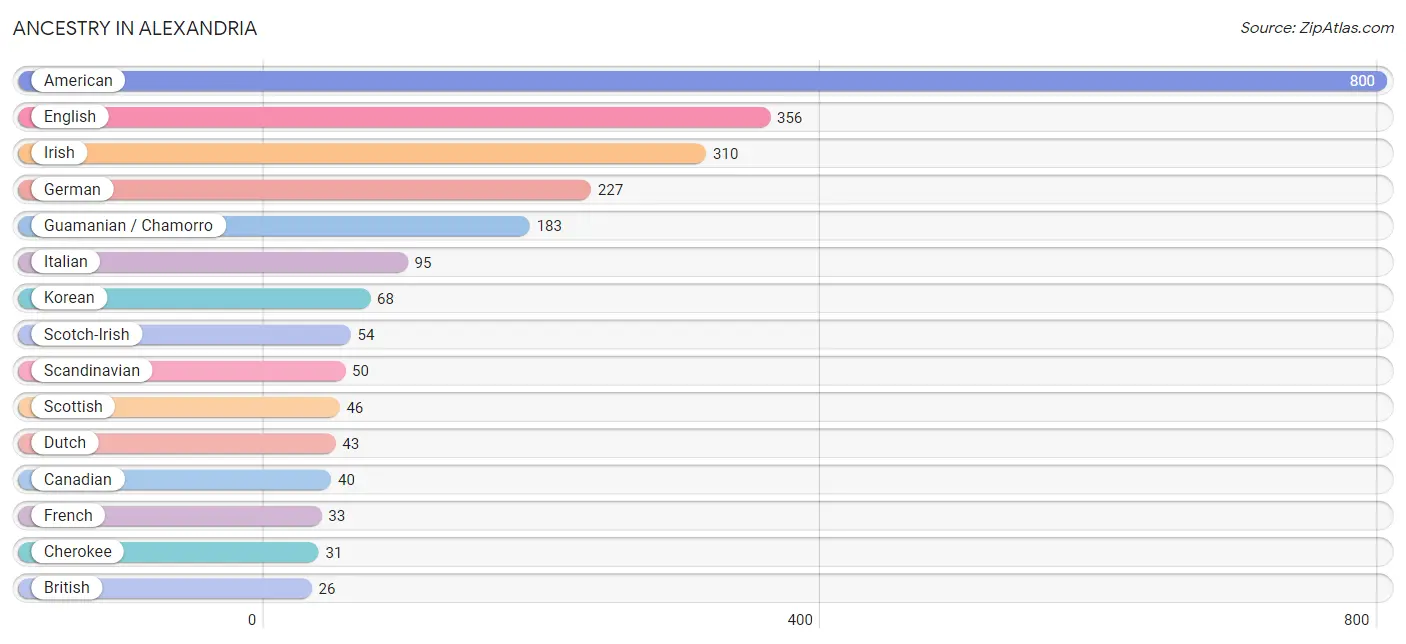
| Ancestry | # Population | % Population |
| American | 800 | 21.3% |
| British | 26 | 0.7% |
| Canadian | 40 | 1.1% |
| Cherokee | 31 | 0.8% |
| Dutch | 43 | 1.1% |
| English | 356 | 9.5% |
| French | 33 | 0.9% |
| German | 227 | 6.1% |
| Guamanian / Chamorro | 183 | 4.9% |
| Irish | 310 | 8.3% |
| Italian | 95 | 2.5% |
| Korean | 68 | 1.8% |
| Native Hawaiian | 10 | 0.3% |
| Norwegian | 23 | 0.6% |
| Scandinavian | 50 | 1.3% |
| Scotch-Irish | 54 | 1.4% |
| Scottish | 46 | 1.2% |
| Welsh | 23 | 0.6% | View All 18 Rows |
Immigrants in Alexandria
The most numerous immigrant groups reported in Alexandria came from Europe (26 | 0.7%), Germany (26 | 0.7%), Western Europe (26 | 0.7%), Asia (1 | 0.0%), and Philippines (1 | 0.0%), together accounting for 2.1% of all Alexandria residents.
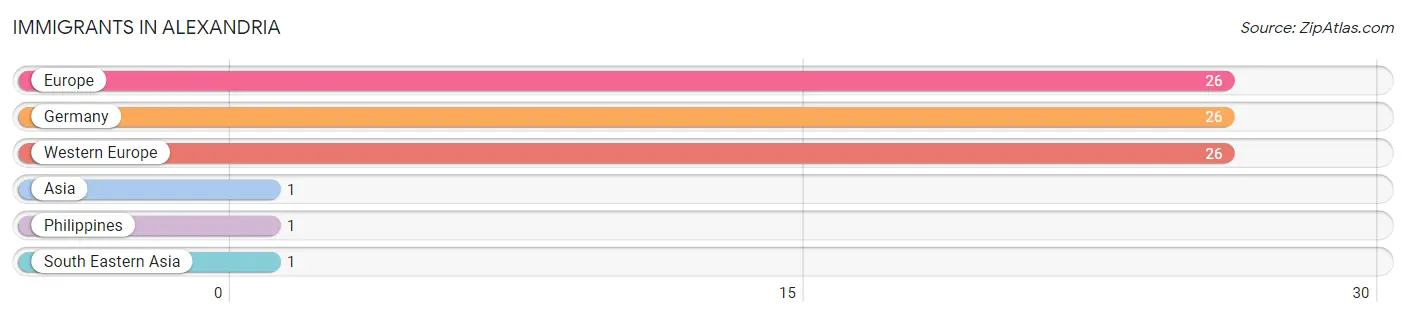
| Immigration Origin | # Population | % Population |
| Asia | 1 | 0.0% |
| Europe | 26 | 0.7% |
| Germany | 26 | 0.7% |
| Philippines | 1 | 0.0% |
| South Eastern Asia | 1 | 0.0% |
| Western Europe | 26 | 0.7% | View All 6 Rows |
Sex and Age in Alexandria
Sex and Age in Alexandria
The most populous age groups in Alexandria are 65 to 69 Years (184 | 10.4%) for men and 35 to 39 Years (249 | 12.5%) for women.
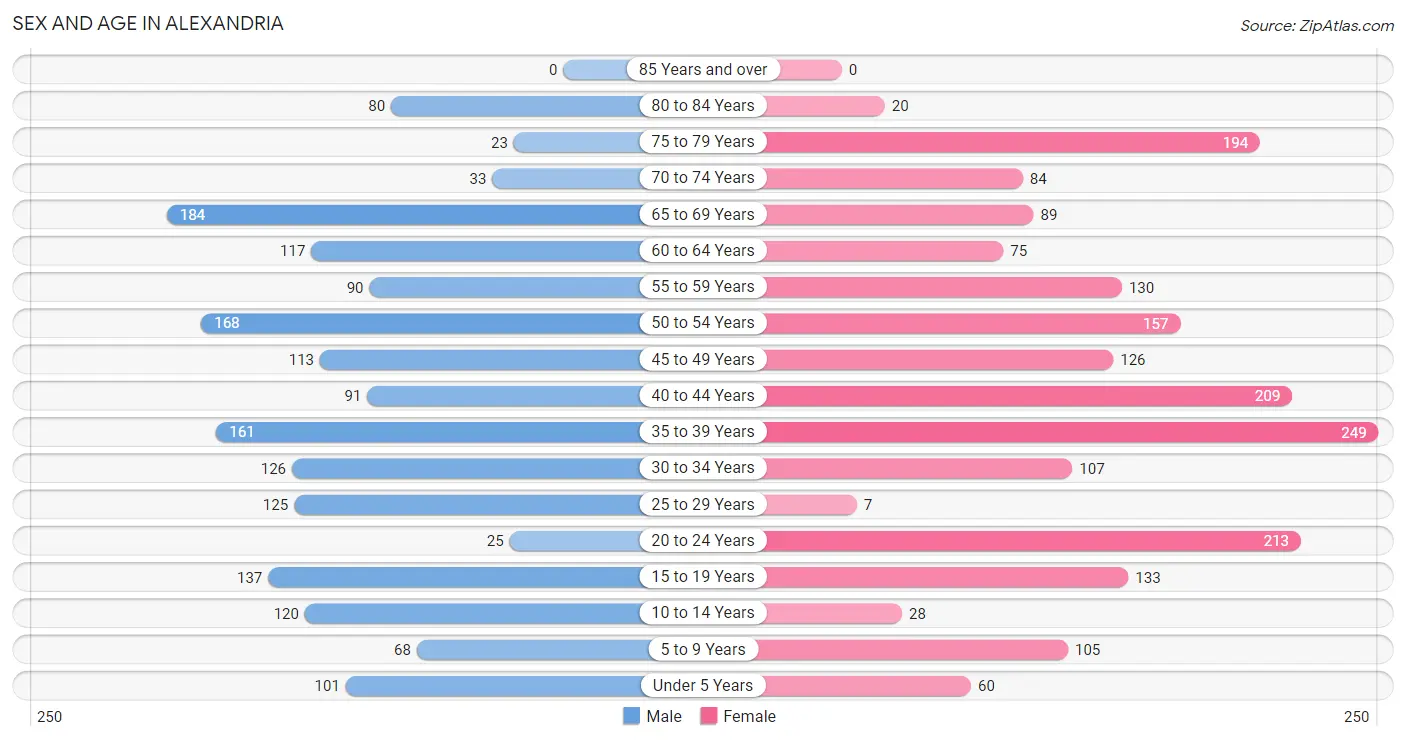
| Age Bracket | Male | Female |
| Under 5 Years | 101 (5.7%) | 60 (3.0%) |
| 5 to 9 Years | 68 (3.9%) | 105 (5.3%) |
| 10 to 14 Years | 120 (6.8%) | 28 (1.4%) |
| 15 to 19 Years | 137 (7.8%) | 133 (6.7%) |
| 20 to 24 Years | 25 (1.4%) | 213 (10.7%) |
| 25 to 29 Years | 125 (7.1%) | 7 (0.4%) |
| 30 to 34 Years | 126 (7.1%) | 107 (5.4%) |
| 35 to 39 Years | 161 (9.1%) | 249 (12.5%) |
| 40 to 44 Years | 91 (5.2%) | 209 (10.5%) |
| 45 to 49 Years | 113 (6.4%) | 126 (6.3%) |
| 50 to 54 Years | 168 (9.5%) | 157 (7.9%) |
| 55 to 59 Years | 90 (5.1%) | 130 (6.6%) |
| 60 to 64 Years | 117 (6.6%) | 75 (3.8%) |
| 65 to 69 Years | 184 (10.4%) | 89 (4.5%) |
| 70 to 74 Years | 33 (1.9%) | 84 (4.2%) |
| 75 to 79 Years | 23 (1.3%) | 194 (9.8%) |
| 80 to 84 Years | 80 (4.5%) | 20 (1.0%) |
| 85 Years and over | 0 (0.0%) | 0 (0.0%) |
| Total | 1,762 (100.0%) | 1,986 (100.0%) |
Families and Households in Alexandria
Median Family Size in Alexandria
The median family size in Alexandria is 3.30 persons per family, with single male/father families (136 | 13.2%) accounting for the largest median family size of 3.75 persons per family. On the other hand, single female/mother families (132 | 12.9%) represent the smallest median family size with 2.50 persons per family.
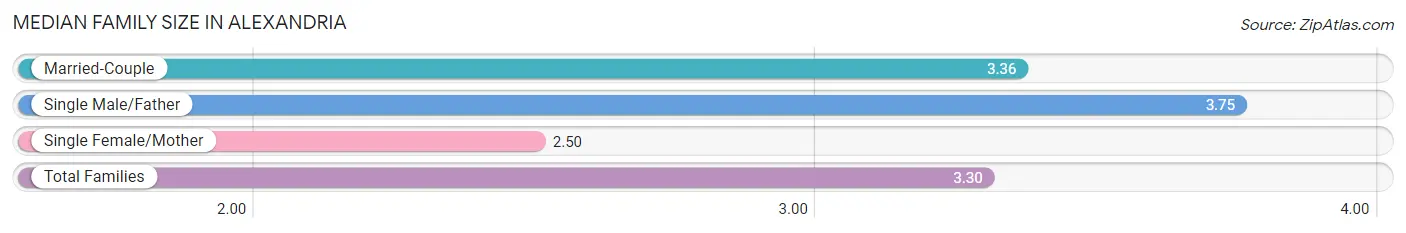
| Family Type | # Families | Family Size |
| Married-Couple | 759 (73.9%) | 3.36 |
| Single Male/Father | 136 (13.2%) | 3.75 |
| Single Female/Mother | 132 (12.9%) | 2.50 |
| Total Families | 1,027 (100.0%) | 3.30 |
Median Household Size in Alexandria
The median household size in Alexandria is 2.85 persons per household, with single male/father households (136 | 10.3%) accounting for the largest median household size of 3.75 persons per household. non-family households (290 | 22.0%) represent the smallest median household size with 1.06 persons per household.
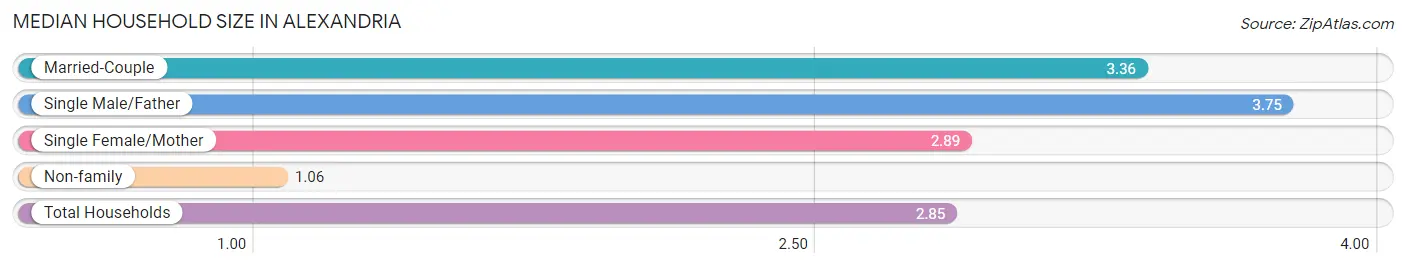
| Household Type | # Households | Household Size |
| Married-Couple | 759 (57.6%) | 3.36 |
| Single Male/Father | 136 (10.3%) | 3.75 |
| Single Female/Mother | 132 (10.0%) | 2.89 |
| Non-family | 290 (22.0%) | 1.06 |
| Total Households | 1,317 (100.0%) | 2.85 |
Household Size by Marriage Status in Alexandria
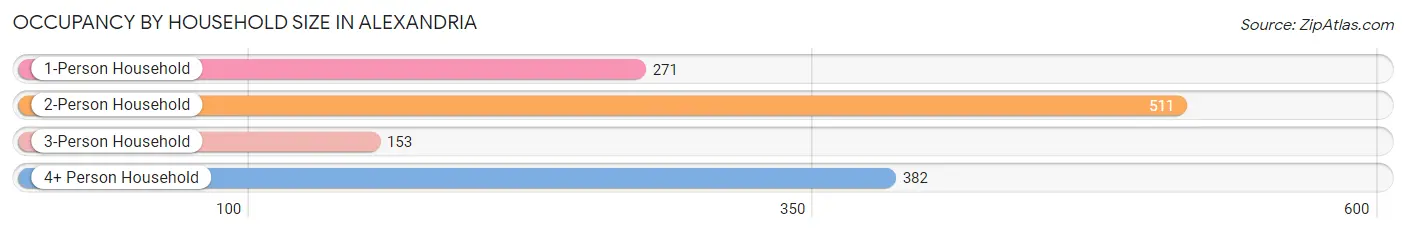
Out of a total of 1,317 households in Alexandria, 1,027 (78.0%) are family households, while 290 (22.0%) are nonfamily households. The most numerous type of family households are 2-person households, comprising 492, and the most common type of nonfamily households are 1-person households, comprising 271.
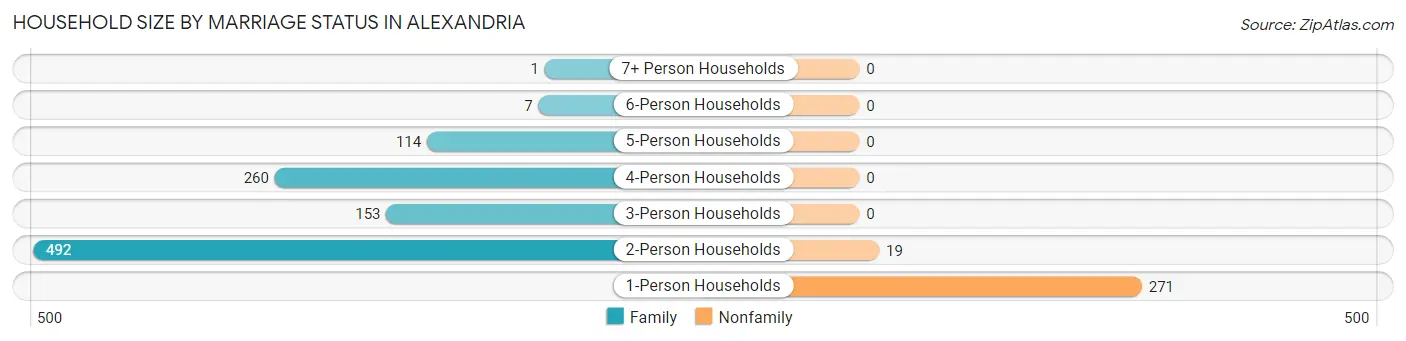
| Household Size | Family Households | Nonfamily Households |
| 1-Person Households | - | 271 (20.6%) |
| 2-Person Households | 492 (37.4%) | 19 (1.4%) |
| 3-Person Households | 153 (11.6%) | 0 (0.0%) |
| 4-Person Households | 260 (19.7%) | 0 (0.0%) |
| 5-Person Households | 114 (8.7%) | 0 (0.0%) |
| 6-Person Households | 7 (0.5%) | 0 (0.0%) |
| 7+ Person Households | 1 (0.1%) | 0 (0.0%) |
| Total | 1,027 (78.0%) | 290 (22.0%) |
Female Fertility in Alexandria
Fertility by Age in Alexandria
Average fertility rate in Alexandria is 51.0 births per 1,000 women. Women in the age bracket of 20 to 34 years have the highest fertility rate with 187.0 births per 1,000 women. Women in the age bracket of 20 to 34 years acount for 100.0% of all women with births.
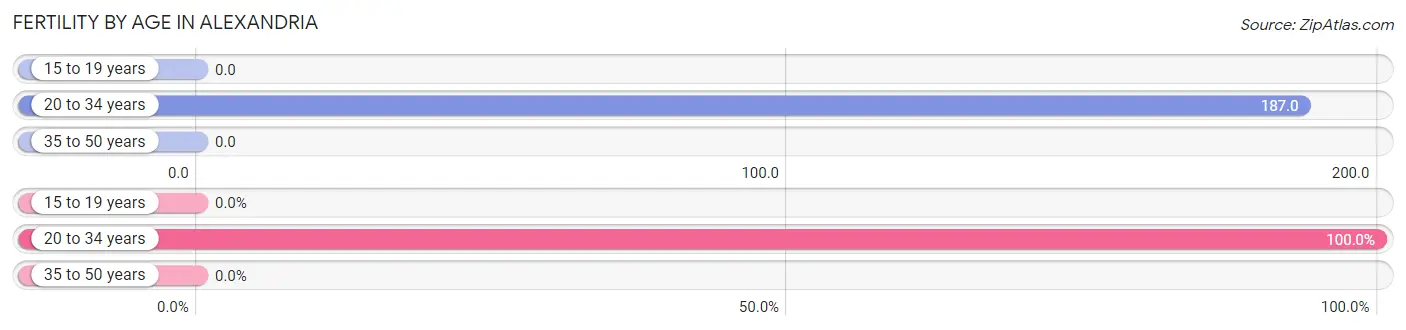
| Age Bracket | Women with Births | Births / 1,000 Women |
| 15 to 19 years | 0 (0.0%) | 0.0 |
| 20 to 34 years | 61 (100.0%) | 187.0 |
| 35 to 50 years | 0 (0.0%) | 0.0 |
| Total | 61 (100.0%) | 51.0 |
Fertility by Age by Marriage Status in Alexandria
16.4% of women with births (61) in Alexandria are married. The highest percentage of unmarried women with births falls into 20 to 34 years age bracket with 83.6% of them unmarried at the time of birth, while the lowest percentage of unmarried women with births belong to 20 to 34 years age bracket with 83.6% of them unmarried.
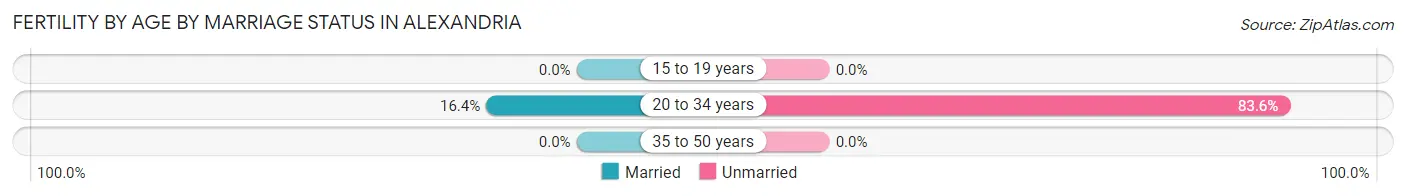
| Age Bracket | Married | Unmarried |
| 15 to 19 years | 0 (0.0%) | 0 (0.0%) |
| 20 to 34 years | 10 (16.4%) | 51 (83.6%) |
| 35 to 50 years | 0 (0.0%) | 0 (0.0%) |
| Total | 10 (16.4%) | 51 (83.6%) |
Fertility by Education in Alexandria
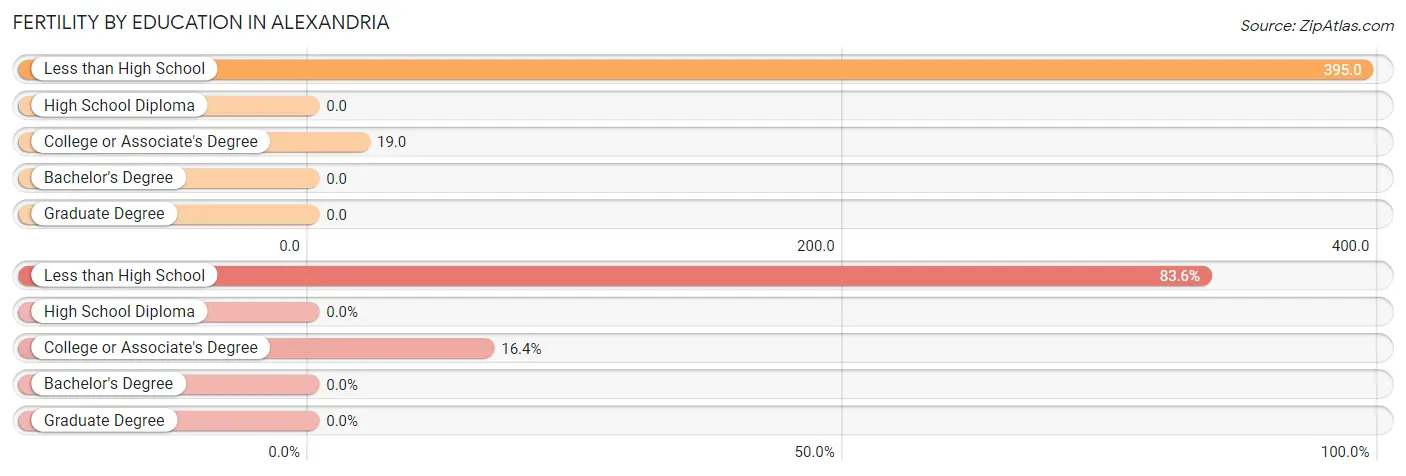
| Educational Attainment | Women with Births | Births / 1,000 Women |
| Less than High School | 51 (83.6%) | 395.0 |
| High School Diploma | 0 (0.0%) | 0.0 |
| College or Associate's Degree | 10 (16.4%) | 19.0 |
| Bachelor's Degree | 0 (0.0%) | 0.0 |
| Graduate Degree | 0 (0.0%) | 0.0 |
| Total | 61 (100.0%) | 51.0 |
Fertility by Education by Marriage Status in Alexandria
83.6% of women with births in Alexandria are unmarried. Women with the educational attainment of college or associate's degree are most likely to be married with 100.0% of them married at childbirth, while women with the educational attainment of less than high school are least likely to be married with 100.0% of them unmarried at childbirth.
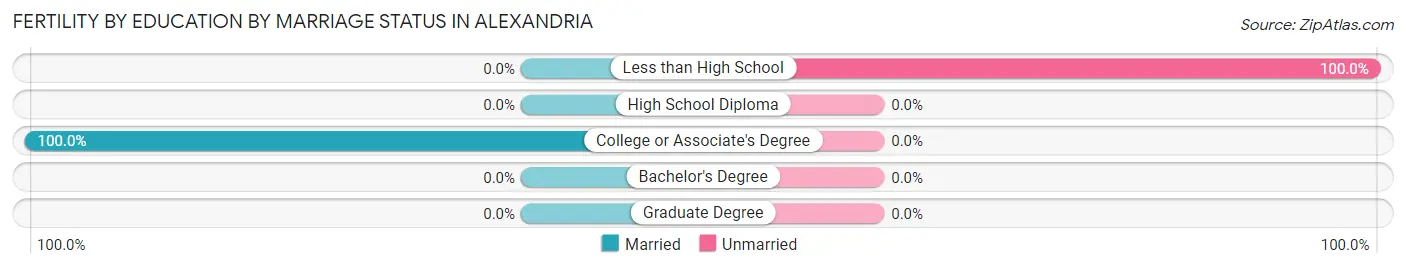
| Educational Attainment | Married | Unmarried |
| Less than High School | 0 (0.0%) | 51 (100.0%) |
| High School Diploma | 0 (0.0%) | 0 (0.0%) |
| College or Associate's Degree | 10 (100.0%) | 0 (0.0%) |
| Bachelor's Degree | 0 (0.0%) | 0 (0.0%) |
| Graduate Degree | 0 (0.0%) | 0 (0.0%) |
| Total | 10 (16.4%) | 51 (83.6%) |
Employment Characteristics in Alexandria
Employment by Class of Employer in Alexandria
Among the 1,926 employed individuals in Alexandria, private company employees (1,167 | 60.6%), federal government employees (403 | 20.9%), and local government employees (149 | 7.7%) make up the most common classes of employment.
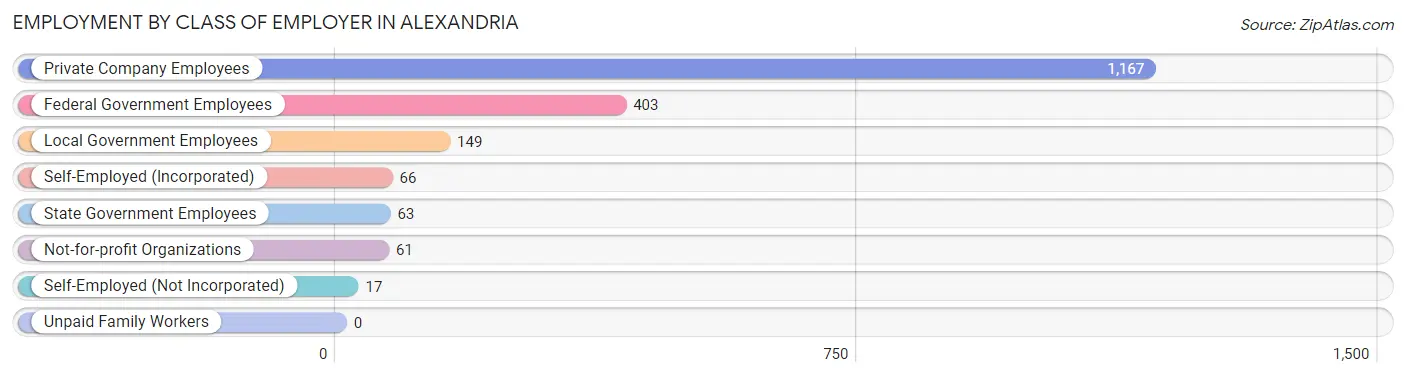
| Employer Class | # Employees | % Employees |
| Private Company Employees | 1,167 | 60.6% |
| Self-Employed (Incorporated) | 66 | 3.4% |
| Self-Employed (Not Incorporated) | 17 | 0.9% |
| Not-for-profit Organizations | 61 | 3.2% |
| Local Government Employees | 149 | 7.7% |
| State Government Employees | 63 | 3.3% |
| Federal Government Employees | 403 | 20.9% |
| Unpaid Family Workers | 0 | 0.0% |
| Total | 1,926 | 100.0% |
Employment Status by Age in Alexandria
According to the labor force statistics for Alexandria, out of the total population over 16 years of age (3,235), 60.7% or 1,964 individuals are in the labor force, with 0.9% or 18 of them unemployed. The age group with the highest labor force participation rate is 45 to 54 years, with 94.7% or 534 individuals in the labor force. Within the labor force, the 65 to 74 years age range has the highest percentage of unemployed individuals, with 12.7% or 16 of them being unemployed.
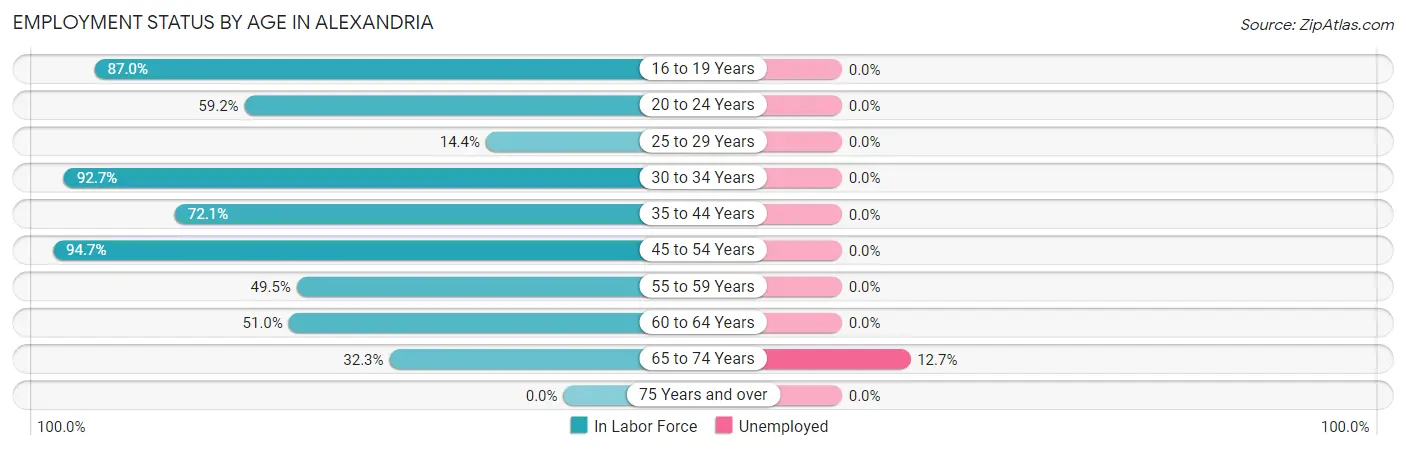
| Age Bracket | In Labor Force | Unemployed |
| 16 to 19 Years | 208 (87.0%) | 0 (0.0%) |
| 20 to 24 Years | 141 (59.2%) | 0 (0.0%) |
| 25 to 29 Years | 19 (14.4%) | 0 (0.0%) |
| 30 to 34 Years | 216 (92.7%) | 0 (0.0%) |
| 35 to 44 Years | 512 (72.1%) | 0 (0.0%) |
| 45 to 54 Years | 534 (94.7%) | 0 (0.0%) |
| 55 to 59 Years | 109 (49.5%) | 0 (0.0%) |
| 60 to 64 Years | 98 (51.0%) | 0 (0.0%) |
| 65 to 74 Years | 126 (32.3%) | 16 (12.7%) |
| 75 Years and over | 0 (0.0%) | 0 (0.0%) |
| Total | 1,964 (60.7%) | 18 (0.9%) |
Employment Status by Educational Attainment in Alexandria
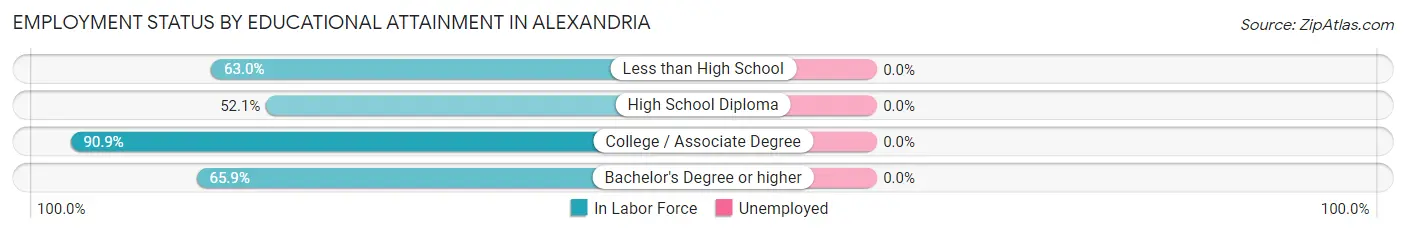
| Educational Attainment | In Labor Force | Unemployed |
| Less than High School | 102 (63.0%) | 0 (0.0%) |
| High School Diploma | 308 (52.1%) | 0 (0.0%) |
| College / Associate Degree | 809 (90.9%) | 0 (0.0%) |
| Bachelor's Degree or higher | 269 (65.9%) | 0 (0.0%) |
| Total | 1,487 (72.5%) | 0 (0.0%) |
Employment Occupations by Sex in Alexandria
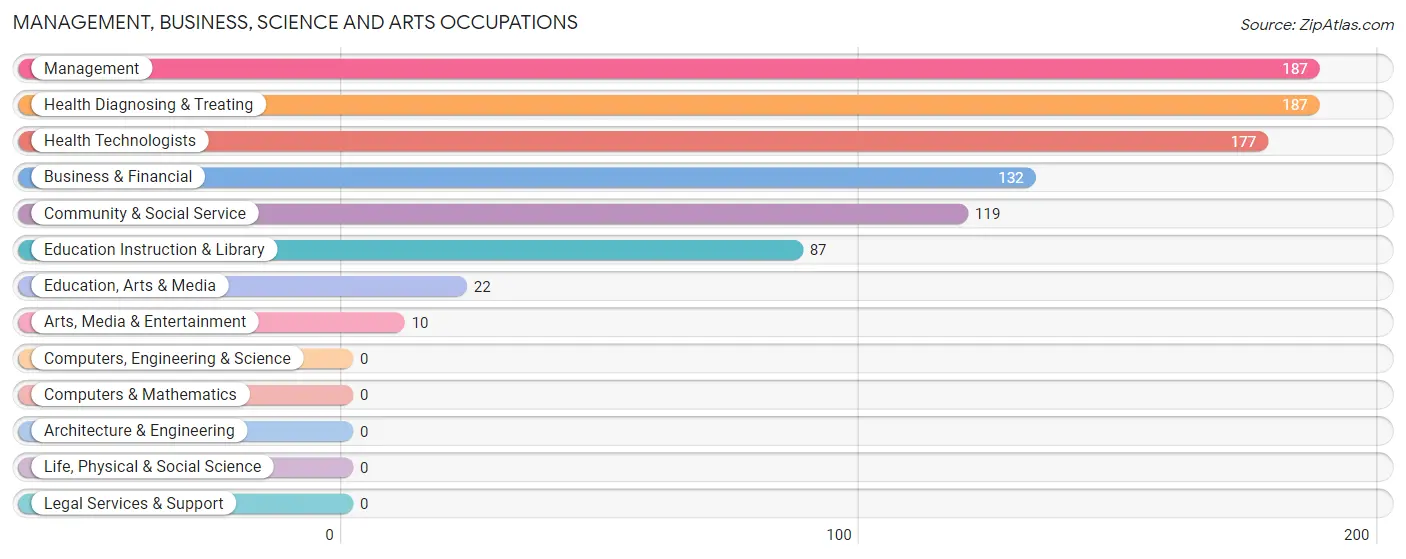
Management, Business, Science and Arts Occupations
The most common Management, Business, Science and Arts occupations in Alexandria are Management (187 | 10.1%), Health Diagnosing & Treating (187 | 10.1%), Health Technologists (177 | 9.6%), Business & Financial (132 | 7.1%), and Community & Social Service (119 | 6.4%).
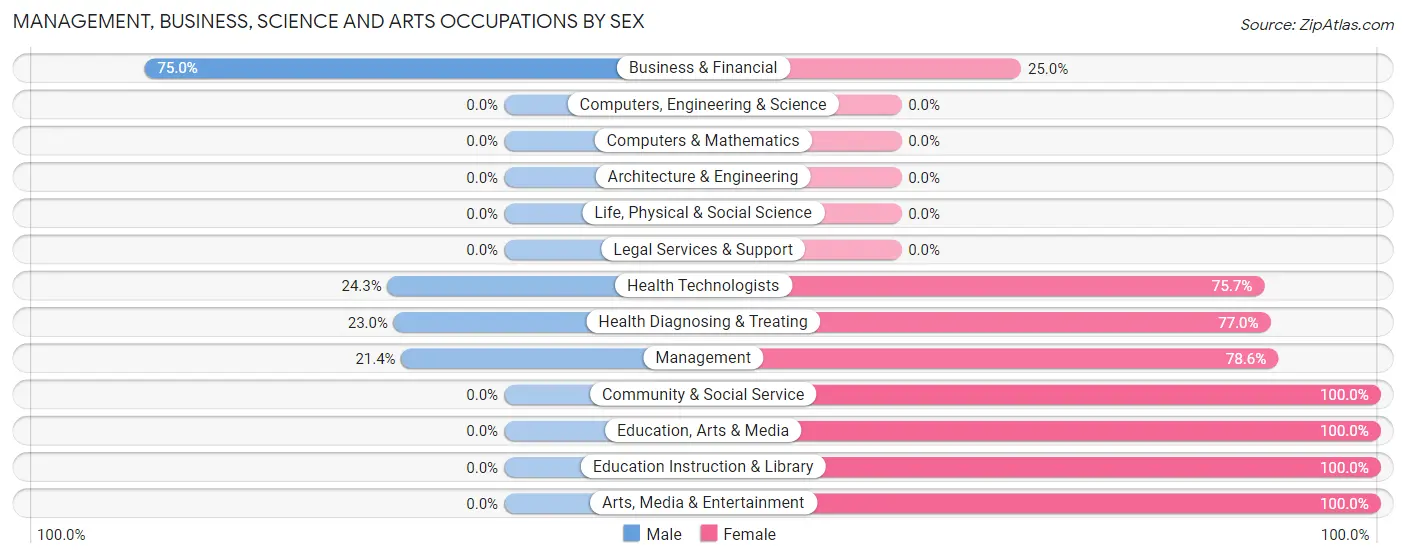
Management, Business, Science and Arts Occupations by Sex
Within the Management, Business, Science and Arts occupations in Alexandria, the most male-oriented occupations are Business & Financial (75.0%), Health Technologists (24.3%), and Health Diagnosing & Treating (23.0%), while the most female-oriented occupations are Community & Social Service (100.0%), Education, Arts & Media (100.0%), and Education Instruction & Library (100.0%).
| Occupation | Male | Female |
| Management | 40 (21.4%) | 147 (78.6%) |
| Business & Financial | 99 (75.0%) | 33 (25.0%) |
| Computers, Engineering & Science | 0 (0.0%) | 0 (0.0%) |
| Computers & Mathematics | 0 (0.0%) | 0 (0.0%) |
| Architecture & Engineering | 0 (0.0%) | 0 (0.0%) |
| Life, Physical & Social Science | 0 (0.0%) | 0 (0.0%) |
| Community & Social Service | 0 (0.0%) | 119 (100.0%) |
| Education, Arts & Media | 0 (0.0%) | 22 (100.0%) |
| Legal Services & Support | 0 (0.0%) | 0 (0.0%) |
| Education Instruction & Library | 0 (0.0%) | 87 (100.0%) |
| Arts, Media & Entertainment | 0 (0.0%) | 10 (100.0%) |
| Health Diagnosing & Treating | 43 (23.0%) | 144 (77.0%) |
| Health Technologists | 43 (24.3%) | 134 (75.7%) |
| Total (Category) | 182 (29.1%) | 443 (70.9%) |
| Total (Overall) | 875 (47.3%) | 973 (52.6%) |
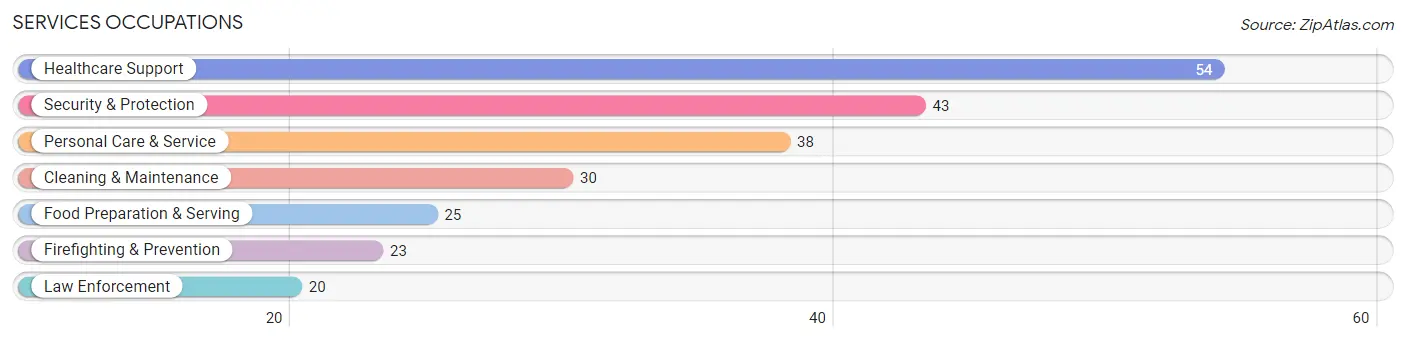
Services Occupations
The most common Services occupations in Alexandria are Healthcare Support (54 | 2.9%), Security & Protection (43 | 2.3%), Personal Care & Service (38 | 2.1%), Cleaning & Maintenance (30 | 1.6%), and Food Preparation & Serving (25 | 1.3%).
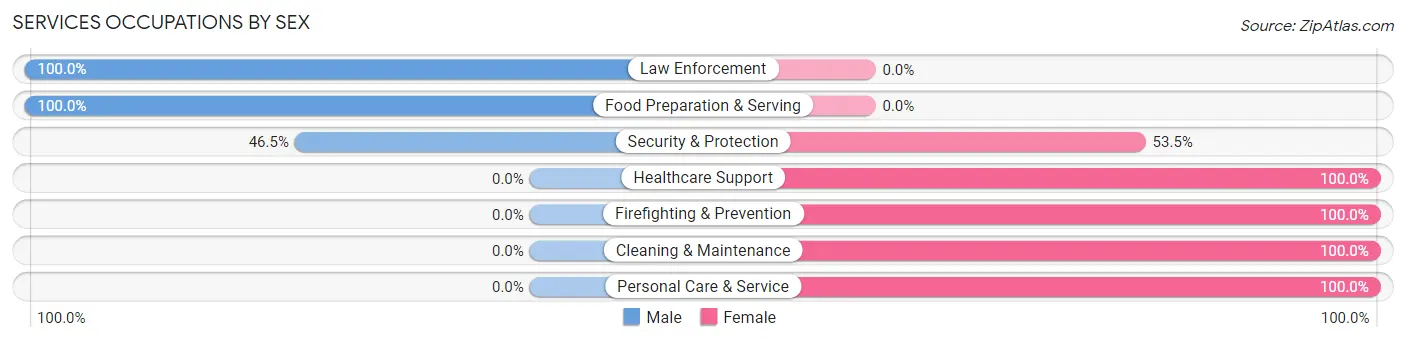
Services Occupations by Sex
Within the Services occupations in Alexandria, the most male-oriented occupations are Law Enforcement (100.0%), Food Preparation & Serving (100.0%), and Security & Protection (46.5%), while the most female-oriented occupations are Healthcare Support (100.0%), Firefighting & Prevention (100.0%), and Cleaning & Maintenance (100.0%).
| Occupation | Male | Female |
| Healthcare Support | 0 (0.0%) | 54 (100.0%) |
| Security & Protection | 20 (46.5%) | 23 (53.5%) |
| Firefighting & Prevention | 0 (0.0%) | 23 (100.0%) |
| Law Enforcement | 20 (100.0%) | 0 (0.0%) |
| Food Preparation & Serving | 25 (100.0%) | 0 (0.0%) |
| Cleaning & Maintenance | 0 (0.0%) | 30 (100.0%) |
| Personal Care & Service | 0 (0.0%) | 38 (100.0%) |
| Total (Category) | 45 (23.7%) | 145 (76.3%) |
| Total (Overall) | 875 (47.3%) | 973 (52.6%) |
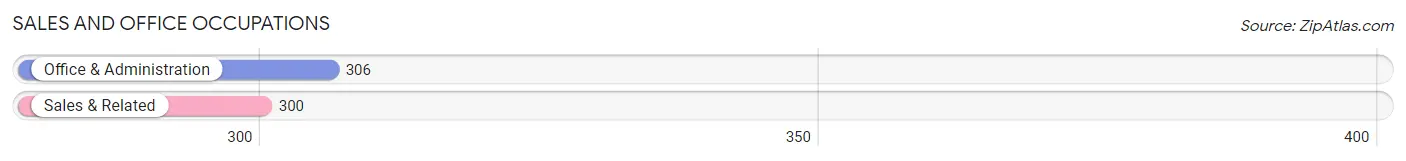
Sales and Office Occupations
The most common Sales and Office occupations in Alexandria are Office & Administration (306 | 16.6%), and Sales & Related (300 | 16.2%).
Sales and Office Occupations by Sex
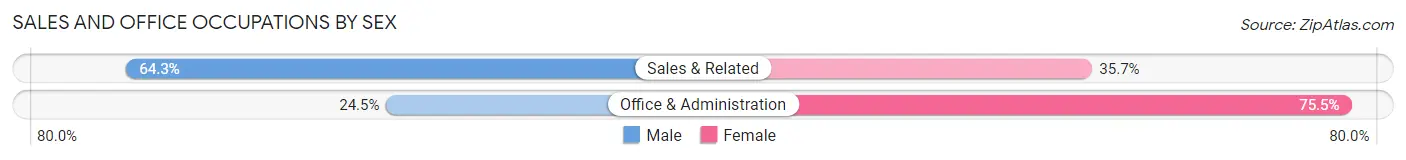
| Occupation | Male | Female |
| Sales & Related | 193 (64.3%) | 107 (35.7%) |
| Office & Administration | 75 (24.5%) | 231 (75.5%) |
| Total (Category) | 268 (44.2%) | 338 (55.8%) |
| Total (Overall) | 875 (47.3%) | 973 (52.6%) |
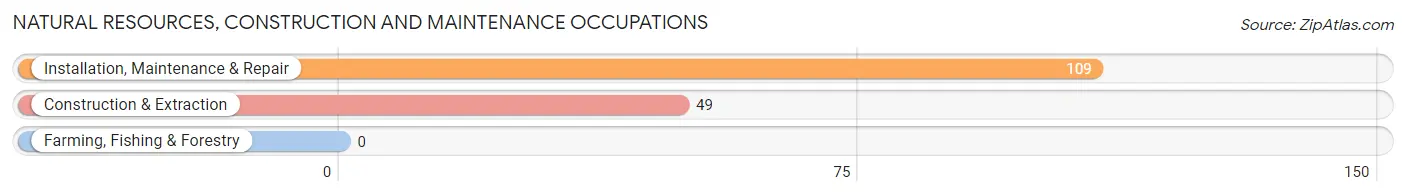
Natural Resources, Construction and Maintenance Occupations
The most common Natural Resources, Construction and Maintenance occupations in Alexandria are Installation, Maintenance & Repair (109 | 5.9%), and Construction & Extraction (49 | 2.6%).
Natural Resources, Construction and Maintenance Occupations by Sex
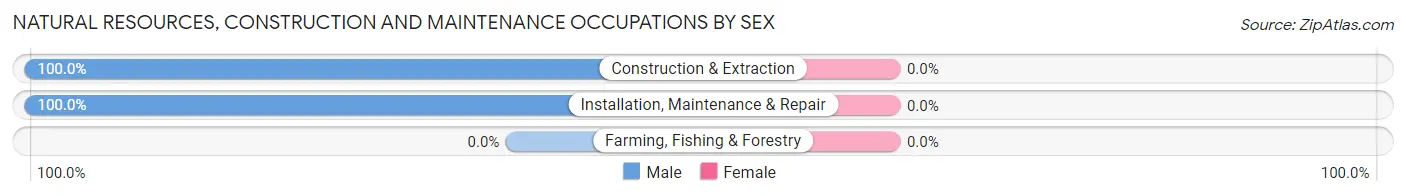
| Occupation | Male | Female |
| Farming, Fishing & Forestry | 0 (0.0%) | 0 (0.0%) |
| Construction & Extraction | 49 (100.0%) | 0 (0.0%) |
| Installation, Maintenance & Repair | 109 (100.0%) | 0 (0.0%) |
| Total (Category) | 158 (100.0%) | 0 (0.0%) |
| Total (Overall) | 875 (47.3%) | 973 (52.6%) |
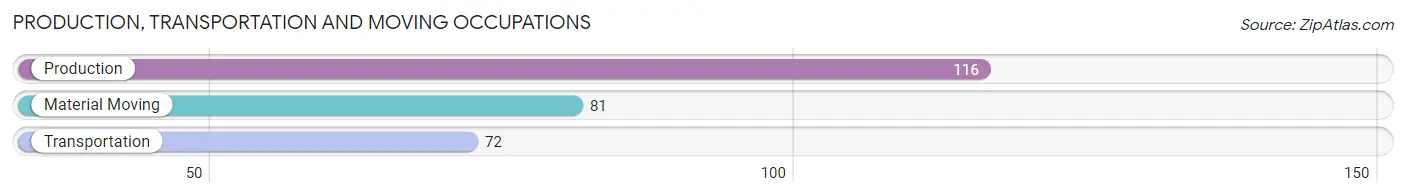
Production, Transportation and Moving Occupations
The most common Production, Transportation and Moving occupations in Alexandria are Production (116 | 6.3%), Material Moving (81 | 4.4%), and Transportation (72 | 3.9%).
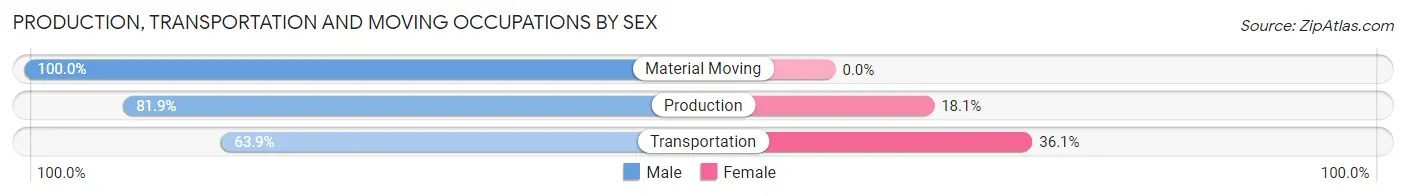
Production, Transportation and Moving Occupations by Sex
| Occupation | Male | Female |
| Production | 95 (81.9%) | 21 (18.1%) |
| Transportation | 46 (63.9%) | 26 (36.1%) |
| Material Moving | 81 (100.0%) | 0 (0.0%) |
| Total (Category) | 222 (82.5%) | 47 (17.5%) |
| Total (Overall) | 875 (47.3%) | 973 (52.6%) |
Employment Industries by Sex in Alexandria
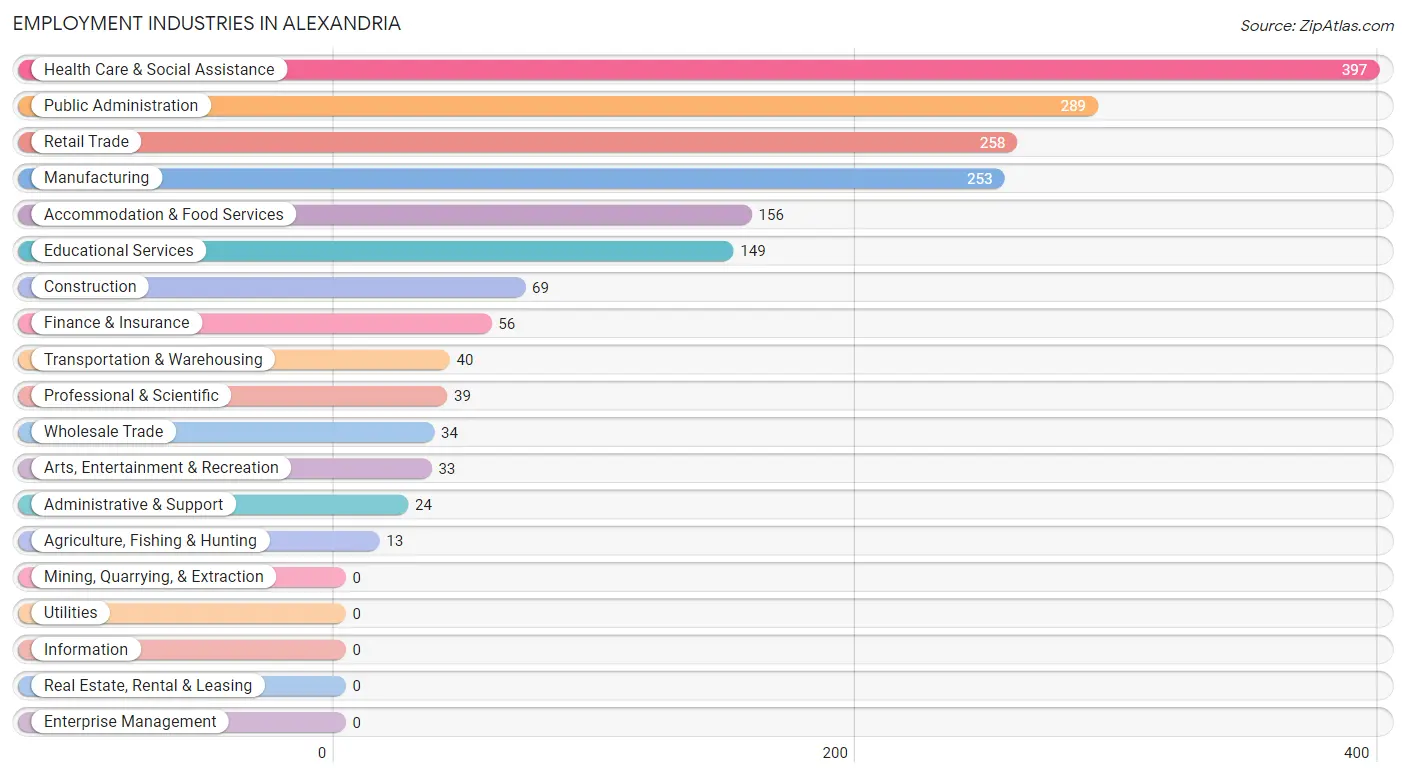
Employment Industries in Alexandria
The major employment industries in Alexandria include Health Care & Social Assistance (397 | 21.5%), Public Administration (289 | 15.6%), Retail Trade (258 | 14.0%), Manufacturing (253 | 13.7%), and Accommodation & Food Services (156 | 8.4%).
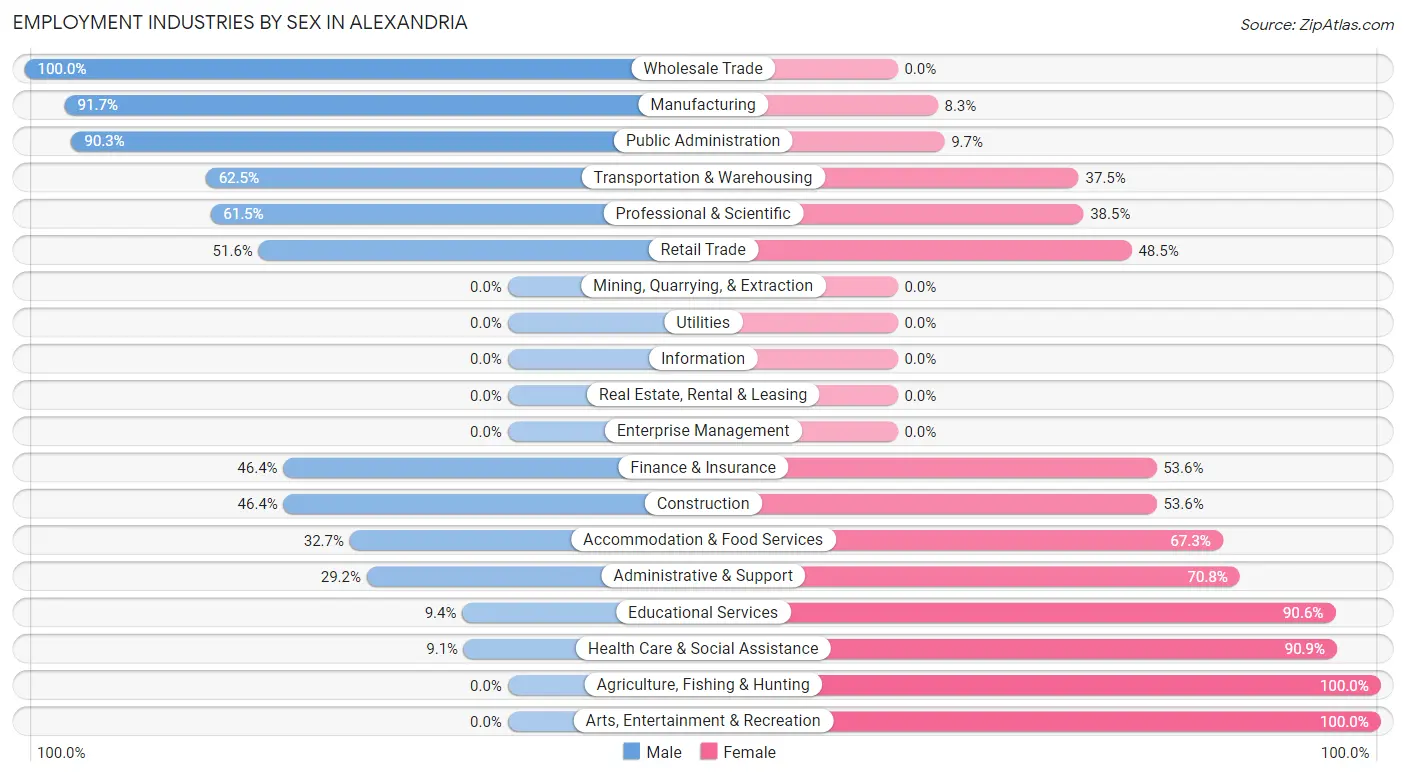
Employment Industries by Sex in Alexandria
The Alexandria industries that see more men than women are Wholesale Trade (100.0%), Manufacturing (91.7%), and Public Administration (90.3%), whereas the industries that tend to have a higher number of women are Agriculture, Fishing & Hunting (100.0%), Arts, Entertainment & Recreation (100.0%), and Health Care & Social Assistance (90.9%).
| Industry | Male | Female |
| Agriculture, Fishing & Hunting | 0 (0.0%) | 13 (100.0%) |
| Mining, Quarrying, & Extraction | 0 (0.0%) | 0 (0.0%) |
| Construction | 32 (46.4%) | 37 (53.6%) |
| Manufacturing | 232 (91.7%) | 21 (8.3%) |
| Wholesale Trade | 34 (100.0%) | 0 (0.0%) |
| Retail Trade | 133 (51.5%) | 125 (48.4%) |
| Transportation & Warehousing | 25 (62.5%) | 15 (37.5%) |
| Utilities | 0 (0.0%) | 0 (0.0%) |
| Information | 0 (0.0%) | 0 (0.0%) |
| Finance & Insurance | 26 (46.4%) | 30 (53.6%) |
| Real Estate, Rental & Leasing | 0 (0.0%) | 0 (0.0%) |
| Professional & Scientific | 24 (61.5%) | 15 (38.5%) |
| Enterprise Management | 0 (0.0%) | 0 (0.0%) |
| Administrative & Support | 7 (29.2%) | 17 (70.8%) |
| Educational Services | 14 (9.4%) | 135 (90.6%) |
| Health Care & Social Assistance | 36 (9.1%) | 361 (90.9%) |
| Arts, Entertainment & Recreation | 0 (0.0%) | 33 (100.0%) |
| Accommodation & Food Services | 51 (32.7%) | 105 (67.3%) |
| Public Administration | 261 (90.3%) | 28 (9.7%) |
| Total | 875 (47.3%) | 973 (52.6%) |
Education in Alexandria
School Enrollment in Alexandria
The most common levels of schooling among the 665 students in Alexandria are college / undergraduate (236 | 35.5%), elementary school (145 | 21.8%), and middle school (113 | 17.0%).
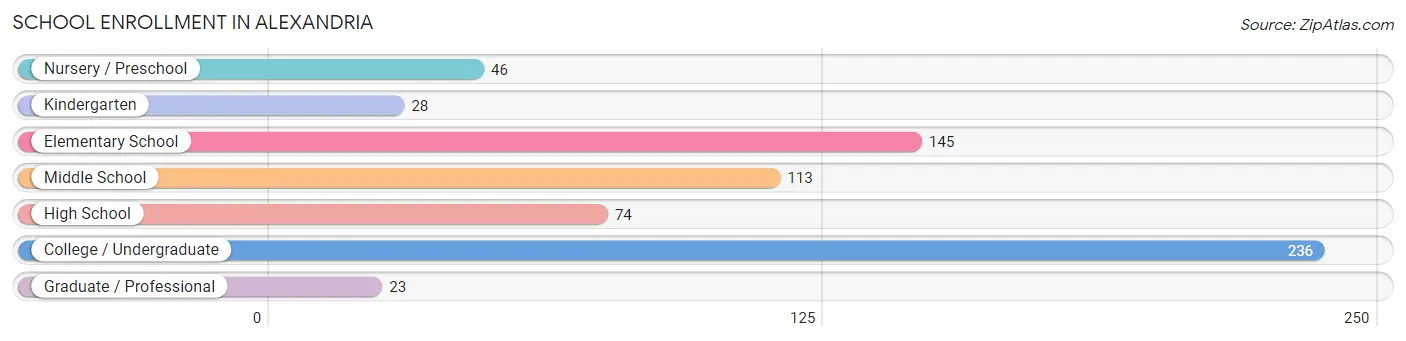
| School Level | # Students | % Students |
| Nursery / Preschool | 46 | 6.9% |
| Kindergarten | 28 | 4.2% |
| Elementary School | 145 | 21.8% |
| Middle School | 113 | 17.0% |
| High School | 74 | 11.1% |
| College / Undergraduate | 236 | 35.5% |
| Graduate / Professional | 23 | 3.5% |
| Total | 665 | 100.0% |
School Enrollment by Age by Funding Source in Alexandria
Out of a total of 665 students who are enrolled in schools in Alexandria, 20 (3.0%) attend a private institution, while the remaining 645 (97.0%) are enrolled in public schools. The age group of 15 to 17 year olds has the highest likelihood of being enrolled in private schools, with 10 (7.7% in the age bracket) enrolled. Conversely, the age group of 3 to 4 year olds has the lowest likelihood of being enrolled in a private school, with 25 (100.0% in the age bracket) attending a public institution.
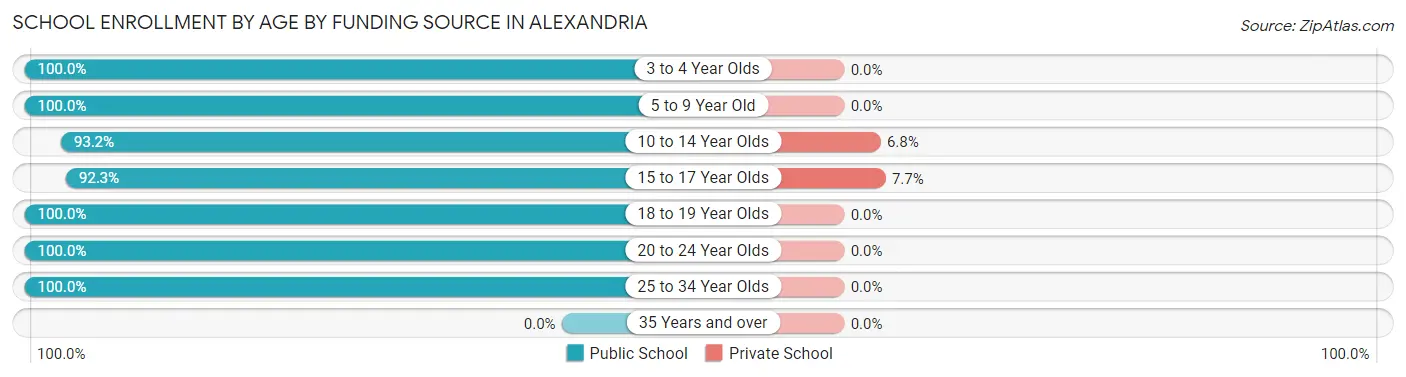
| Age Bracket | Public School | Private School |
| 3 to 4 Year Olds | 25 (100.0%) | 0 (0.0%) |
| 5 to 9 Year Old | 173 (100.0%) | 0 (0.0%) |
| 10 to 14 Year Olds | 138 (93.2%) | 10 (6.8%) |
| 15 to 17 Year Olds | 120 (92.3%) | 10 (7.7%) |
| 18 to 19 Year Olds | 24 (100.0%) | 0 (0.0%) |
| 20 to 24 Year Olds | 141 (100.0%) | 0 (0.0%) |
| 25 to 34 Year Olds | 24 (100.0%) | 0 (0.0%) |
| 35 Years and over | 0 (0.0%) | 0 (0.0%) |
| Total | 645 (97.0%) | 20 (3.0%) |
Educational Attainment by Field of Study in Alexandria
Science & technology (163 | 29.7%), business (152 | 27.7%), education (50 | 9.1%), physical & health sciences (40 | 7.3%), and literature & languages (26 | 4.7%) are the most common fields of study among 549 individuals in Alexandria who have obtained a bachelor's degree or higher.
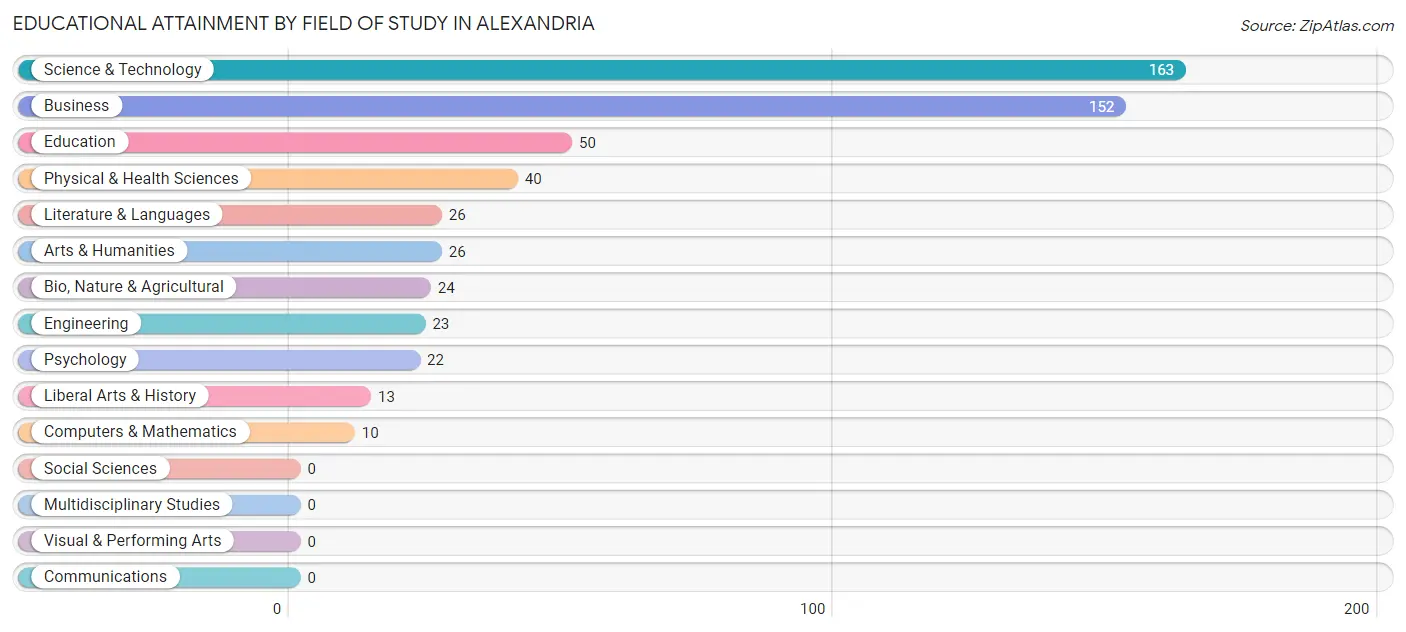
| Field of Study | # Graduates | % Graduates |
| Computers & Mathematics | 10 | 1.8% |
| Bio, Nature & Agricultural | 24 | 4.4% |
| Physical & Health Sciences | 40 | 7.3% |
| Psychology | 22 | 4.0% |
| Social Sciences | 0 | 0.0% |
| Engineering | 23 | 4.2% |
| Multidisciplinary Studies | 0 | 0.0% |
| Science & Technology | 163 | 29.7% |
| Business | 152 | 27.7% |
| Education | 50 | 9.1% |
| Literature & Languages | 26 | 4.7% |
| Liberal Arts & History | 13 | 2.4% |
| Visual & Performing Arts | 0 | 0.0% |
| Communications | 0 | 0.0% |
| Arts & Humanities | 26 | 4.7% |
| Total | 549 | 100.0% |
Transportation & Commute in Alexandria
Vehicle Availability by Sex in Alexandria
The most prevalent vehicle ownership categories in Alexandria are males with 3 vehicles (455, accounting for 46.7%) and females with 3 vehicles (285, making up 47.8%).
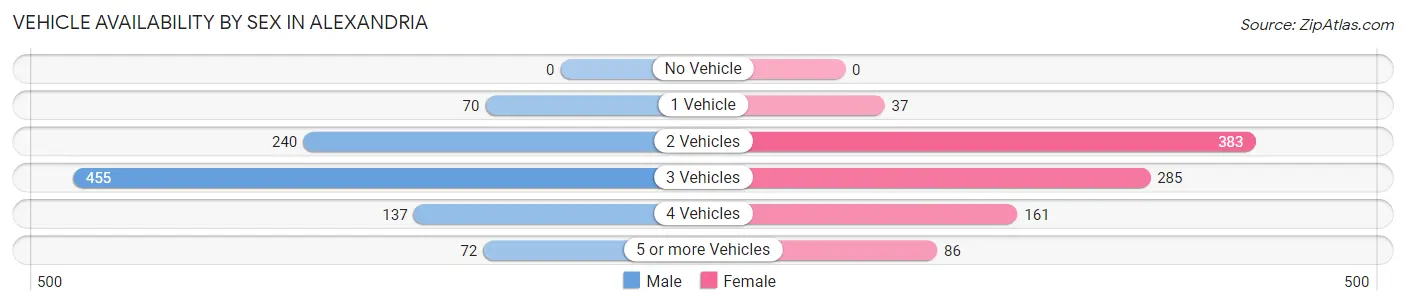
| Vehicles Available | Male | Female |
| No Vehicle | 0 (0.0%) | 0 (0.0%) |
| 1 Vehicle | 70 (7.2%) | 37 (3.9%) |
| 2 Vehicles | 240 (24.6%) | 383 (40.2%) |
| 3 Vehicles | 455 (46.7%) | 285 (29.9%) |
| 4 Vehicles | 137 (14.1%) | 161 (16.9%) |
| 5 or more Vehicles | 72 (7.4%) | 86 (9.0%) |
| Total | 974 (100.0%) | 952 (100.0%) |
Commute Time in Alexandria
The most frequently occuring commute durations in Alexandria are 30 to 34 minutes (415 commuters, 23.0%), 15 to 19 minutes (400 commuters, 22.2%), and 25 to 29 minutes (247 commuters, 13.7%).
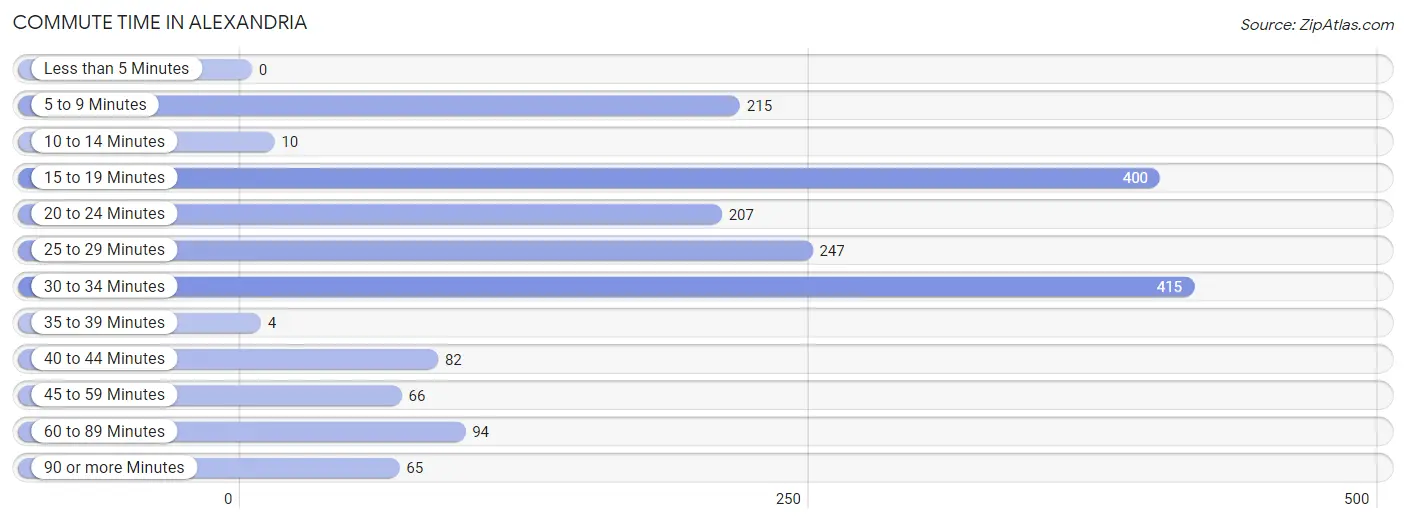
| Commute Time | # Commuters | % Commuters |
| Less than 5 Minutes | 0 | 0.0% |
| 5 to 9 Minutes | 215 | 11.9% |
| 10 to 14 Minutes | 10 | 0.5% |
| 15 to 19 Minutes | 400 | 22.2% |
| 20 to 24 Minutes | 207 | 11.5% |
| 25 to 29 Minutes | 247 | 13.7% |
| 30 to 34 Minutes | 415 | 23.0% |
| 35 to 39 Minutes | 4 | 0.2% |
| 40 to 44 Minutes | 82 | 4.5% |
| 45 to 59 Minutes | 66 | 3.7% |
| 60 to 89 Minutes | 94 | 5.2% |
| 90 or more Minutes | 65 | 3.6% |
Commute Time by Sex in Alexandria
The most common commute times in Alexandria are 30 to 34 minutes (242 commuters, 26.4%) for males and 5 to 9 minutes (198 commuters, 22.3%) for females.
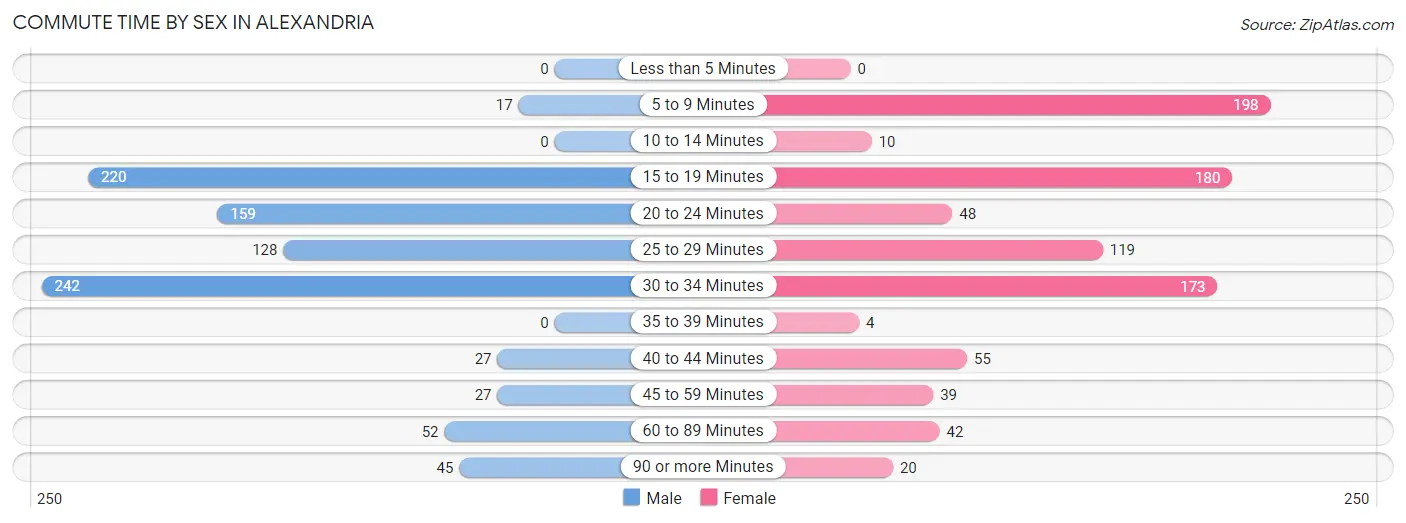
| Commute Time | Male | Female |
| Less than 5 Minutes | 0 (0.0%) | 0 (0.0%) |
| 5 to 9 Minutes | 17 (1.8%) | 198 (22.3%) |
| 10 to 14 Minutes | 0 (0.0%) | 10 (1.1%) |
| 15 to 19 Minutes | 220 (24.0%) | 180 (20.3%) |
| 20 to 24 Minutes | 159 (17.3%) | 48 (5.4%) |
| 25 to 29 Minutes | 128 (14.0%) | 119 (13.4%) |
| 30 to 34 Minutes | 242 (26.4%) | 173 (19.5%) |
| 35 to 39 Minutes | 0 (0.0%) | 4 (0.4%) |
| 40 to 44 Minutes | 27 (2.9%) | 55 (6.2%) |
| 45 to 59 Minutes | 27 (2.9%) | 39 (4.4%) |
| 60 to 89 Minutes | 52 (5.7%) | 42 (4.7%) |
| 90 or more Minutes | 45 (4.9%) | 20 (2.2%) |
Time of Departure to Work by Sex in Alexandria
The most frequent times of departure to work in Alexandria are 5:30 AM to 5:59 AM (222, 24.2%) for males and 7:00 AM to 7:29 AM (190, 21.4%) for females.
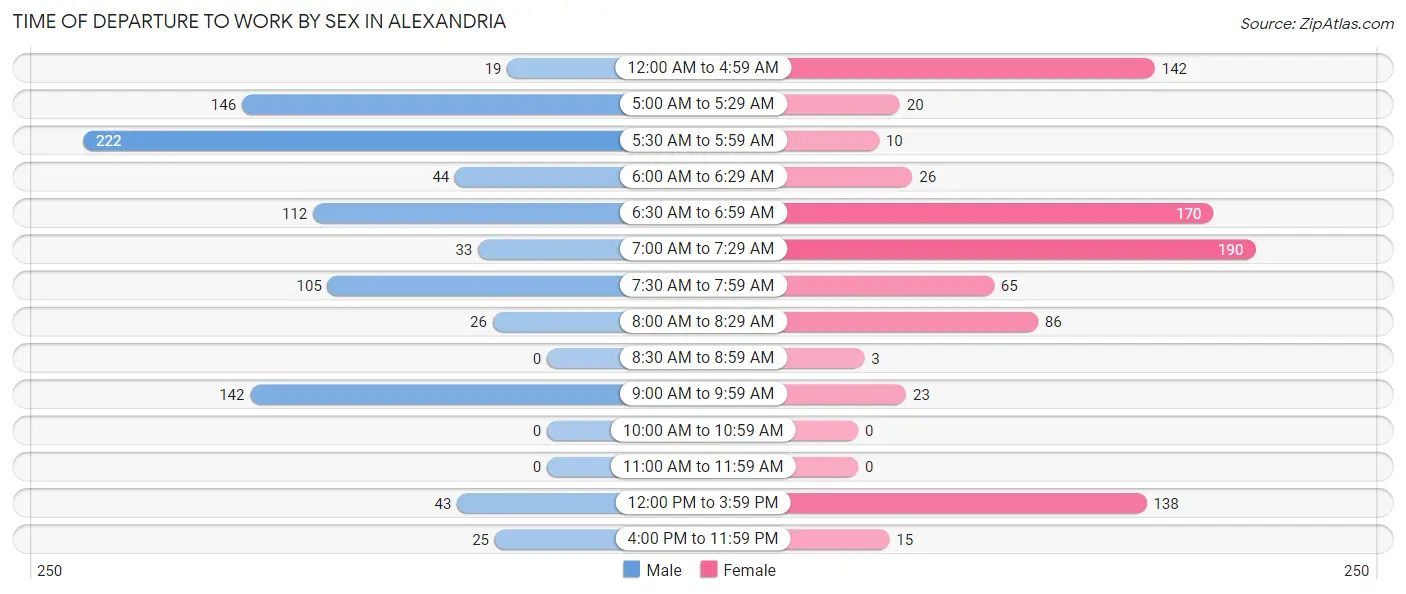
| Time of Departure | Male | Female |
| 12:00 AM to 4:59 AM | 19 (2.1%) | 142 (16.0%) |
| 5:00 AM to 5:29 AM | 146 (15.9%) | 20 (2.2%) |
| 5:30 AM to 5:59 AM | 222 (24.2%) | 10 (1.1%) |
| 6:00 AM to 6:29 AM | 44 (4.8%) | 26 (2.9%) |
| 6:30 AM to 6:59 AM | 112 (12.2%) | 170 (19.1%) |
| 7:00 AM to 7:29 AM | 33 (3.6%) | 190 (21.4%) |
| 7:30 AM to 7:59 AM | 105 (11.5%) | 65 (7.3%) |
| 8:00 AM to 8:29 AM | 26 (2.8%) | 86 (9.7%) |
| 8:30 AM to 8:59 AM | 0 (0.0%) | 3 (0.3%) |
| 9:00 AM to 9:59 AM | 142 (15.5%) | 23 (2.6%) |
| 10:00 AM to 10:59 AM | 0 (0.0%) | 0 (0.0%) |
| 11:00 AM to 11:59 AM | 0 (0.0%) | 0 (0.0%) |
| 12:00 PM to 3:59 PM | 43 (4.7%) | 138 (15.5%) |
| 4:00 PM to 11:59 PM | 25 (2.7%) | 15 (1.7%) |
| Total | 917 (100.0%) | 888 (100.0%) |
Housing Occupancy in Alexandria
Occupancy by Ownership in Alexandria
Of the total 1,317 dwellings in Alexandria, owner-occupied units account for 1,157 (87.8%), while renter-occupied units make up 160 (12.1%).
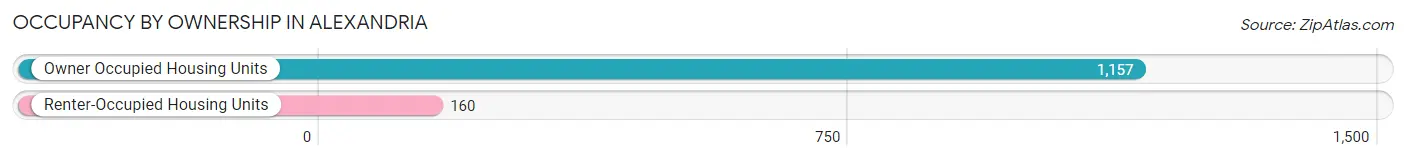
| Occupancy | # Housing Units | % Housing Units |
| Owner Occupied Housing Units | 1,157 | 87.8% |
| Renter-Occupied Housing Units | 160 | 12.1% |
| Total Occupied Housing Units | 1,317 | 100.0% |
Occupancy by Household Size in Alexandria
| Household Size | # Housing Units | % Housing Units |
| 1-Person Household | 271 | 20.6% |
| 2-Person Household | 511 | 38.8% |
| 3-Person Household | 153 | 11.6% |
| 4+ Person Household | 382 | 29.0% |
| Total Housing Units | 1,317 | 100.0% |
Occupancy by Ownership by Household Size in Alexandria
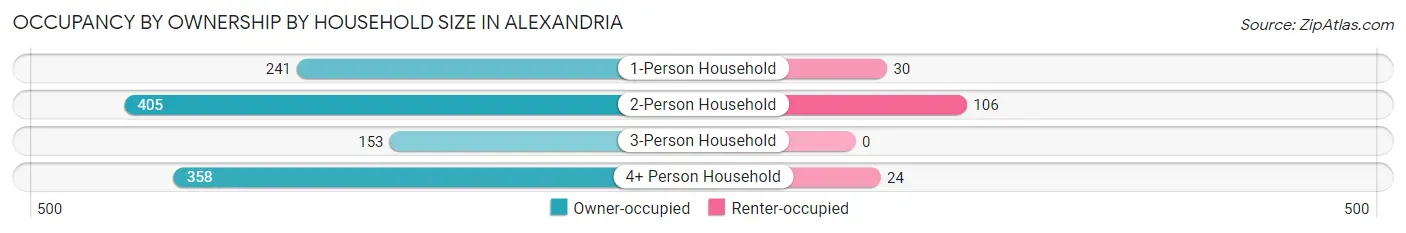
| Household Size | Owner-occupied | Renter-occupied |
| 1-Person Household | 241 (88.9%) | 30 (11.1%) |
| 2-Person Household | 405 (79.3%) | 106 (20.7%) |
| 3-Person Household | 153 (100.0%) | 0 (0.0%) |
| 4+ Person Household | 358 (93.7%) | 24 (6.3%) |
| Total Housing Units | 1,157 (87.8%) | 160 (12.1%) |
Occupancy by Educational Attainment in Alexandria
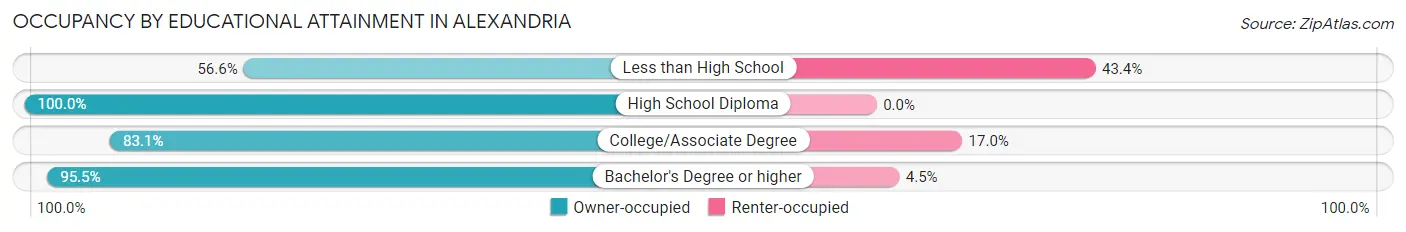
| Household Size | Owner-occupied | Renter-occupied |
| Less than High School | 30 (56.6%) | 23 (43.4%) |
| High School Diploma | 178 (100.0%) | 0 (0.0%) |
| College/Associate Degree | 588 (83.1%) | 120 (17.0%) |
| Bachelor's Degree or higher | 361 (95.5%) | 17 (4.5%) |
Occupancy by Age of Householder in Alexandria
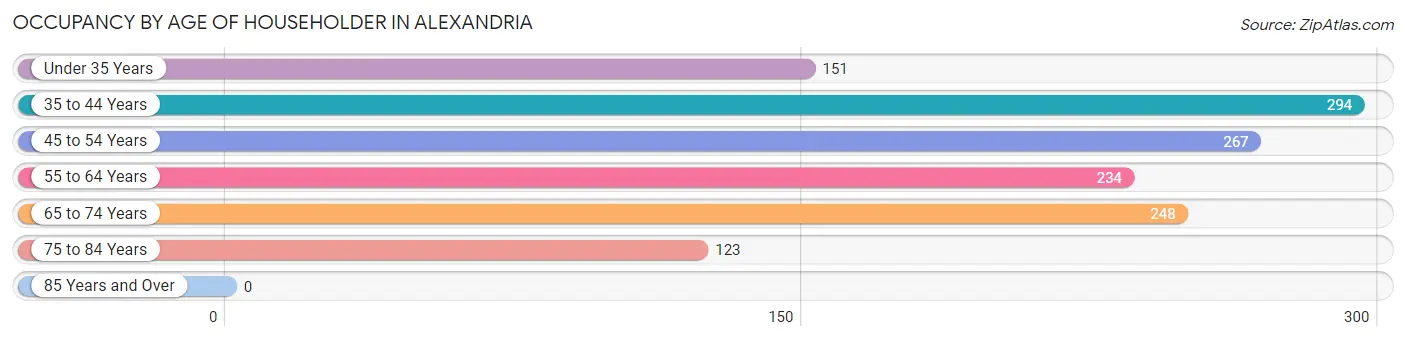
| Age Bracket | # Households | % Households |
| Under 35 Years | 151 | 11.5% |
| 35 to 44 Years | 294 | 22.3% |
| 45 to 54 Years | 267 | 20.3% |
| 55 to 64 Years | 234 | 17.8% |
| 65 to 74 Years | 248 | 18.8% |
| 75 to 84 Years | 123 | 9.3% |
| 85 Years and Over | 0 | 0.0% |
| Total | 1,317 | 100.0% |
Housing Finances in Alexandria
Median Income by Occupancy in Alexandria
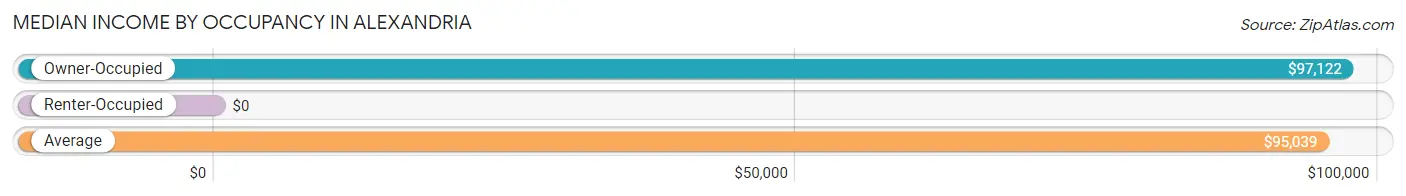
| Occupancy Type | # Households | Median Income |
| Owner-Occupied | 1,157 (87.8%) | $97,122 |
| Renter-Occupied | 160 (12.1%) | $0 |
| Average | 1,317 (100.0%) | $95,039 |
Occupancy by Householder Income Bracket in Alexandria
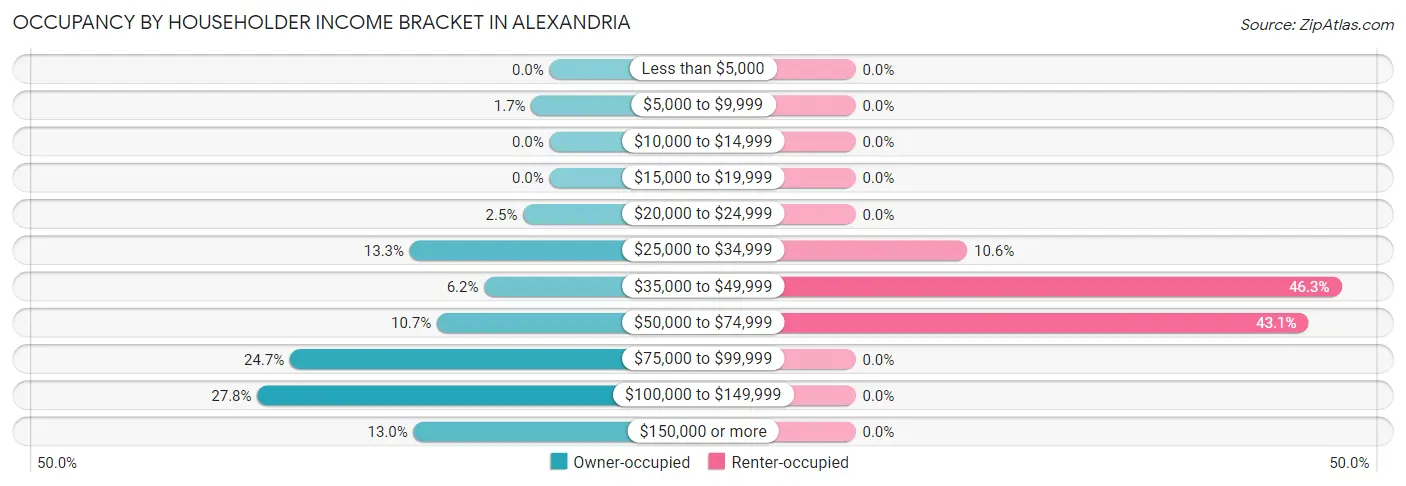
| Income Bracket | Owner-occupied | Renter-occupied |
| Less than $5,000 | 0 (0.0%) | 0 (0.0%) |
| $5,000 to $9,999 | 20 (1.7%) | 0 (0.0%) |
| $10,000 to $14,999 | 0 (0.0%) | 0 (0.0%) |
| $15,000 to $19,999 | 0 (0.0%) | 0 (0.0%) |
| $20,000 to $24,999 | 29 (2.5%) | 0 (0.0%) |
| $25,000 to $34,999 | 154 (13.3%) | 17 (10.6%) |
| $35,000 to $49,999 | 72 (6.2%) | 74 (46.3%) |
| $50,000 to $74,999 | 124 (10.7%) | 69 (43.1%) |
| $75,000 to $99,999 | 286 (24.7%) | 0 (0.0%) |
| $100,000 to $149,999 | 322 (27.8%) | 0 (0.0%) |
| $150,000 or more | 150 (13.0%) | 0 (0.0%) |
| Total | 1,157 (100.0%) | 160 (100.0%) |
Monthly Housing Cost Tiers in Alexandria
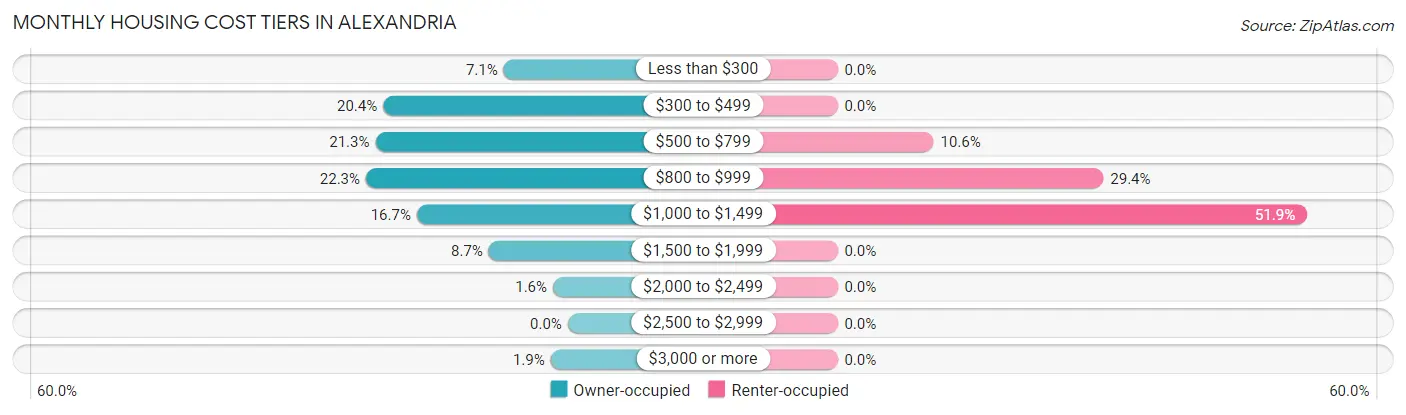
| Monthly Cost | Owner-occupied | Renter-occupied |
| Less than $300 | 82 (7.1%) | 0 (0.0%) |
| $300 to $499 | 236 (20.4%) | 0 (0.0%) |
| $500 to $799 | 246 (21.3%) | 17 (10.6%) |
| $800 to $999 | 258 (22.3%) | 47 (29.4%) |
| $1,000 to $1,499 | 193 (16.7%) | 83 (51.9%) |
| $1,500 to $1,999 | 101 (8.7%) | 0 (0.0%) |
| $2,000 to $2,499 | 19 (1.6%) | 0 (0.0%) |
| $2,500 to $2,999 | 0 (0.0%) | 0 (0.0%) |
| $3,000 or more | 22 (1.9%) | 0 (0.0%) |
| Total | 1,157 (100.0%) | 160 (100.0%) |
Physical Housing Characteristics in Alexandria
Housing Structures in Alexandria

| Structure Type | # Housing Units | % Housing Units |
| Single Unit, Detached | 1,124 | 85.4% |
| Single Unit, Attached | 0 | 0.0% |
| 2 Unit Apartments | 0 | 0.0% |
| 3 or 4 Unit Apartments | 17 | 1.3% |
| 5 to 9 Unit Apartments | 0 | 0.0% |
| 10 or more Apartments | 0 | 0.0% |
| Mobile Home / Other | 176 | 13.4% |
| Total | 1,317 | 100.0% |
Housing Structures by Occupancy in Alexandria
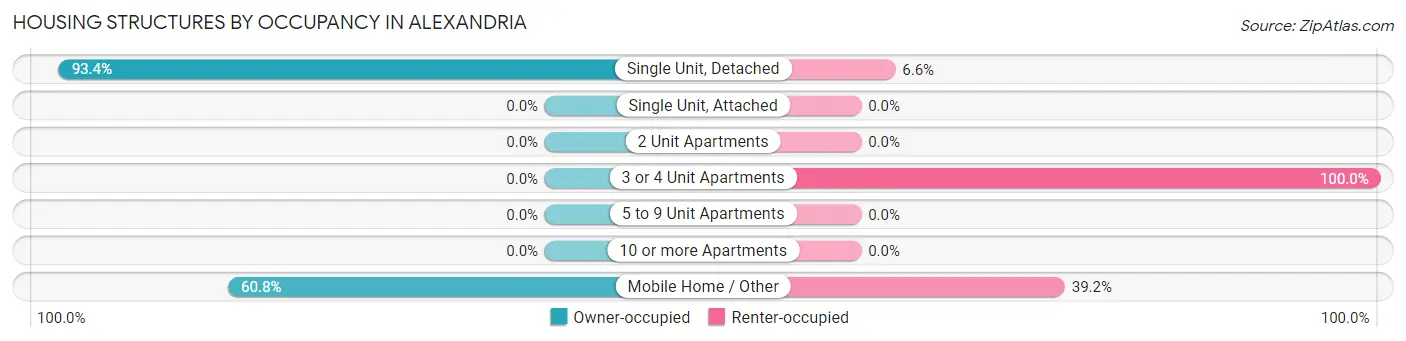
| Structure Type | Owner-occupied | Renter-occupied |
| Single Unit, Detached | 1,050 (93.4%) | 74 (6.6%) |
| Single Unit, Attached | 0 (0.0%) | 0 (0.0%) |
| 2 Unit Apartments | 0 (0.0%) | 0 (0.0%) |
| 3 or 4 Unit Apartments | 0 (0.0%) | 17 (100.0%) |
| 5 to 9 Unit Apartments | 0 (0.0%) | 0 (0.0%) |
| 10 or more Apartments | 0 (0.0%) | 0 (0.0%) |
| Mobile Home / Other | 107 (60.8%) | 69 (39.2%) |
| Total | 1,157 (87.8%) | 160 (12.1%) |
Housing Structures by Number of Rooms in Alexandria
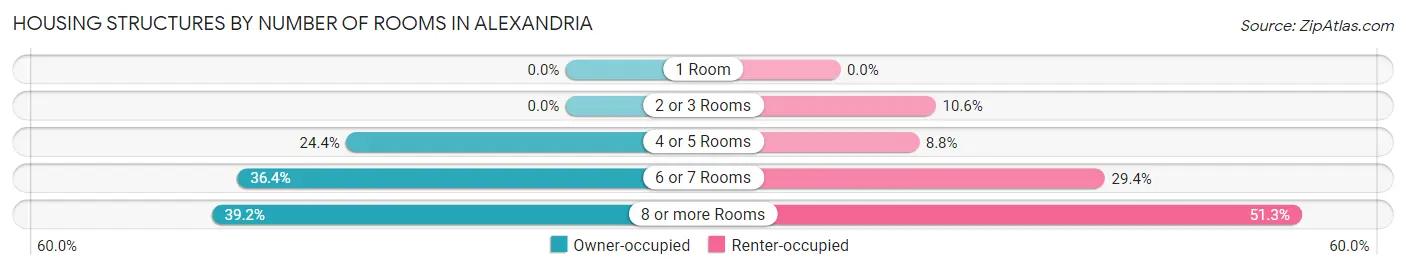
| Number of Rooms | Owner-occupied | Renter-occupied |
| 1 Room | 0 (0.0%) | 0 (0.0%) |
| 2 or 3 Rooms | 0 (0.0%) | 17 (10.6%) |
| 4 or 5 Rooms | 282 (24.4%) | 14 (8.7%) |
| 6 or 7 Rooms | 421 (36.4%) | 47 (29.4%) |
| 8 or more Rooms | 454 (39.2%) | 82 (51.2%) |
| Total | 1,157 (100.0%) | 160 (100.0%) |
Housing Structure by Heating Type in Alexandria
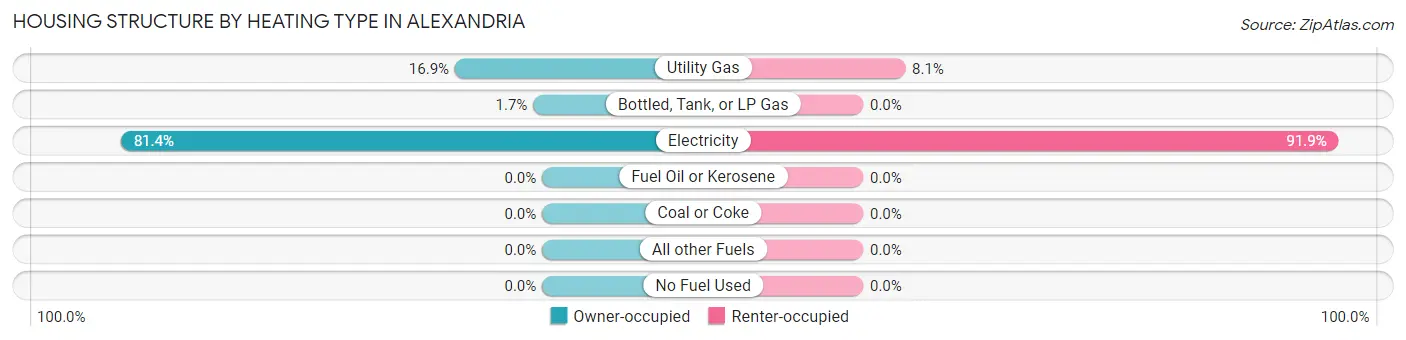
| Heating Type | Owner-occupied | Renter-occupied |
| Utility Gas | 195 (16.9%) | 13 (8.1%) |
| Bottled, Tank, or LP Gas | 20 (1.7%) | 0 (0.0%) |
| Electricity | 942 (81.4%) | 147 (91.9%) |
| Fuel Oil or Kerosene | 0 (0.0%) | 0 (0.0%) |
| Coal or Coke | 0 (0.0%) | 0 (0.0%) |
| All other Fuels | 0 (0.0%) | 0 (0.0%) |
| No Fuel Used | 0 (0.0%) | 0 (0.0%) |
| Total | 1,157 (100.0%) | 160 (100.0%) |
Household Vehicle Usage in Alexandria
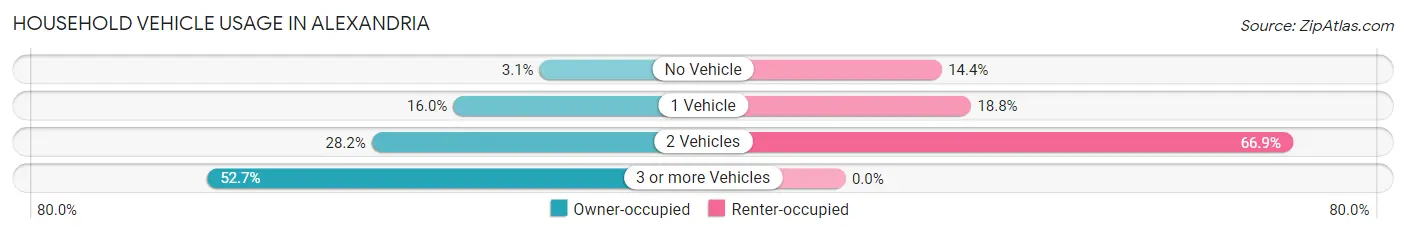
| Vehicles per Household | Owner-occupied | Renter-occupied |
| No Vehicle | 36 (3.1%) | 23 (14.4%) |
| 1 Vehicle | 185 (16.0%) | 30 (18.8%) |
| 2 Vehicles | 326 (28.2%) | 107 (66.9%) |
| 3 or more Vehicles | 610 (52.7%) | 0 (0.0%) |
| Total | 1,157 (100.0%) | 160 (100.0%) |
Real Estate & Mortgages in Alexandria
Real Estate and Mortgage Overview in Alexandria
| Characteristic | Without Mortgage | With Mortgage |
| Housing Units | 438 | 719 |
| Median Property Value | $160,000 | $164,100 |
| Median Household Income | $96,910 | $150 |
| Monthly Housing Costs | $438 | $22 |
| Real Estate Taxes | $844 | $247 |
Property Value by Mortgage Status in Alexandria
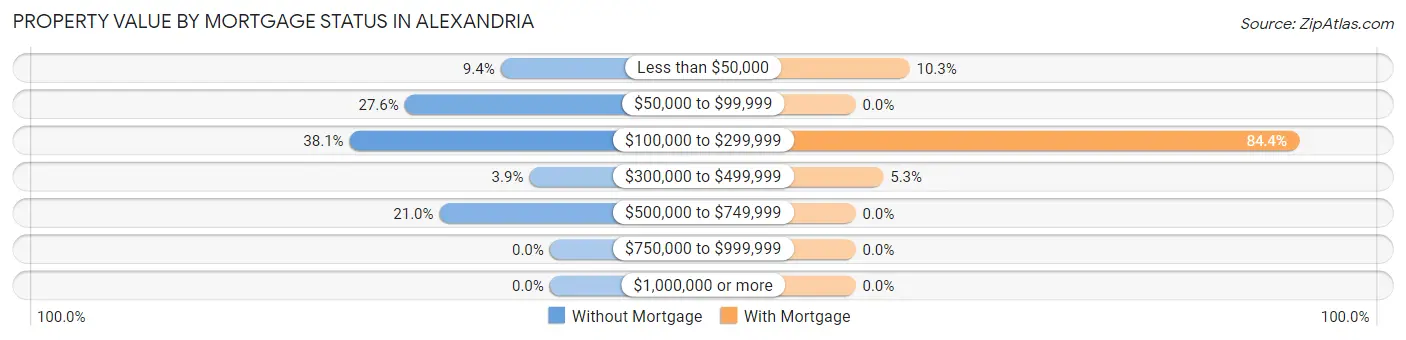
| Property Value | Without Mortgage | With Mortgage |
| Less than $50,000 | 41 (9.4%) | 74 (10.3%) |
| $50,000 to $99,999 | 121 (27.6%) | 0 (0.0%) |
| $100,000 to $299,999 | 167 (38.1%) | 607 (84.4%) |
| $300,000 to $499,999 | 17 (3.9%) | 38 (5.3%) |
| $500,000 to $749,999 | 92 (21.0%) | 0 (0.0%) |
| $750,000 to $999,999 | 0 (0.0%) | 0 (0.0%) |
| $1,000,000 or more | 0 (0.0%) | 0 (0.0%) |
| Total | 438 (100.0%) | 719 (100.0%) |
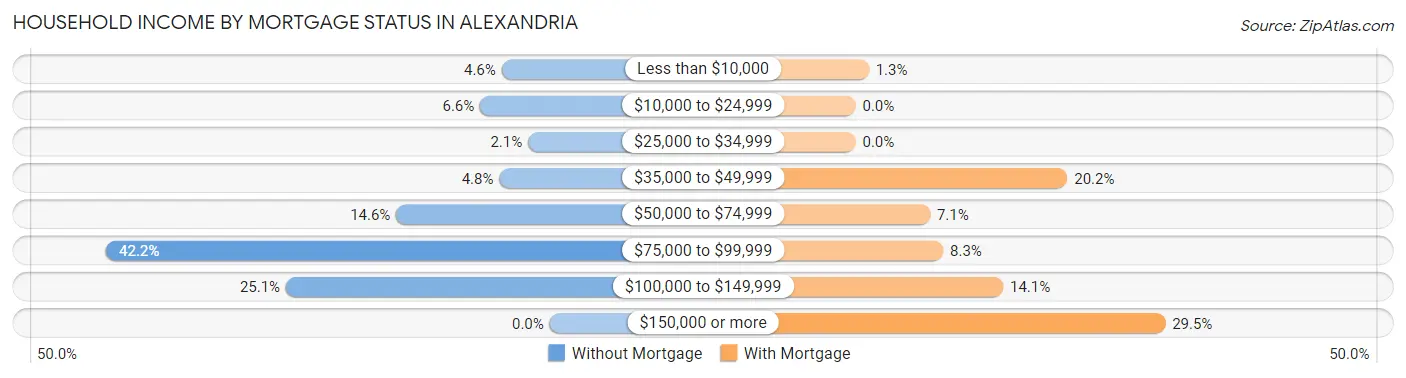
Household Income by Mortgage Status in Alexandria
| Household Income | Without Mortgage | With Mortgage |
| Less than $10,000 | 20 (4.6%) | 9 (1.3%) |
| $10,000 to $24,999 | 29 (6.6%) | 0 (0.0%) |
| $25,000 to $34,999 | 9 (2.1%) | 0 (0.0%) |
| $35,000 to $49,999 | 21 (4.8%) | 145 (20.2%) |
| $50,000 to $74,999 | 64 (14.6%) | 51 (7.1%) |
| $75,000 to $99,999 | 185 (42.2%) | 60 (8.3%) |
| $100,000 to $149,999 | 110 (25.1%) | 101 (14.1%) |
| $150,000 or more | 0 (0.0%) | 212 (29.5%) |
| Total | 438 (100.0%) | 719 (100.0%) |
Property Value to Household Income Ratio in Alexandria
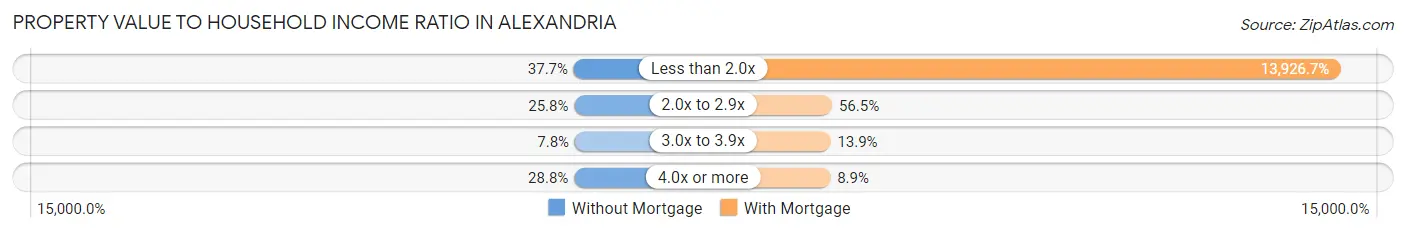
| Value-to-Income Ratio | Without Mortgage | With Mortgage |
| Less than 2.0x | 165 (37.7%) | 100,133 (13,926.7%) |
| 2.0x to 2.9x | 113 (25.8%) | 406 (56.5%) |
| 3.0x to 3.9x | 34 (7.8%) | 100 (13.9%) |
| 4.0x or more | 126 (28.8%) | 64 (8.9%) |
| Total | 438 (100.0%) | 719 (100.0%) |
Real Estate Taxes by Mortgage Status in Alexandria
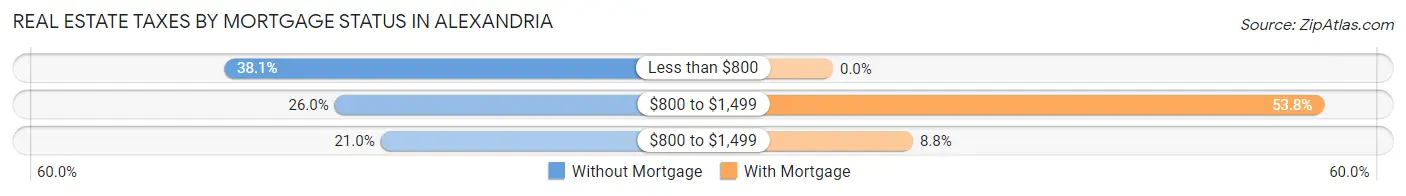
| Property Taxes | Without Mortgage | With Mortgage |
| Less than $800 | 167 (38.1%) | 0 (0.0%) |
| $800 to $1,499 | 114 (26.0%) | 387 (53.8%) |
| $800 to $1,499 | 92 (21.0%) | 63 (8.8%) |
| Total | 438 (100.0%) | 719 (100.0%) |
Health & Disability in Alexandria
Health Insurance Coverage by Age in Alexandria
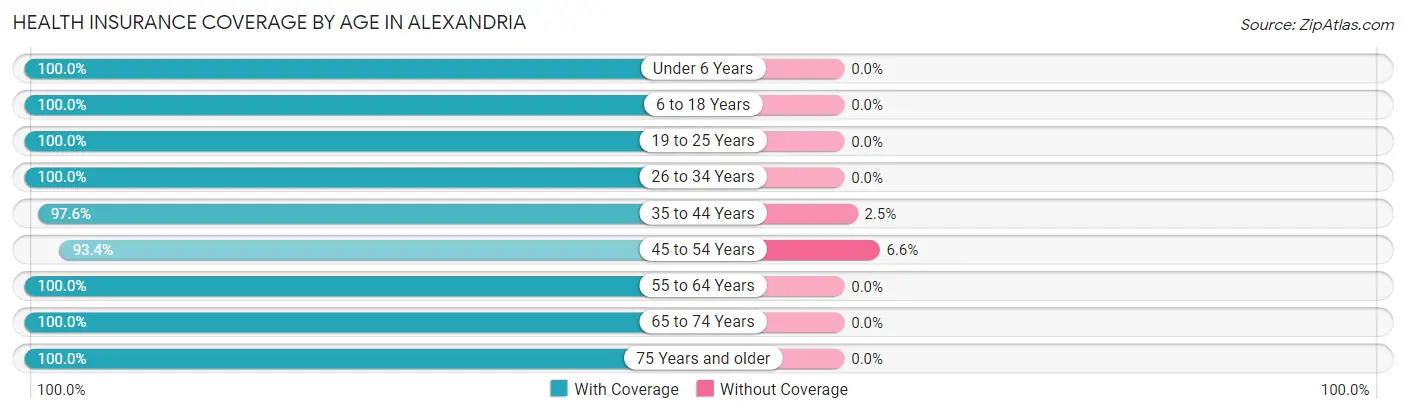
| Age Bracket | With Coverage | Without Coverage |
| Under 6 Years | 182 (100.0%) | 0 (0.0%) |
| 6 to 18 Years | 466 (100.0%) | 0 (0.0%) |
| 19 to 25 Years | 342 (100.0%) | 0 (0.0%) |
| 26 to 34 Years | 365 (100.0%) | 0 (0.0%) |
| 35 to 44 Years | 596 (97.6%) | 15 (2.5%) |
| 45 to 54 Years | 527 (93.4%) | 37 (6.6%) |
| 55 to 64 Years | 412 (100.0%) | 0 (0.0%) |
| 65 to 74 Years | 390 (100.0%) | 0 (0.0%) |
| 75 Years and older | 317 (100.0%) | 0 (0.0%) |
| Total | 3,597 (98.6%) | 52 (1.4%) |
Health Insurance Coverage by Citizenship Status in Alexandria
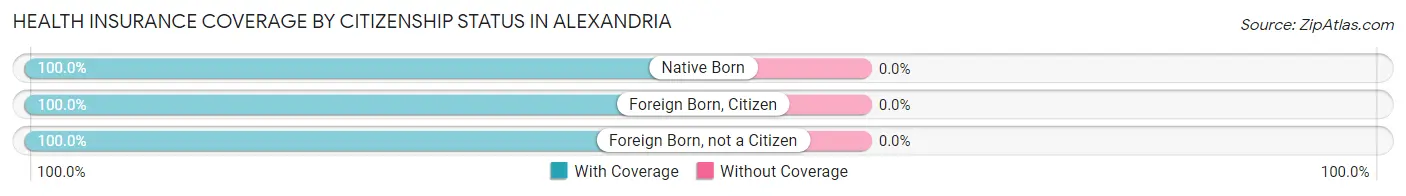
| Citizenship Status | With Coverage | Without Coverage |
| Native Born | 182 (100.0%) | 0 (0.0%) |
| Foreign Born, Citizen | 466 (100.0%) | 0 (0.0%) |
| Foreign Born, not a Citizen | 342 (100.0%) | 0 (0.0%) |
Health Insurance Coverage by Household Income in Alexandria
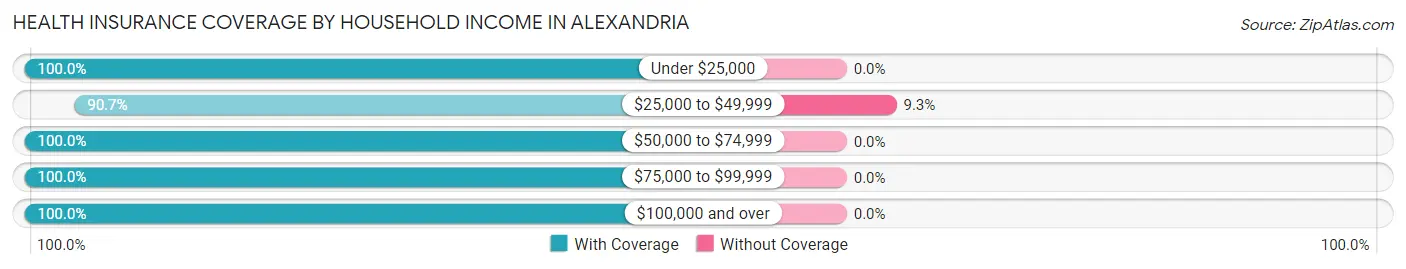
| Household Income | With Coverage | Without Coverage |
| Under $25,000 | 49 (100.0%) | 0 (0.0%) |
| $25,000 to $49,999 | 506 (90.7%) | 52 (9.3%) |
| $50,000 to $74,999 | 435 (100.0%) | 0 (0.0%) |
| $75,000 to $99,999 | 951 (100.0%) | 0 (0.0%) |
| $100,000 and over | 1,656 (100.0%) | 0 (0.0%) |
Public vs Private Health Insurance Coverage by Age in Alexandria
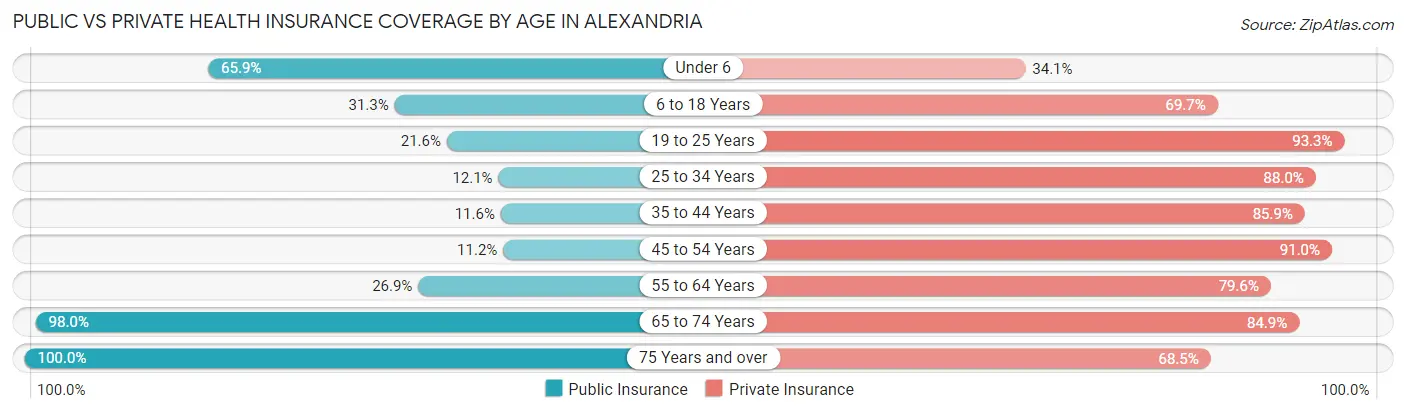
| Age Bracket | Public Insurance | Private Insurance |
| Under 6 | 120 (65.9%) | 62 (34.1%) |
| 6 to 18 Years | 146 (31.3%) | 325 (69.7%) |
| 19 to 25 Years | 74 (21.6%) | 319 (93.3%) |
| 25 to 34 Years | 44 (12.0%) | 321 (87.9%) |
| 35 to 44 Years | 71 (11.6%) | 525 (85.9%) |
| 45 to 54 Years | 63 (11.2%) | 513 (91.0%) |
| 55 to 64 Years | 111 (26.9%) | 328 (79.6%) |
| 65 to 74 Years | 382 (98.0%) | 331 (84.9%) |
| 75 Years and over | 317 (100.0%) | 217 (68.4%) |
| Total | 1,328 (36.4%) | 2,941 (80.6%) |
Disability Status by Sex by Age in Alexandria
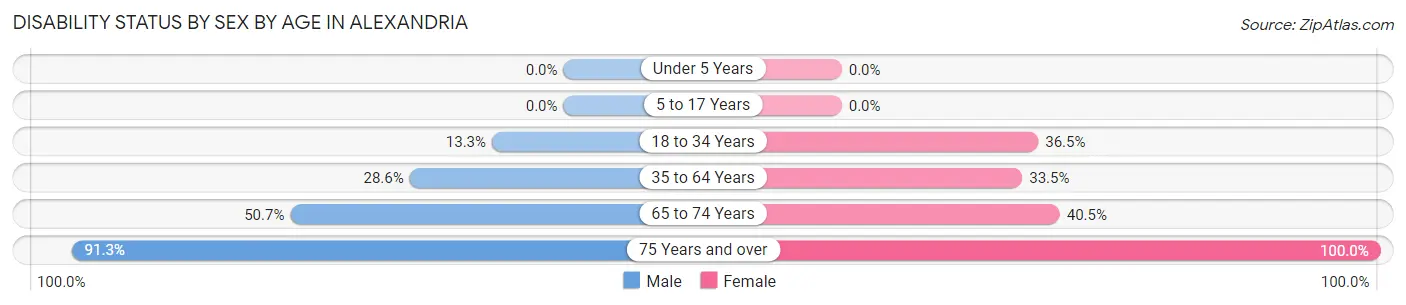
| Age Bracket | Male | Female |
| Under 5 Years | 0 (0.0%) | 0 (0.0%) |
| 5 to 17 Years | 0 (0.0%) | 0 (0.0%) |
| 18 to 34 Years | 52 (13.3%) | 128 (36.5%) |
| 35 to 64 Years | 183 (28.5%) | 317 (33.5%) |
| 65 to 74 Years | 110 (50.7%) | 70 (40.5%) |
| 75 Years and over | 94 (91.3%) | 214 (100.0%) |
Disability Class by Sex by Age in Alexandria
Disability Class: Hearing Difficulty
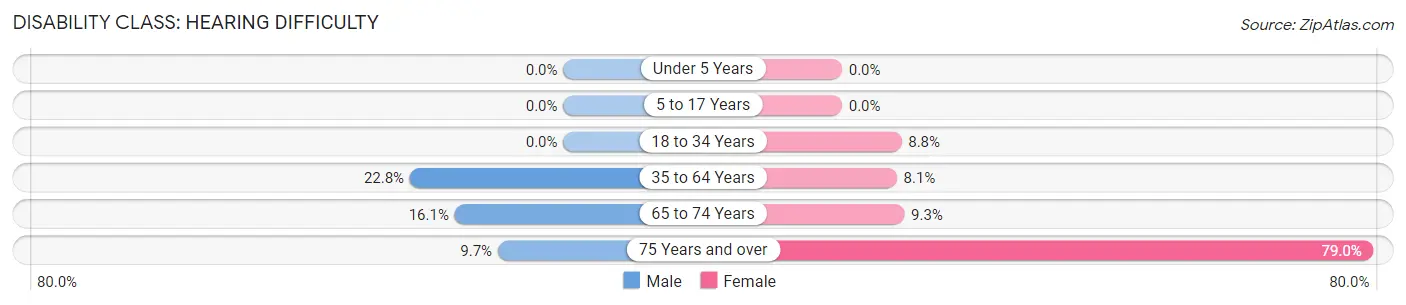
| Age Bracket | Male | Female |
| Under 5 Years | 0 (0.0%) | 0 (0.0%) |
| 5 to 17 Years | 0 (0.0%) | 0 (0.0%) |
| 18 to 34 Years | 0 (0.0%) | 31 (8.8%) |
| 35 to 64 Years | 146 (22.8%) | 77 (8.1%) |
| 65 to 74 Years | 35 (16.1%) | 16 (9.2%) |
| 75 Years and over | 10 (9.7%) | 169 (79.0%) |
Disability Class: Vision Difficulty
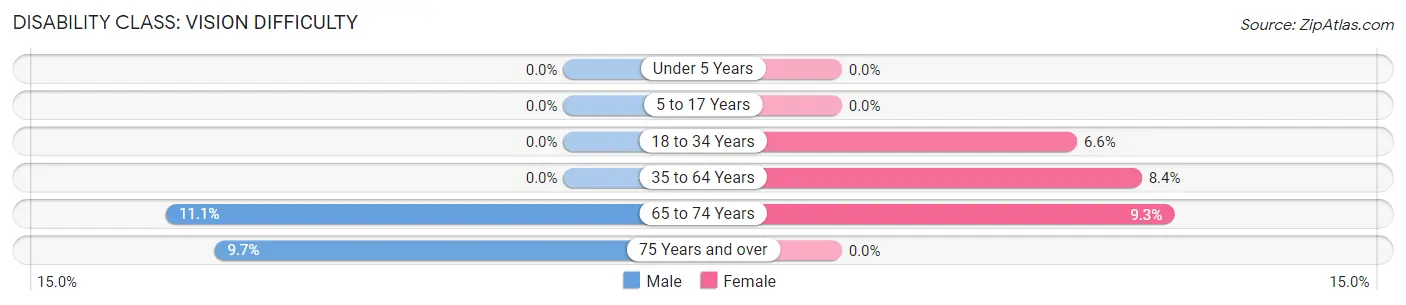
| Age Bracket | Male | Female |
| Under 5 Years | 0 (0.0%) | 0 (0.0%) |
| 5 to 17 Years | 0 (0.0%) | 0 (0.0%) |
| 18 to 34 Years | 0 (0.0%) | 23 (6.6%) |
| 35 to 64 Years | 0 (0.0%) | 79 (8.4%) |
| 65 to 74 Years | 24 (11.1%) | 16 (9.2%) |
| 75 Years and over | 10 (9.7%) | 0 (0.0%) |
Disability Class: Cognitive Difficulty
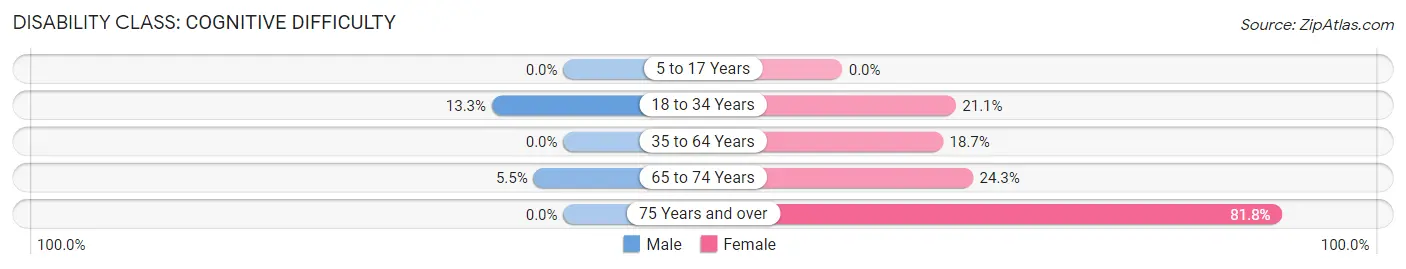
| Age Bracket | Male | Female |
| 5 to 17 Years | 0 (0.0%) | 0 (0.0%) |
| 18 to 34 Years | 52 (13.3%) | 74 (21.1%) |
| 35 to 64 Years | 0 (0.0%) | 177 (18.7%) |
| 65 to 74 Years | 12 (5.5%) | 42 (24.3%) |
| 75 Years and over | 0 (0.0%) | 175 (81.8%) |
Disability Class: Ambulatory Difficulty
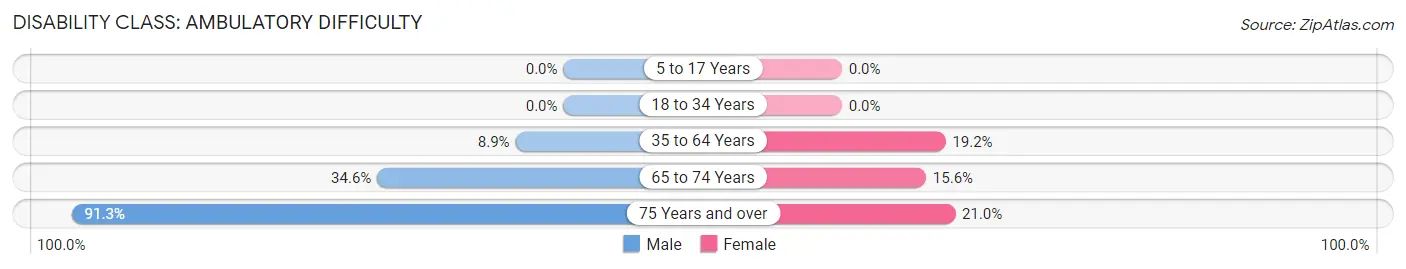
| Age Bracket | Male | Female |
| 5 to 17 Years | 0 (0.0%) | 0 (0.0%) |
| 18 to 34 Years | 0 (0.0%) | 0 (0.0%) |
| 35 to 64 Years | 57 (8.9%) | 182 (19.2%) |
| 65 to 74 Years | 75 (34.6%) | 27 (15.6%) |
| 75 Years and over | 94 (91.3%) | 45 (21.0%) |
Disability Class: Self-Care Difficulty
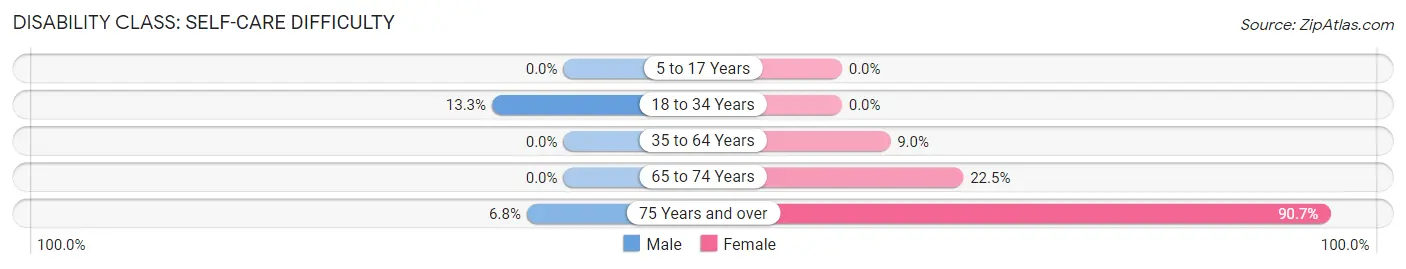
| Age Bracket | Male | Female |
| 5 to 17 Years | 0 (0.0%) | 0 (0.0%) |
| 18 to 34 Years | 52 (13.3%) | 0 (0.0%) |
| 35 to 64 Years | 0 (0.0%) | 85 (9.0%) |
| 65 to 74 Years | 0 (0.0%) | 39 (22.5%) |
| 75 Years and over | 7 (6.8%) | 194 (90.6%) |
Technology Access in Alexandria
Computing Device Access in Alexandria
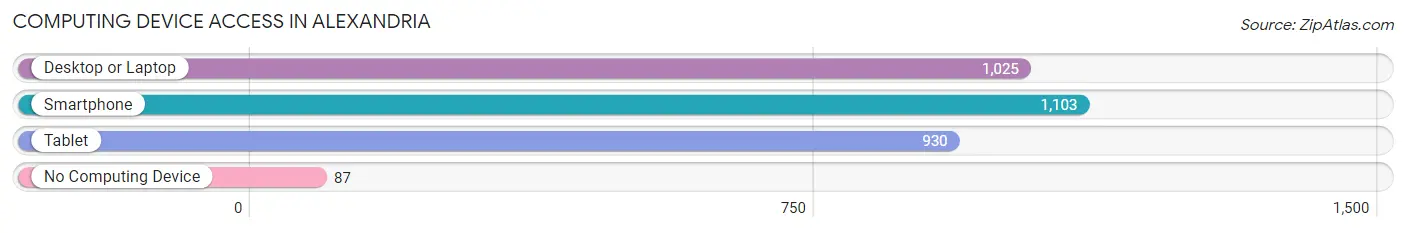
| Device Type | # Households | % Households |
| Desktop or Laptop | 1,025 | 77.8% |
| Smartphone | 1,103 | 83.8% |
| Tablet | 930 | 70.6% |
| No Computing Device | 87 | 6.6% |
| Total | 1,317 | 100.0% |
Internet Access in Alexandria
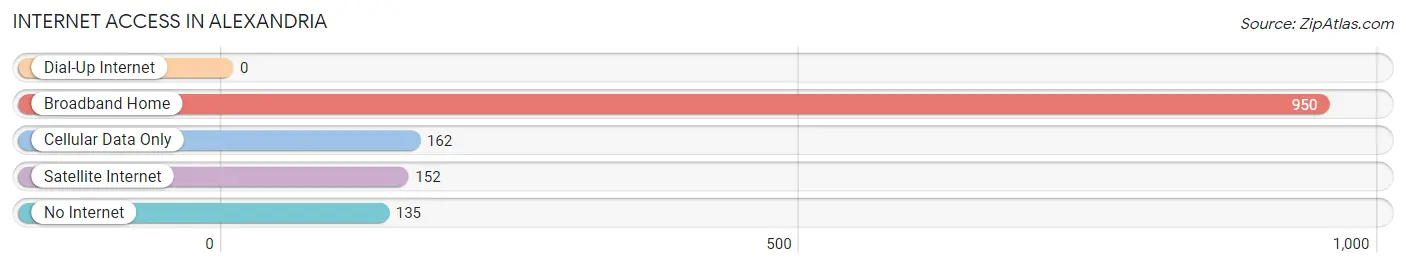
| Internet Type | # Households | % Households |
| Dial-Up Internet | 0 | 0.0% |
| Broadband Home | 950 | 72.1% |
| Cellular Data Only | 162 | 12.3% |
| Satellite Internet | 152 | 11.5% |
| No Internet | 135 | 10.2% |
| Total | 1,317 | 100.0% |
Alexandria Summary
Alexandria, Alabama is a small city located in Calhoun County in the northeastern part of the state. It is situated on the banks of the Coosa River, about 25 miles south of Anniston and about 50 miles northeast of Birmingham. The city has a population of approximately 8,000 people and covers an area of about 8.5 square miles.
History
The area that is now Alexandria was first settled in the early 1800s by settlers from Georgia and Tennessee. The town was originally known as “Crossroads” due to its location at the intersection of two major roads. In 1836, the town was renamed Alexandria after the nearby Alexandria Plantation. The plantation was owned by the prominent local family of the same name.
In the late 1800s, Alexandria began to grow and develop as a commercial center. The town was incorporated in 1891 and the first mayor was elected in 1892. During this time, the town was home to several businesses, including a cotton gin, a grist mill, a sawmill, and a brickyard.
In the early 1900s, Alexandria experienced a period of growth and prosperity. The town was home to several banks, a hotel, a movie theater, and a variety of other businesses. The town also had a thriving agricultural industry, with cotton, corn, and other crops being grown in the area.
Geography
Alexandria is located in the northeastern part of Alabama, about 25 miles south of Anniston and about 50 miles northeast of Birmingham. The city is situated on the banks of the Coosa River and is surrounded by rolling hills and forests. The city has a total area of 8.5 square miles, of which 8.4 square miles is land and 0.1 square miles is water.
Economy
Alexandria’s economy is largely based on agriculture and manufacturing. The city is home to several large farms that produce cotton, corn, soybeans, and other crops. The city also has several manufacturing plants, including a paper mill, a furniture factory, and a plastics plant.
In addition to agriculture and manufacturing, Alexandria also has a thriving retail sector. The city is home to several large stores, including Walmart, Lowe’s, and Target. The city also has several restaurants, bars, and other businesses.
Demographics
As of the 2010 census, Alexandria had a population of 8,000 people. The racial makeup of the city was 79.2% White, 17.2% African American, 0.3% Native American, 0.7% Asian, 0.1% Pacific Islander, 1.2% from other races, and 1.4% from two or more races. Hispanic or Latino of any race were 2.7% of the population.
The median household income in Alexandria was $35,000, and the median family income was $41,000. About 17.2% of the population was below the poverty line. The city’s unemployment rate was 8.2%.
Conclusion
Alexandria, Alabama is a small city located in Calhoun County in the northeastern part of the state. It is situated on the banks of the Coosa River and has a population of approximately 8,000 people. The city’s economy is largely based on agriculture and manufacturing, and it also has a thriving retail sector. The city’s population is mostly White, with African Americans making up the largest minority group. The median household income in Alexandria is $35,000 and the unemployment rate is 8.2%.
Common Questions
What is Per Capita Income in Alexandria?
Per Capita income in Alexandria is $35,542.
What is the Median Family Income in Alexandria?
Median Family Income in Alexandria is $98,220.
What is the Median Household income in Alexandria?
Median Household Income in Alexandria is $95,039.
What is Income or Wage Gap in Alexandria?
Income or Wage Gap in Alexandria is 54.9%.
Women in Alexandria earn 45.1 cents for every dollar earned by a man.
What is Inequality or Gini Index in Alexandria?
Inequality or Gini Index in Alexandria is 0.32.
What is the Total Population of Alexandria?
Total Population of Alexandria is 3,748.
What is the Total Male Population of Alexandria?
Total Male Population of Alexandria is 1,762.
What is the Total Female Population of Alexandria?
Total Female Population of Alexandria is 1,986.
What is the Ratio of Males per 100 Females in Alexandria?
There are 88.72 Males per 100 Females in Alexandria.
What is the Ratio of Females per 100 Males in Alexandria?
There are 112.71 Females per 100 Males in Alexandria.
What is the Median Population Age in Alexandria?
Median Population Age in Alexandria is 40.9 Years.
What is the Average Family Size in Alexandria
Average Family Size in Alexandria is 3.3 People.
What is the Average Household Size in Alexandria
Average Household Size in Alexandria is 2.9 People.
How Large is the Labor Force in Alexandria?
There are 1,964 People in the Labor Forcein in Alexandria.
What is the Percentage of People in the Labor Force in Alexandria?
60.7% of People are in the Labor Force in Alexandria.
What is the Unemployment Rate in Alexandria?
Unemployment Rate in Alexandria is 0.9%.