Pine Level, AL Map & Demographics
Pine Level Map
Pine Level Overview
$39,384
PER CAPITA INCOME
$93,523
AVG FAMILY INCOME
$82,301
AVG HOUSEHOLD INCOME
27.2%
WAGE / INCOME GAP [ % ]
72.8¢/ $1
WAGE / INCOME GAP [ $ ]
0.39
INEQUALITY / GINI INDEX
3,881
TOTAL POPULATION
1,865
MALE POPULATION
2,016
FEMALE POPULATION
92.51
MALES / 100 FEMALES
108.10
FEMALES / 100 MALES
37.8
MEDIAN AGE
3.5
AVG FAMILY SIZE
2.8
AVG HOUSEHOLD SIZE
2,061
LABOR FORCE [ PEOPLE ]
67.2%
PERCENT IN LABOR FORCE
4.4%
UNEMPLOYMENT RATE
Pine Level Area Codes
Income in Pine Level
Income Overview in Pine Level
Per Capita Income in Pine Level is $39,384, while median incomes of families and households are $93,523 and $82,301 respectively.
| Characteristic | Number | Measure |
| Per Capita Income | 3,881 | $39,384 |
| Median Family Income | 943 | $93,523 |
| Mean Family Income | 943 | $108,182 |
| Median Household Income | 1,405 | $82,301 |
| Mean Household Income | 1,405 | $102,835 |
| Income Deficit | 943 | $0 |
| Wage / Income Gap (%) | 3,881 | 27.16% |
| Wage / Income Gap ($) | 3,881 | 72.84¢ per $1 |
| Gini / Inequality Index | 3,881 | 0.39 |
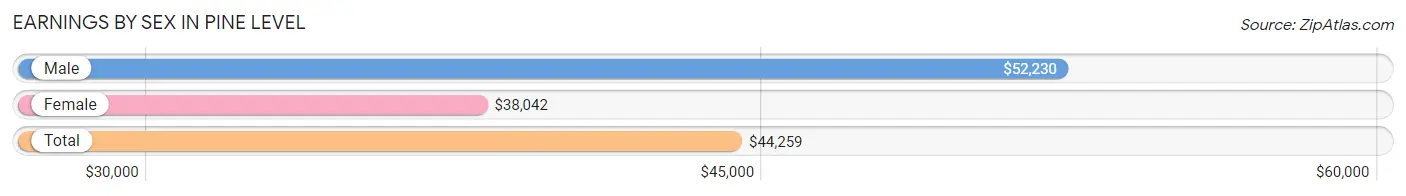
Earnings by Sex in Pine Level
Average Earnings in Pine Level are $44,259, $52,230 for men and $38,042 for women, a difference of 27.2%.
| Sex | Number | Average Earnings |
| Male | 1,112 (52.5%) | $52,230 |
| Female | 1,007 (47.5%) | $38,042 |
| Total | 2,119 (100.0%) | $44,259 |
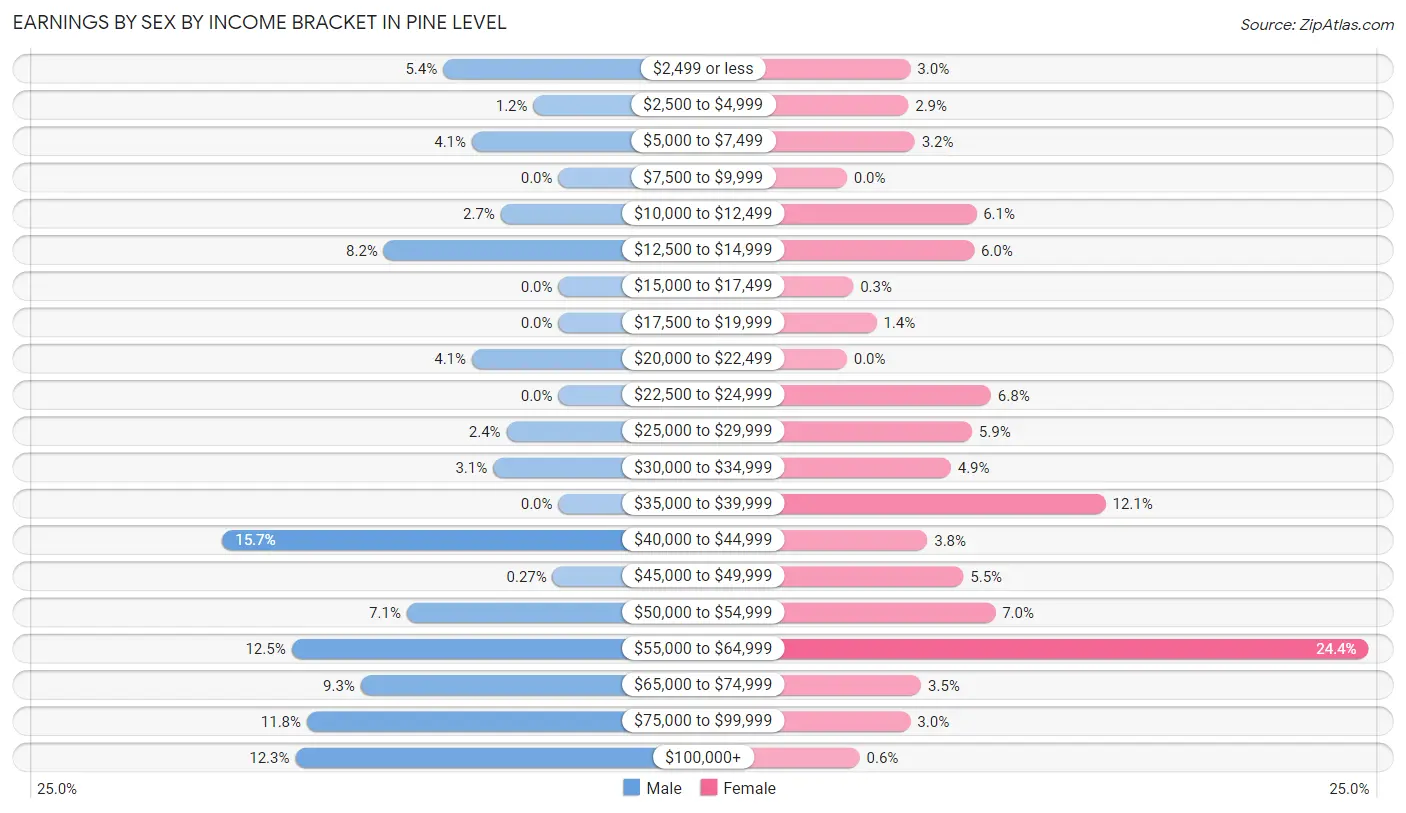
Earnings by Sex by Income Bracket in Pine Level
The most common earnings brackets in Pine Level are $40,000 to $44,999 for men (175 | 15.7%) and $55,000 to $64,999 for women (246 | 24.4%).
| Income | Male | Female |
| $2,499 or less | 60 (5.4%) | 30 (3.0%) |
| $2,500 to $4,999 | 13 (1.2%) | 29 (2.9%) |
| $5,000 to $7,499 | 45 (4.1%) | 32 (3.2%) |
| $7,500 to $9,999 | 0 (0.0%) | 0 (0.0%) |
| $10,000 to $12,499 | 30 (2.7%) | 61 (6.1%) |
| $12,500 to $14,999 | 91 (8.2%) | 60 (6.0%) |
| $15,000 to $17,499 | 0 (0.0%) | 3 (0.3%) |
| $17,500 to $19,999 | 0 (0.0%) | 14 (1.4%) |
| $20,000 to $22,499 | 45 (4.1%) | 0 (0.0%) |
| $22,500 to $24,999 | 0 (0.0%) | 68 (6.8%) |
| $25,000 to $29,999 | 27 (2.4%) | 59 (5.9%) |
| $30,000 to $34,999 | 34 (3.1%) | 49 (4.9%) |
| $35,000 to $39,999 | 0 (0.0%) | 122 (12.1%) |
| $40,000 to $44,999 | 175 (15.7%) | 38 (3.8%) |
| $45,000 to $49,999 | 3 (0.3%) | 55 (5.5%) |
| $50,000 to $54,999 | 79 (7.1%) | 70 (7.0%) |
| $55,000 to $64,999 | 139 (12.5%) | 246 (24.4%) |
| $65,000 to $74,999 | 103 (9.3%) | 35 (3.5%) |
| $75,000 to $99,999 | 131 (11.8%) | 30 (3.0%) |
| $100,000+ | 137 (12.3%) | 6 (0.6%) |
| Total | 1,112 (100.0%) | 1,007 (100.0%) |
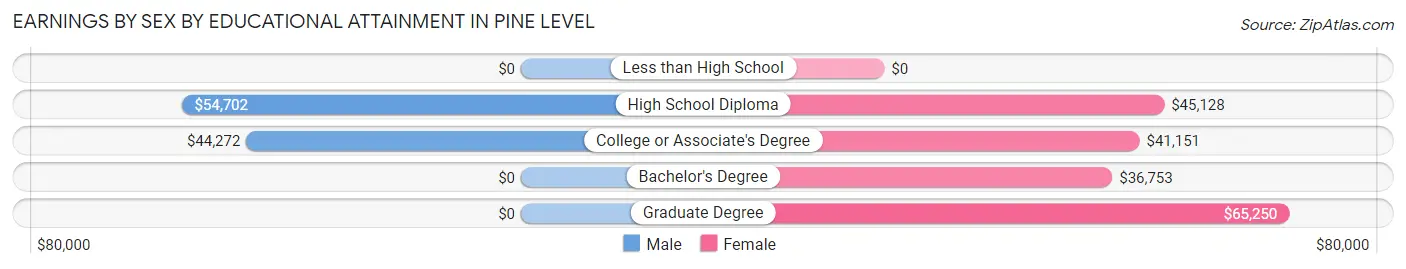
Earnings by Sex by Educational Attainment in Pine Level
Average earnings in Pine Level are $57,143 for men and $42,336 for women, a difference of 25.9%. Men with an educational attainment of high school diploma enjoy the highest average annual earnings of $54,702, while those with college or associate's degree education earn the least with $44,272. Women with an educational attainment of graduate degree earn the most with the average annual earnings of $65,250, while those with bachelor's degree education have the smallest earnings of $36,753.
| Educational Attainment | Male Income | Female Income |
| Less than High School | - | - |
| High School Diploma | $54,702 | $45,128 |
| College or Associate's Degree | $44,272 | $41,151 |
| Bachelor's Degree | - | - |
| Graduate Degree | - | - |
| Total | $57,143 | $42,336 |
Family Income in Pine Level
Family Income Brackets in Pine Level
According to the Pine Level family income data, there are 247 families falling into the $100,000 to $149,999 income range, which is the most common income bracket and makes up 26.2% of all families.
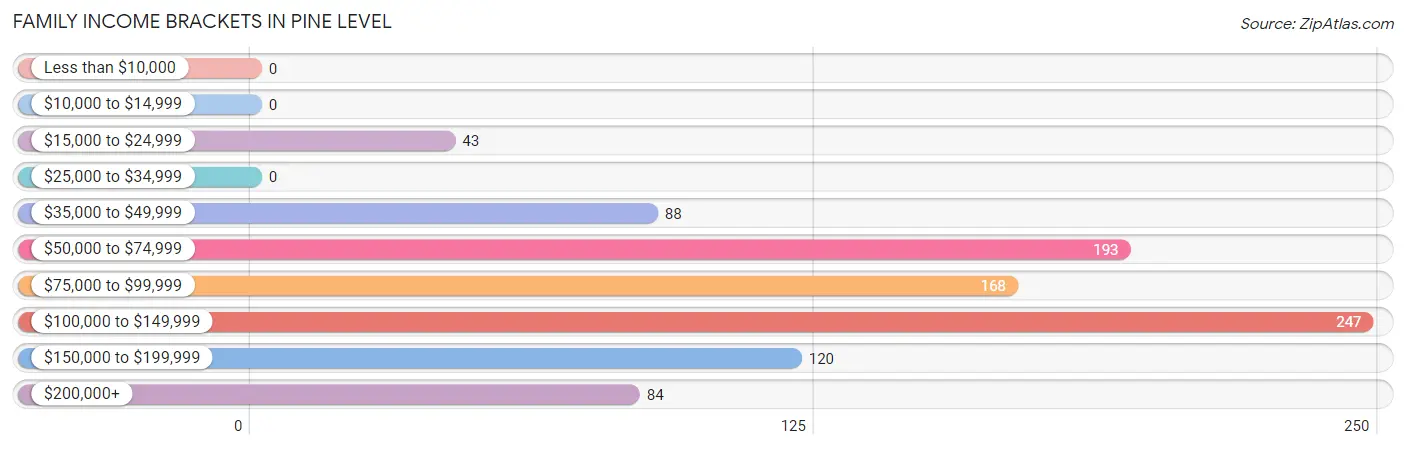
| Income Bracket | # Families | % Families |
| Less than $10,000 | 0 | 0.0% |
| $10,000 to $14,999 | 0 | 0.0% |
| $15,000 to $24,999 | 43 | 4.6% |
| $25,000 to $34,999 | 0 | 0.0% |
| $35,000 to $49,999 | 88 | 9.3% |
| $50,000 to $74,999 | 193 | 20.5% |
| $75,000 to $99,999 | 168 | 17.8% |
| $100,000 to $149,999 | 247 | 26.2% |
| $150,000 to $199,999 | 120 | 12.7% |
| $200,000+ | 84 | 8.9% |
Family Income by Famaliy Size in Pine Level
3-person families (221 | 23.4%) account for the highest median family income in Pine Level with $122,135 per family, while 2-person families (393 | 41.7%) have the highest median income of $56,534 per family member.
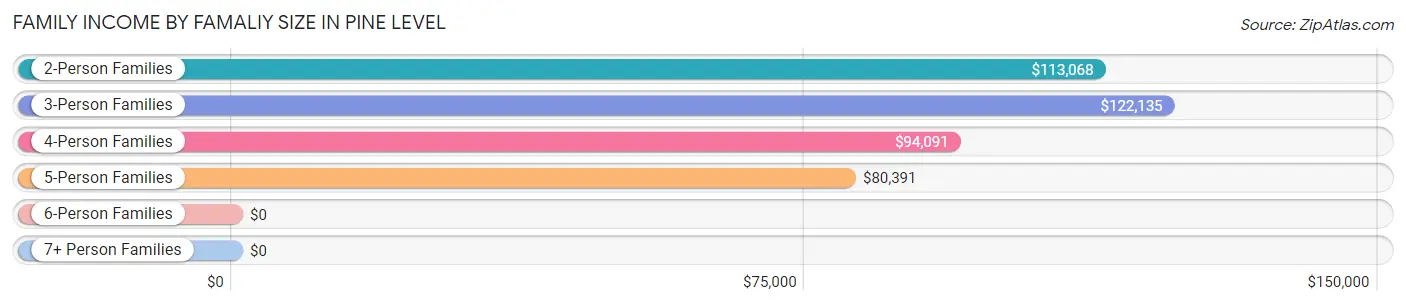
| Income Bracket | # Families | Median Income |
| 2-Person Families | 393 (41.7%) | $113,068 |
| 3-Person Families | 221 (23.4%) | $122,135 |
| 4-Person Families | 198 (21.0%) | $94,091 |
| 5-Person Families | 104 (11.0%) | $80,391 |
| 6-Person Families | 16 (1.7%) | $0 |
| 7+ Person Families | 11 (1.2%) | $0 |
| Total | 943 (100.0%) | $93,523 |
Family Income by Number of Earners in Pine Level
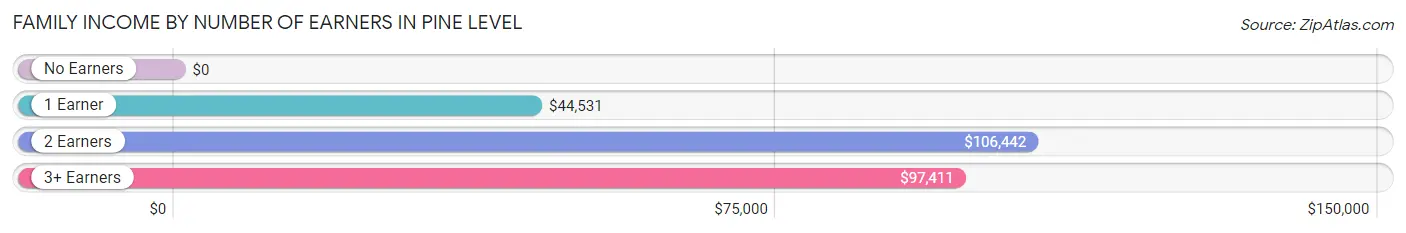
| Number of Earners | # Families | Median Income |
| No Earners | 144 (15.3%) | $0 |
| 1 Earner | 151 (16.0%) | $44,531 |
| 2 Earners | 557 (59.1%) | $106,442 |
| 3+ Earners | 91 (9.7%) | $97,411 |
| Total | 943 (100.0%) | $93,523 |
Household Income in Pine Level
Household Income Brackets in Pine Level
With 393 households falling in the category, the $100,000 to $149,999 income range is the most frequent in Pine Level, accounting for 28.0% of all households.
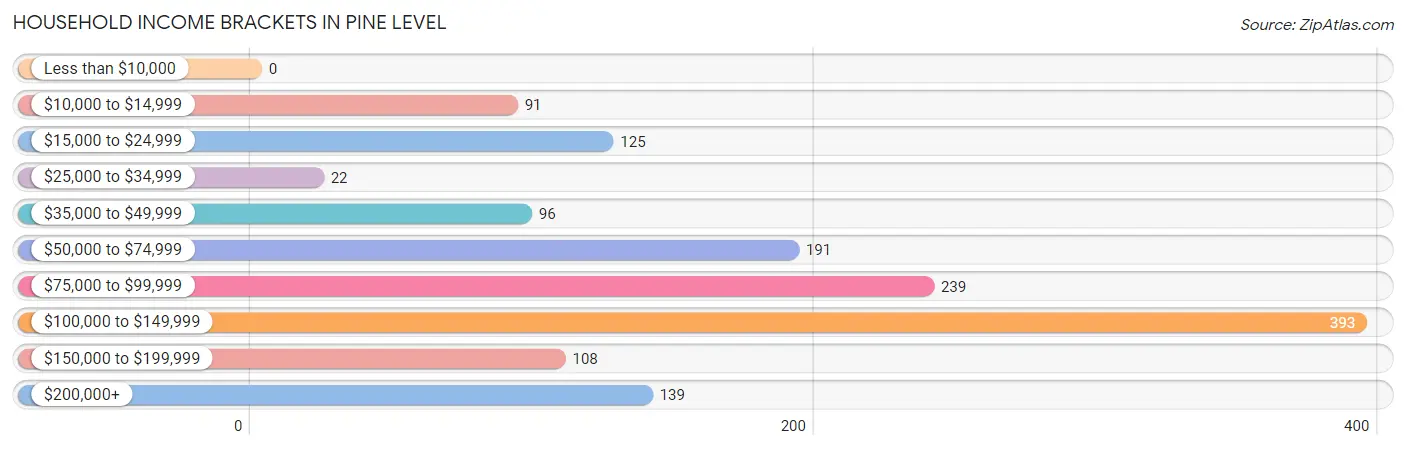
| Income Bracket | # Households | % Households |
| Less than $10,000 | 0 | 0.0% |
| $10,000 to $14,999 | 91 | 6.5% |
| $15,000 to $24,999 | 125 | 8.9% |
| $25,000 to $34,999 | 22 | 1.6% |
| $35,000 to $49,999 | 96 | 6.8% |
| $50,000 to $74,999 | 191 | 13.6% |
| $75,000 to $99,999 | 239 | 17.0% |
| $100,000 to $149,999 | 393 | 28.0% |
| $150,000 to $199,999 | 108 | 7.7% |
| $200,000+ | 139 | 9.9% |
Household Income by Householder Age in Pine Level
The median household income in Pine Level is $82,301, with the highest median household income of $115,066 found in the 45 to 64 years age bracket for the primary householder. A total of 572 households (40.7%) fall into this category.
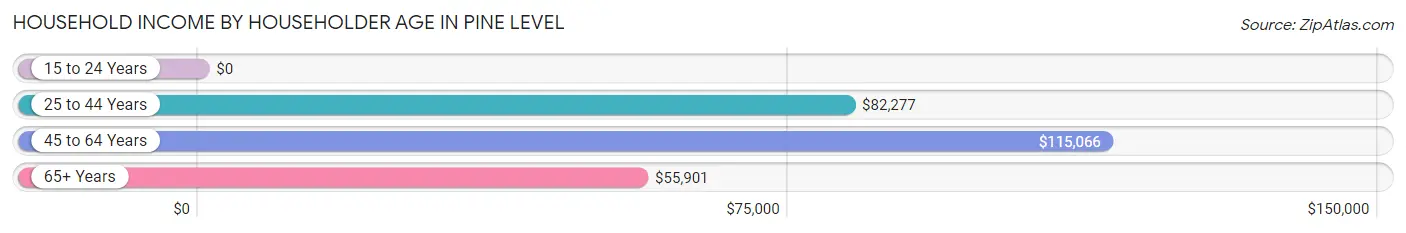
| Income Bracket | # Households | Median Income |
| 15 to 24 Years | 0 (0.0%) | $0 |
| 25 to 44 Years | 498 (35.4%) | $82,277 |
| 45 to 64 Years | 572 (40.7%) | $115,066 |
| 65+ Years | 335 (23.8%) | $55,901 |
| Total | 1,405 (100.0%) | $82,301 |
Poverty in Pine Level
Income Below Poverty by Sex and Age in Pine Level
With 3.6% poverty level for males and 1.4% for females among the residents of Pine Level, 25 to 34 year old males and 65 to 74 year old females are the most vulnerable to poverty, with 67 males (21.6%) and 10 females (8.0%) in their respective age groups living below the poverty level.
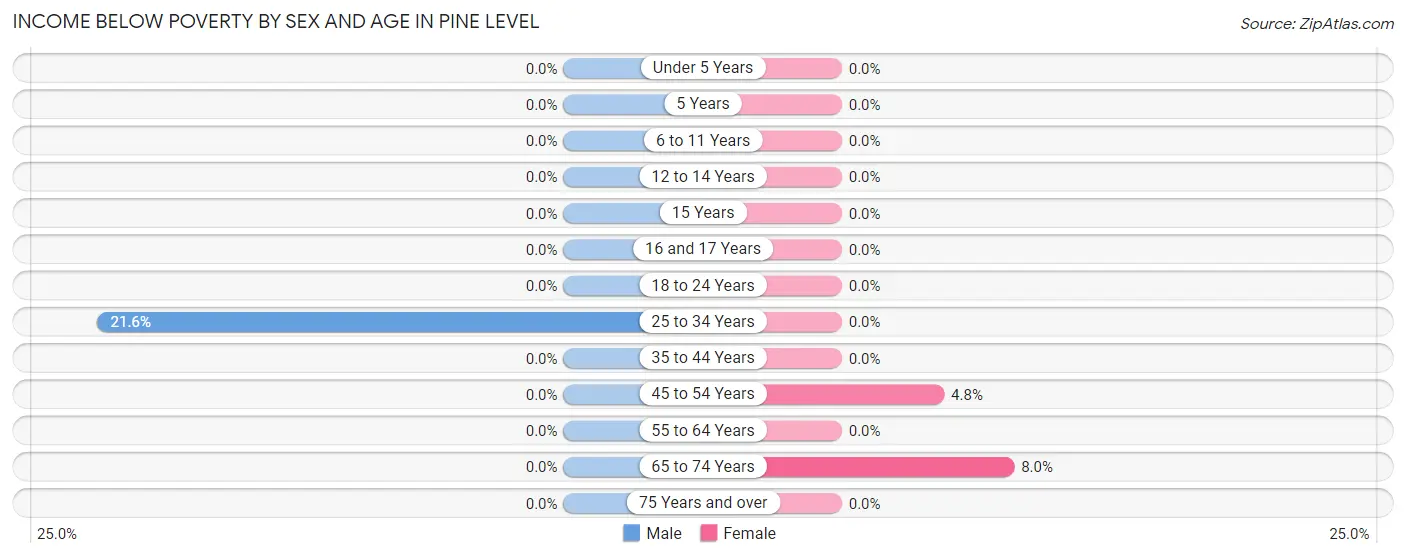
| Age Bracket | Male | Female |
| Under 5 Years | 0 (0.0%) | 0 (0.0%) |
| 5 Years | 0 (0.0%) | 0 (0.0%) |
| 6 to 11 Years | 0 (0.0%) | 0 (0.0%) |
| 12 to 14 Years | 0 (0.0%) | 0 (0.0%) |
| 15 Years | 0 (0.0%) | 0 (0.0%) |
| 16 and 17 Years | 0 (0.0%) | 0 (0.0%) |
| 18 to 24 Years | 0 (0.0%) | 0 (0.0%) |
| 25 to 34 Years | 67 (21.6%) | 0 (0.0%) |
| 35 to 44 Years | 0 (0.0%) | 0 (0.0%) |
| 45 to 54 Years | 0 (0.0%) | 19 (4.8%) |
| 55 to 64 Years | 0 (0.0%) | 0 (0.0%) |
| 65 to 74 Years | 0 (0.0%) | 10 (8.0%) |
| 75 Years and over | 0 (0.0%) | 0 (0.0%) |
| Total | 67 (3.6%) | 29 (1.4%) |
Income Above Poverty by Sex and Age in Pine Level
According to the poverty statistics in Pine Level, males aged under 5 years and females aged under 5 years are the age groups that are most secure financially, with 100.0% of males and 100.0% of females in these age groups living above the poverty line.
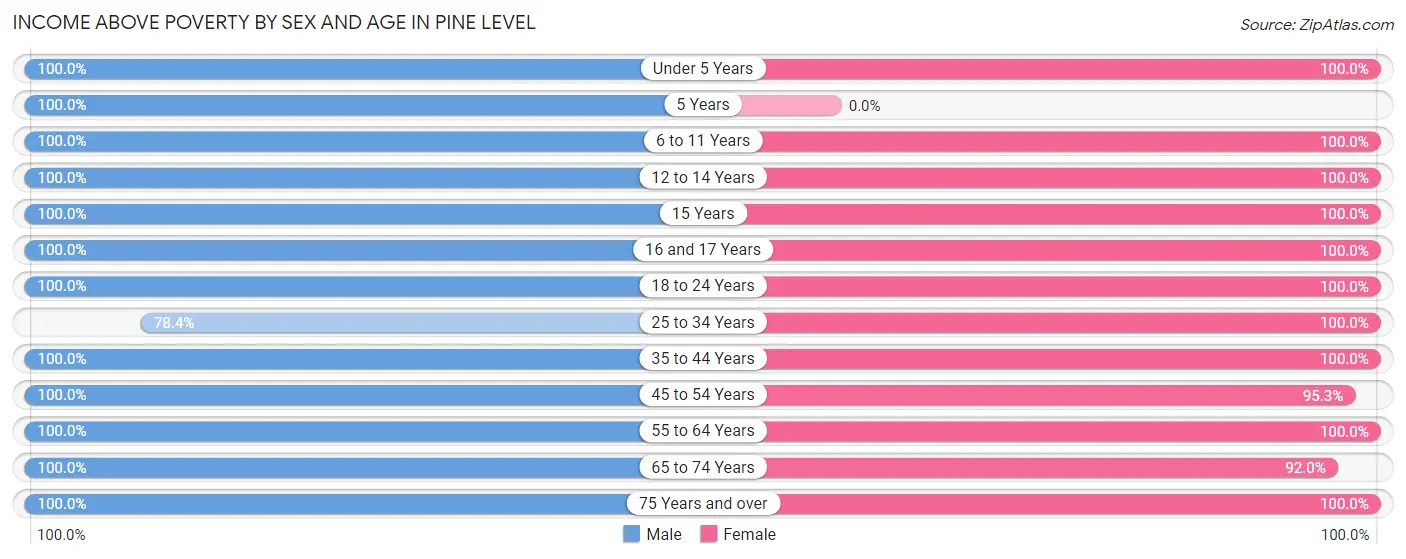
| Age Bracket | Male | Female |
| Under 5 Years | 212 (100.0%) | 162 (100.0%) |
| 5 Years | 73 (100.0%) | 0 (0.0%) |
| 6 to 11 Years | 133 (100.0%) | 110 (100.0%) |
| 12 to 14 Years | 26 (100.0%) | 53 (100.0%) |
| 15 Years | 19 (100.0%) | 26 (100.0%) |
| 16 and 17 Years | 82 (100.0%) | 99 (100.0%) |
| 18 to 24 Years | 65 (100.0%) | 179 (100.0%) |
| 25 to 34 Years | 243 (78.4%) | 259 (100.0%) |
| 35 to 44 Years | 243 (100.0%) | 149 (100.0%) |
| 45 to 54 Years | 323 (100.0%) | 381 (95.3%) |
| 55 to 64 Years | 159 (100.0%) | 331 (100.0%) |
| 65 to 74 Years | 123 (100.0%) | 115 (92.0%) |
| 75 Years and over | 97 (100.0%) | 123 (100.0%) |
| Total | 1,798 (96.4%) | 1,987 (98.6%) |
Income Below Poverty Among Married-Couple Families in Pine Level
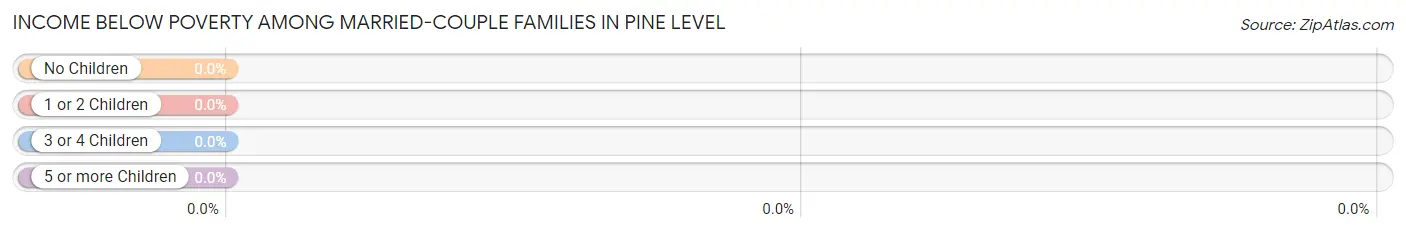
| Children | Above Poverty | Below Poverty |
| No Children | 424 (100.0%) | 0 (0.0%) |
| 1 or 2 Children | 300 (100.0%) | 0 (0.0%) |
| 3 or 4 Children | 54 (100.0%) | 0 (0.0%) |
| 5 or more Children | 0 (0.0%) | 0 (0.0%) |
| Total | 778 (100.0%) | 0 (0.0%) |
Income Below Poverty Among Single-Parent Households in Pine Level
| Children | Single Father | Single Mother |
| No Children | 0 (0.0%) | 0 (0.0%) |
| 1 or 2 Children | 0 (0.0%) | 0 (0.0%) |
| 3 or 4 Children | 0 (0.0%) | 0 (0.0%) |
| 5 or more Children | 0 (0.0%) | 0 (0.0%) |
| Total | 0 (0.0%) | 0 (0.0%) |
Income Below Poverty Among Married-Couple vs Single-Parent Households in Pine Level
| Children | Married-Couple Families | Single-Parent Households |
| No Children | 0 (0.0%) | 0 (0.0%) |
| 1 or 2 Children | 0 (0.0%) | 0 (0.0%) |
| 3 or 4 Children | 0 (0.0%) | 0 (0.0%) |
| 5 or more Children | 0 (0.0%) | 0 (0.0%) |
| Total | 0 (0.0%) | 0 (0.0%) |
Race in Pine Level
The most populous races in Pine Level are White / Caucasian (3,451 | 88.9%), Black / African American (430 | 11.1%), and Hispanic or Latino (200 | 5.1%).
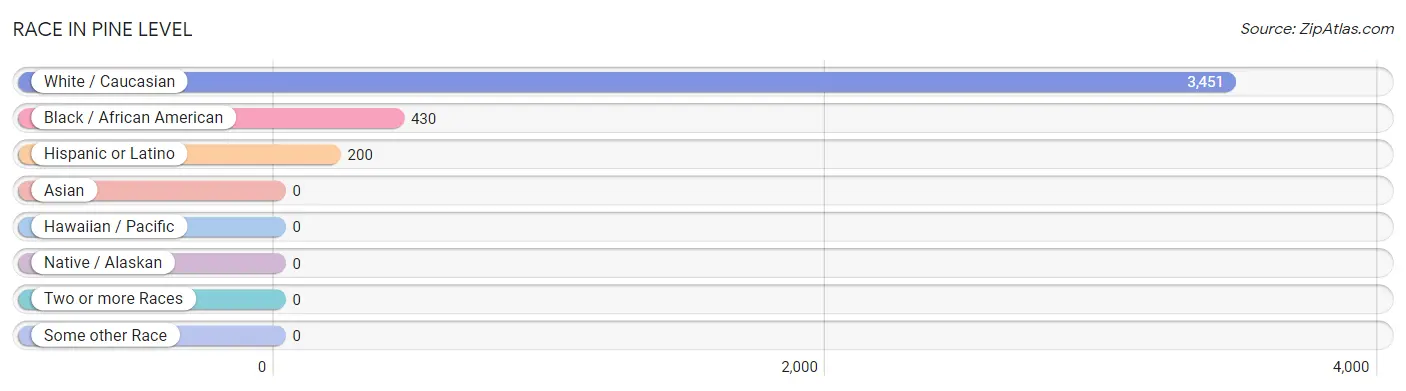
| Race | # Population | % Population |
| Asian | 0 | 0.0% |
| Black / African American | 430 | 11.1% |
| Hawaiian / Pacific | 0 | 0.0% |
| Hispanic or Latino | 200 | 5.1% |
| Native / Alaskan | 0 | 0.0% |
| White / Caucasian | 3,451 | 88.9% |
| Two or more Races | 0 | 0.0% |
| Some other Race | 0 | 0.0% |
| Total | 3,881 | 100.0% |
Ancestry in Pine Level
The most populous ancestries reported in Pine Level are English (627 | 16.2%), American (426 | 11.0%), Irish (339 | 8.7%), German (283 | 7.3%), and Scottish (201 | 5.2%), together accounting for 48.3% of all Pine Level residents.
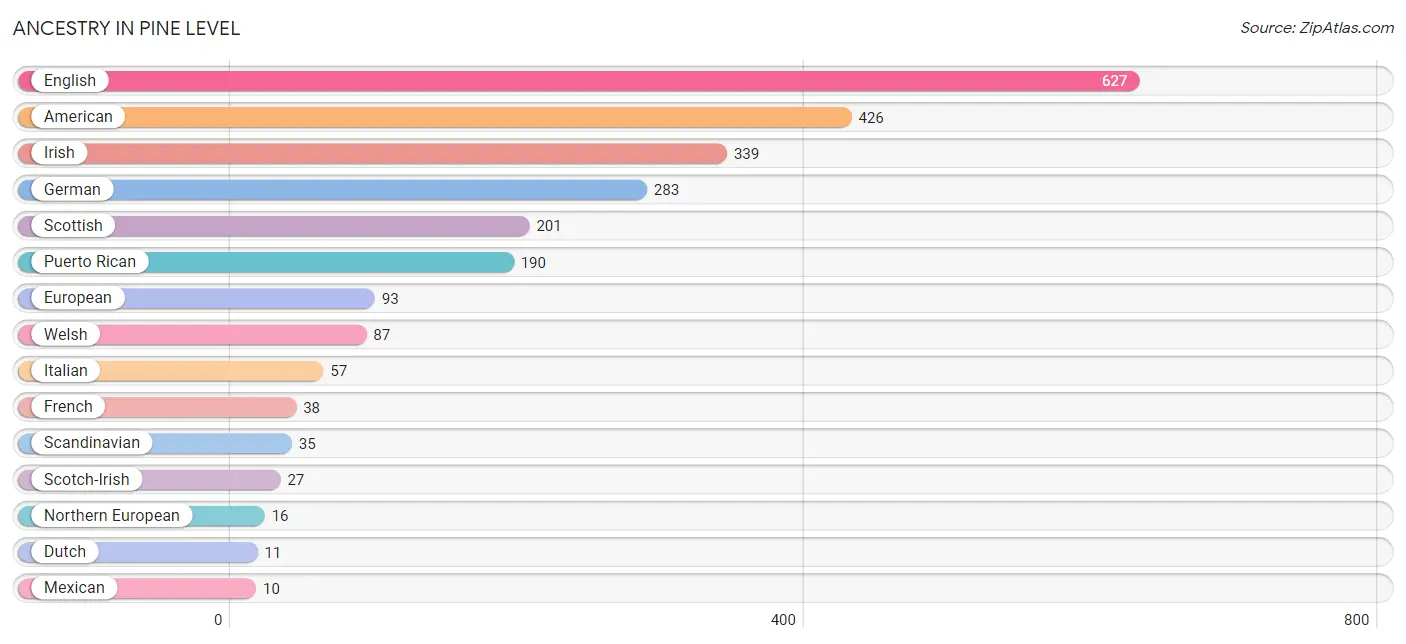
| Ancestry | # Population | % Population |
| American | 426 | 11.0% |
| Dutch | 11 | 0.3% |
| English | 627 | 16.2% |
| European | 93 | 2.4% |
| French | 38 | 1.0% |
| German | 283 | 7.3% |
| Irish | 339 | 8.7% |
| Italian | 57 | 1.5% |
| Mexican | 10 | 0.3% |
| Northern European | 16 | 0.4% |
| Puerto Rican | 190 | 4.9% |
| Scandinavian | 35 | 0.9% |
| Scotch-Irish | 27 | 0.7% |
| Scottish | 201 | 5.2% |
| Welsh | 87 | 2.2% | View All 15 Rows |
Immigrants in Pine Level
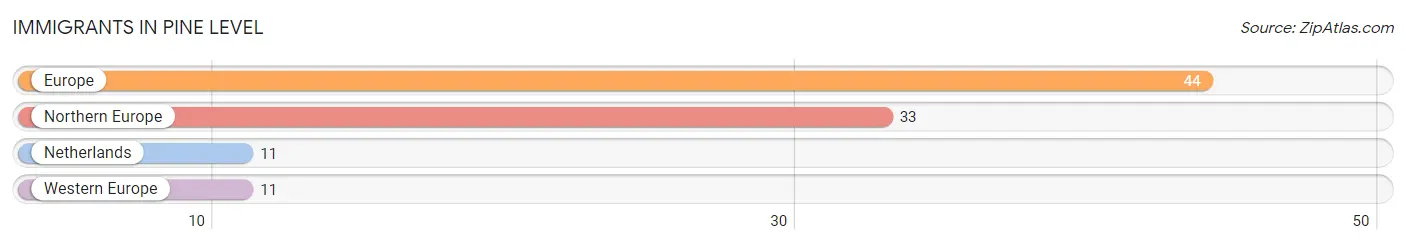
The most numerous immigrant groups reported in Pine Level came from Europe (44 | 1.1%), Northern Europe (33 | 0.9%), Netherlands (11 | 0.3%), and Western Europe (11 | 0.3%), together accounting for 2.5% of all Pine Level residents.
| Immigration Origin | # Population | % Population |
| Europe | 44 | 1.1% |
| Netherlands | 11 | 0.3% |
| Northern Europe | 33 | 0.9% |
| Western Europe | 11 | 0.3% | View All 4 Rows |
Sex and Age in Pine Level
Sex and Age in Pine Level
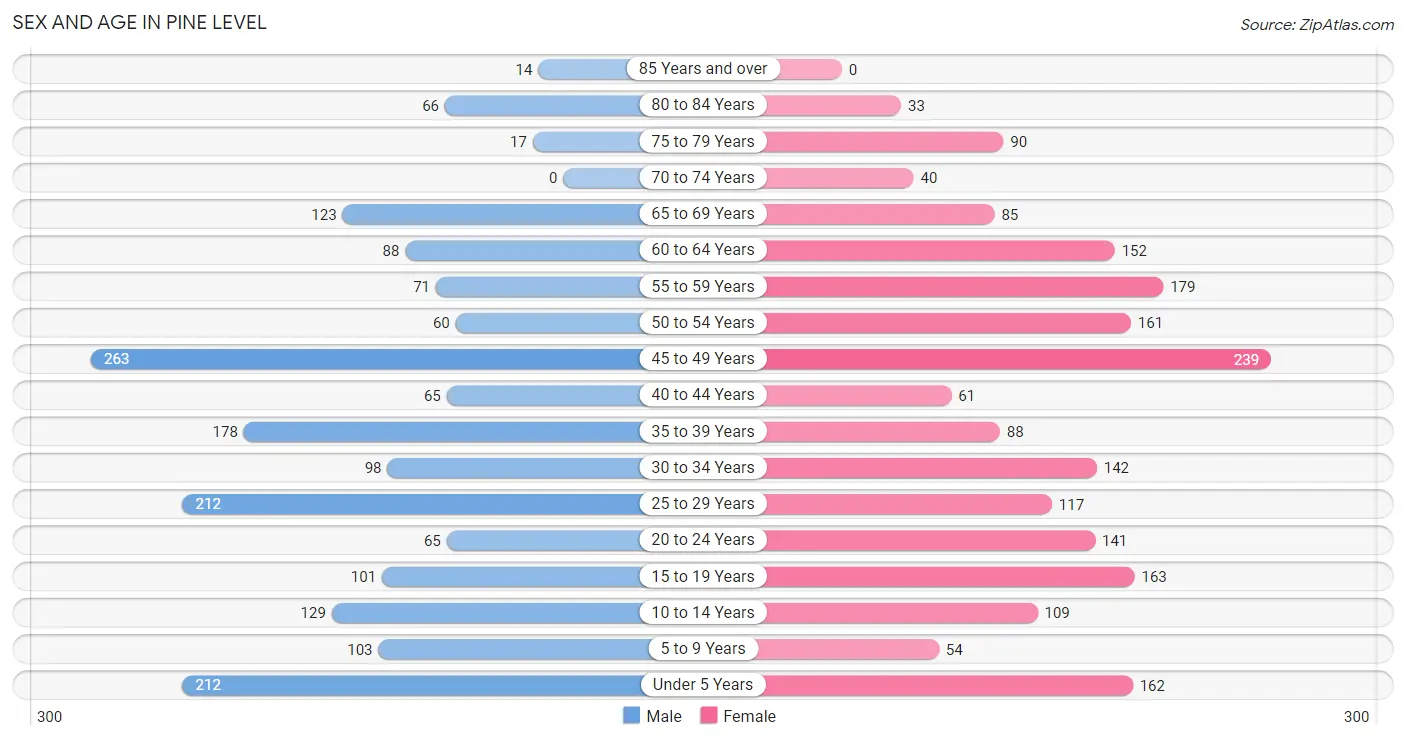
The most populous age groups in Pine Level are 45 to 49 Years (263 | 14.1%) for men and 45 to 49 Years (239 | 11.9%) for women.
| Age Bracket | Male | Female |
| Under 5 Years | 212 (11.4%) | 162 (8.0%) |
| 5 to 9 Years | 103 (5.5%) | 54 (2.7%) |
| 10 to 14 Years | 129 (6.9%) | 109 (5.4%) |
| 15 to 19 Years | 101 (5.4%) | 163 (8.1%) |
| 20 to 24 Years | 65 (3.5%) | 141 (7.0%) |
| 25 to 29 Years | 212 (11.4%) | 117 (5.8%) |
| 30 to 34 Years | 98 (5.2%) | 142 (7.0%) |
| 35 to 39 Years | 178 (9.5%) | 88 (4.4%) |
| 40 to 44 Years | 65 (3.5%) | 61 (3.0%) |
| 45 to 49 Years | 263 (14.1%) | 239 (11.9%) |
| 50 to 54 Years | 60 (3.2%) | 161 (8.0%) |
| 55 to 59 Years | 71 (3.8%) | 179 (8.9%) |
| 60 to 64 Years | 88 (4.7%) | 152 (7.5%) |
| 65 to 69 Years | 123 (6.6%) | 85 (4.2%) |
| 70 to 74 Years | 0 (0.0%) | 40 (2.0%) |
| 75 to 79 Years | 17 (0.9%) | 90 (4.5%) |
| 80 to 84 Years | 66 (3.5%) | 33 (1.6%) |
| 85 Years and over | 14 (0.7%) | 0 (0.0%) |
| Total | 1,865 (100.0%) | 2,016 (100.0%) |
Families and Households in Pine Level
Median Family Size in Pine Level
The median family size in Pine Level is 3.51 persons per family, with single male/father families (47 | 5.0%) accounting for the largest median family size of 7.28 persons per family. On the other hand, single female/mother families (118 | 12.5%) represent the smallest median family size with 3.11 persons per family.
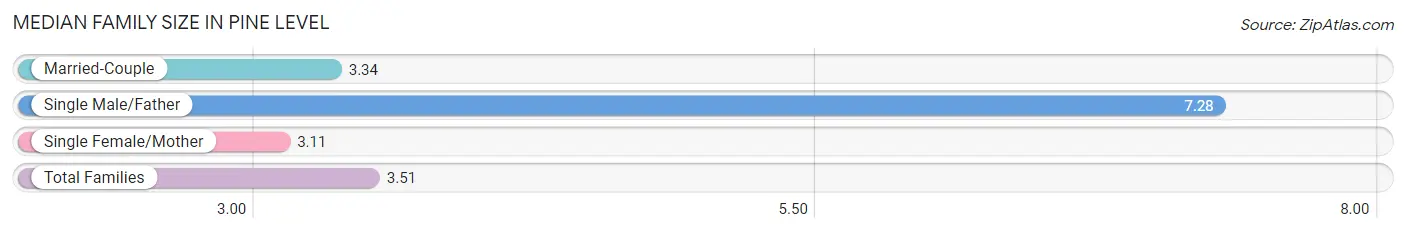
| Family Type | # Families | Family Size |
| Married-Couple | 778 (82.5%) | 3.34 |
| Single Male/Father | 47 (5.0%) | 7.28 |
| Single Female/Mother | 118 (12.5%) | 3.11 |
| Total Families | 943 (100.0%) | 3.51 |
Median Household Size in Pine Level
The median household size in Pine Level is 2.76 persons per household, with single male/father households (47 | 3.4%) accounting for the largest median household size of 7.94 persons per household. non-family households (462 | 32.9%) represent the smallest median household size with 1.08 persons per household.
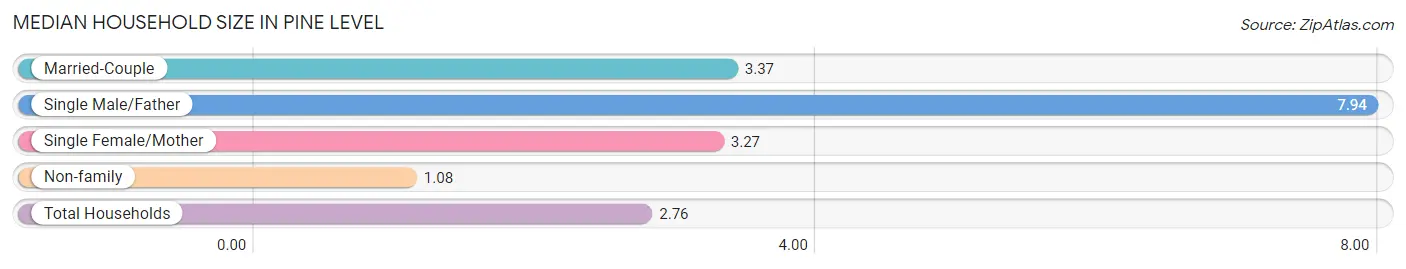
| Household Type | # Households | Household Size |
| Married-Couple | 778 (55.4%) | 3.37 |
| Single Male/Father | 47 (3.4%) | 7.94 |
| Single Female/Mother | 118 (8.4%) | 3.27 |
| Non-family | 462 (32.9%) | 1.08 |
| Total Households | 1,405 (100.0%) | 2.76 |
Household Size by Marriage Status in Pine Level
Out of a total of 1,405 households in Pine Level, 943 (67.1%) are family households, while 462 (32.9%) are nonfamily households. The most numerous type of family households are 2-person households, comprising 393, and the most common type of nonfamily households are 1-person households, comprising 421.
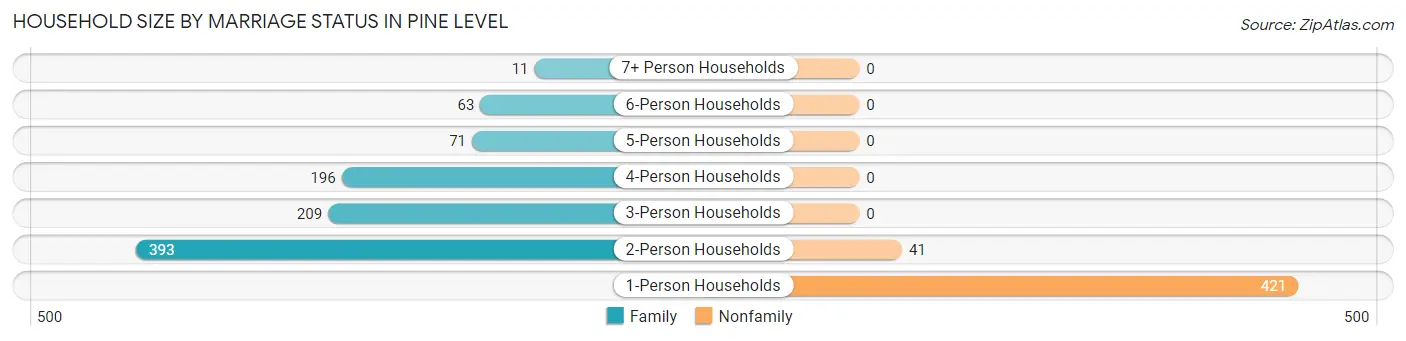
| Household Size | Family Households | Nonfamily Households |
| 1-Person Households | - | 421 (30.0%) |
| 2-Person Households | 393 (28.0%) | 41 (2.9%) |
| 3-Person Households | 209 (14.9%) | 0 (0.0%) |
| 4-Person Households | 196 (14.0%) | 0 (0.0%) |
| 5-Person Households | 71 (5.1%) | 0 (0.0%) |
| 6-Person Households | 63 (4.5%) | 0 (0.0%) |
| 7+ Person Households | 11 (0.8%) | 0 (0.0%) |
| Total | 943 (67.1%) | 462 (32.9%) |
Female Fertility in Pine Level
Fertility by Age in Pine Level
Average fertility rate in Pine Level is 45.0 births per 1,000 women. Women in the age bracket of 20 to 34 years have the highest fertility rate with 65.0 births per 1,000 women. Women in the age bracket of 20 to 34 years acount for 57.8% of all women with births.
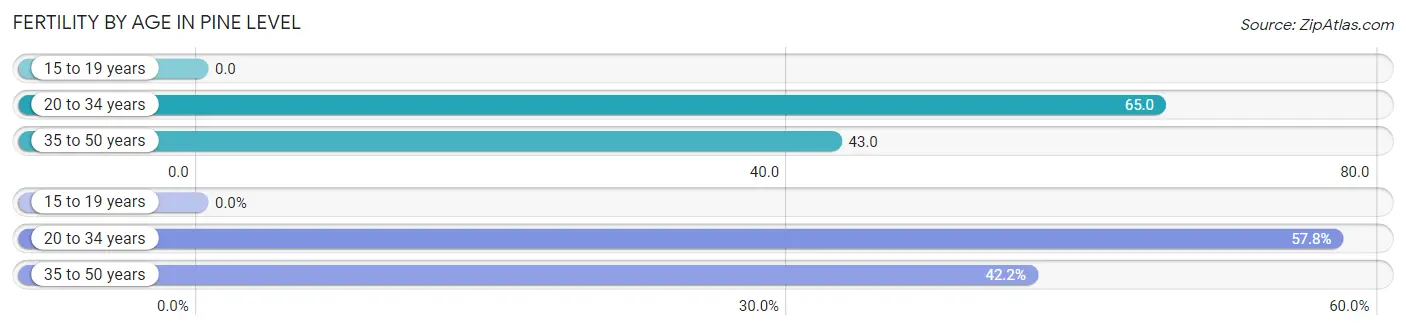
| Age Bracket | Women with Births | Births / 1,000 Women |
| 15 to 19 years | 0 (0.0%) | 0.0 |
| 20 to 34 years | 26 (57.8%) | 65.0 |
| 35 to 50 years | 19 (42.2%) | 43.0 |
| Total | 45 (100.0%) | 45.0 |
Fertility by Age by Marriage Status in Pine Level
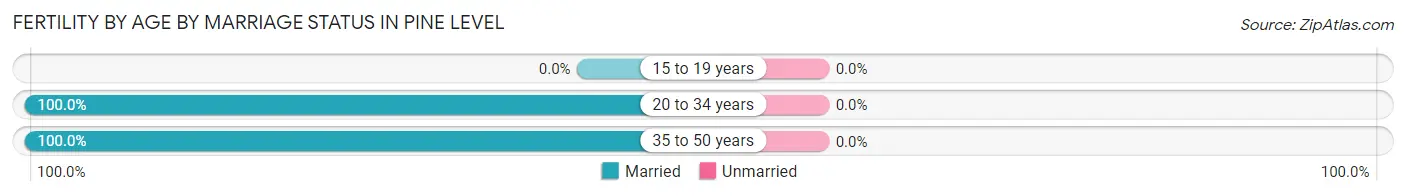
| Age Bracket | Married | Unmarried |
| 15 to 19 years | 0 (0.0%) | 0 (0.0%) |
| 20 to 34 years | 26 (100.0%) | 0 (0.0%) |
| 35 to 50 years | 19 (100.0%) | 0 (0.0%) |
| Total | 45 (100.0%) | 0 (0.0%) |
Fertility by Education in Pine Level
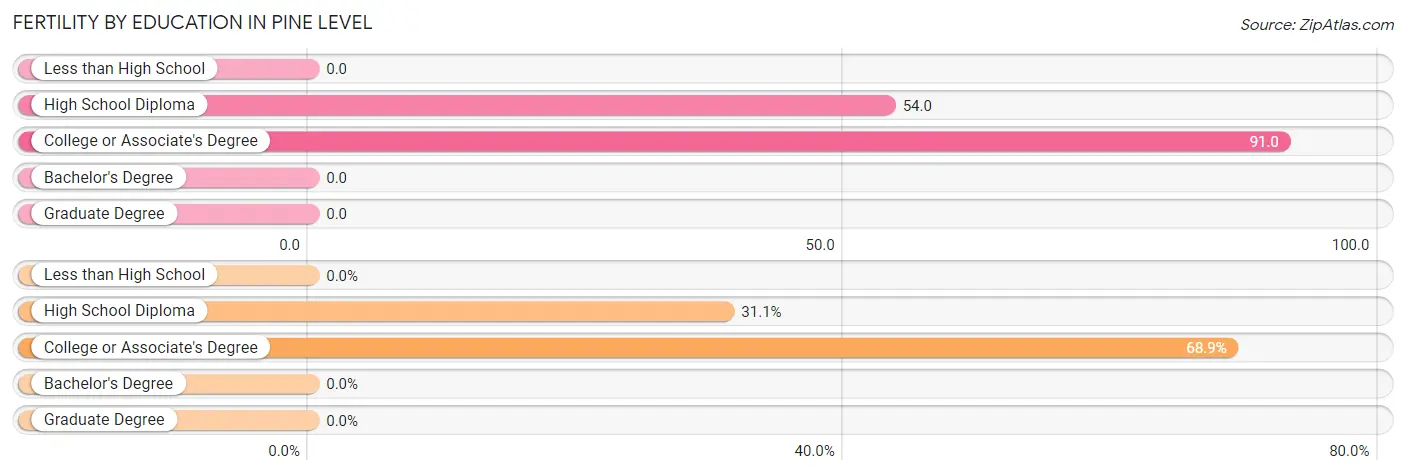
| Educational Attainment | Women with Births | Births / 1,000 Women |
| Less than High School | 0 (0.0%) | 0.0 |
| High School Diploma | 14 (31.1%) | 54.0 |
| College or Associate's Degree | 31 (68.9%) | 91.0 |
| Bachelor's Degree | 0 (0.0%) | 0.0 |
| Graduate Degree | 0 (0.0%) | 0.0 |
| Total | 45 (100.0%) | 45.0 |
Fertility by Education by Marriage Status in Pine Level
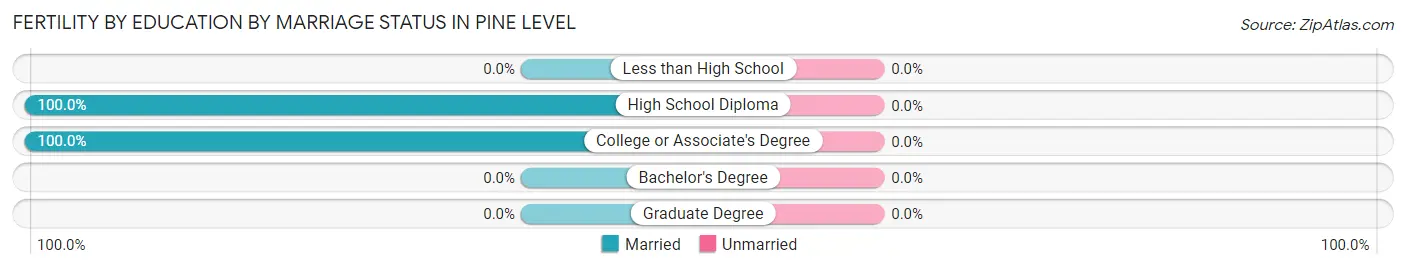
| Educational Attainment | Married | Unmarried |
| Less than High School | 0 (0.0%) | 0 (0.0%) |
| High School Diploma | 14 (100.0%) | 0 (0.0%) |
| College or Associate's Degree | 31 (100.0%) | 0 (0.0%) |
| Bachelor's Degree | 0 (0.0%) | 0 (0.0%) |
| Graduate Degree | 0 (0.0%) | 0 (0.0%) |
| Total | 45 (100.0%) | 0 (0.0%) |
Employment Characteristics in Pine Level
Employment by Class of Employer in Pine Level
Among the 1,932 employed individuals in Pine Level, private company employees (1,273 | 65.9%), state government employees (255 | 13.2%), and not-for-profit organizations (129 | 6.7%) make up the most common classes of employment.
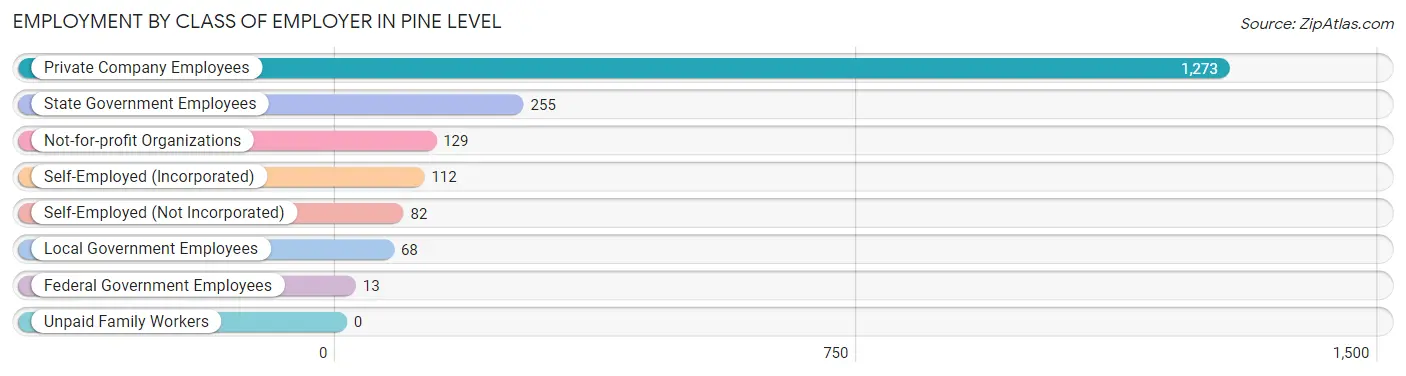
| Employer Class | # Employees | % Employees |
| Private Company Employees | 1,273 | 65.9% |
| Self-Employed (Incorporated) | 112 | 5.8% |
| Self-Employed (Not Incorporated) | 82 | 4.2% |
| Not-for-profit Organizations | 129 | 6.7% |
| Local Government Employees | 68 | 3.5% |
| State Government Employees | 255 | 13.2% |
| Federal Government Employees | 13 | 0.7% |
| Unpaid Family Workers | 0 | 0.0% |
| Total | 1,932 | 100.0% |
Employment Status by Age in Pine Level
According to the labor force statistics for Pine Level, out of the total population over 16 years of age (3,067), 67.2% or 2,061 individuals are in the labor force, with 4.4% or 91 of them unemployed. The age group with the highest labor force participation rate is 35 to 44 years, with 96.7% or 379 individuals in the labor force. Within the labor force, the 25 to 29 years age range has the highest percentage of unemployed individuals, with 29.7% or 91 of them being unemployed.
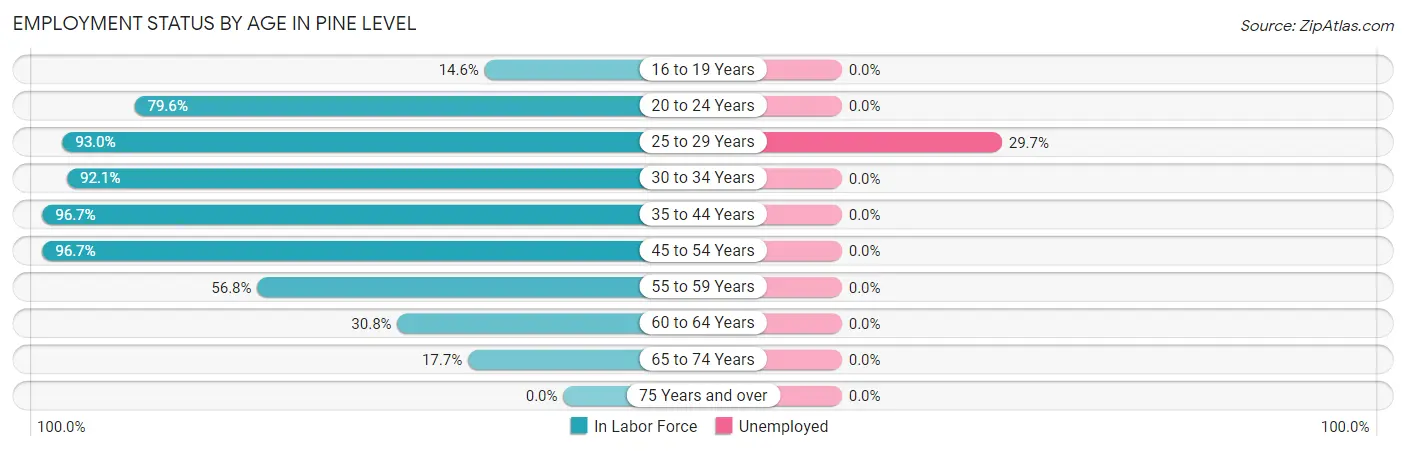
| Age Bracket | In Labor Force | Unemployed |
| 16 to 19 Years | 32 (14.6%) | 0 (0.0%) |
| 20 to 24 Years | 164 (79.6%) | 0 (0.0%) |
| 25 to 29 Years | 306 (93.0%) | 91 (29.7%) |
| 30 to 34 Years | 221 (92.1%) | 0 (0.0%) |
| 35 to 44 Years | 379 (96.7%) | 0 (0.0%) |
| 45 to 54 Years | 699 (96.7%) | 0 (0.0%) |
| 55 to 59 Years | 142 (56.8%) | 0 (0.0%) |
| 60 to 64 Years | 74 (30.8%) | 0 (0.0%) |
| 65 to 74 Years | 44 (17.7%) | 0 (0.0%) |
| 75 Years and over | 0 (0.0%) | 0 (0.0%) |
| Total | 2,061 (67.2%) | 91 (4.4%) |
Employment Status by Educational Attainment in Pine Level
According to labor force statistics for Pine Level, 83.8% of individuals (1,822) out of the total population between 25 and 64 years of age (2,174) are in the labor force, with 5.0% or 91 of them being unemployed. The group with the highest labor force participation rate are those with the educational attainment of college / associate degree, with 86.3% or 744 individuals in the labor force. Within the labor force, individuals with college / associate degree education have the highest percentage of unemployment, with 9.2% or 68 of them being unemployed.
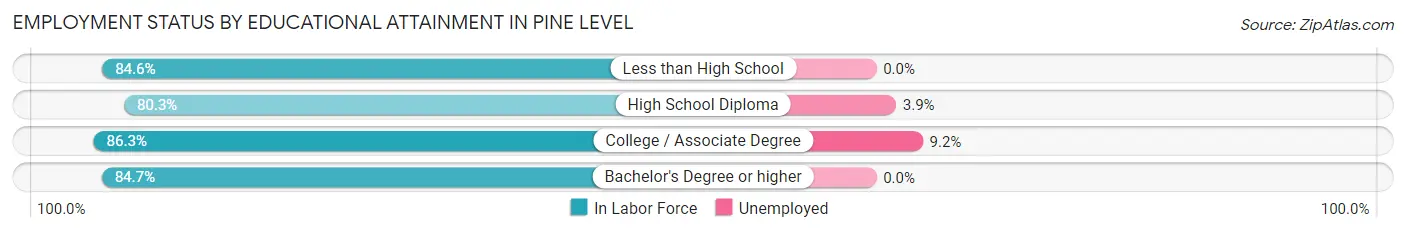
| Educational Attainment | In Labor Force | Unemployed |
| Less than High School | 66 (84.6%) | 0 (0.0%) |
| High School Diploma | 623 (80.3%) | 30 (3.9%) |
| College / Associate Degree | 744 (86.3%) | 79 (9.2%) |
| Bachelor's Degree or higher | 388 (84.7%) | 0 (0.0%) |
| Total | 1,822 (83.8%) | 109 (5.0%) |
Employment Occupations by Sex in Pine Level
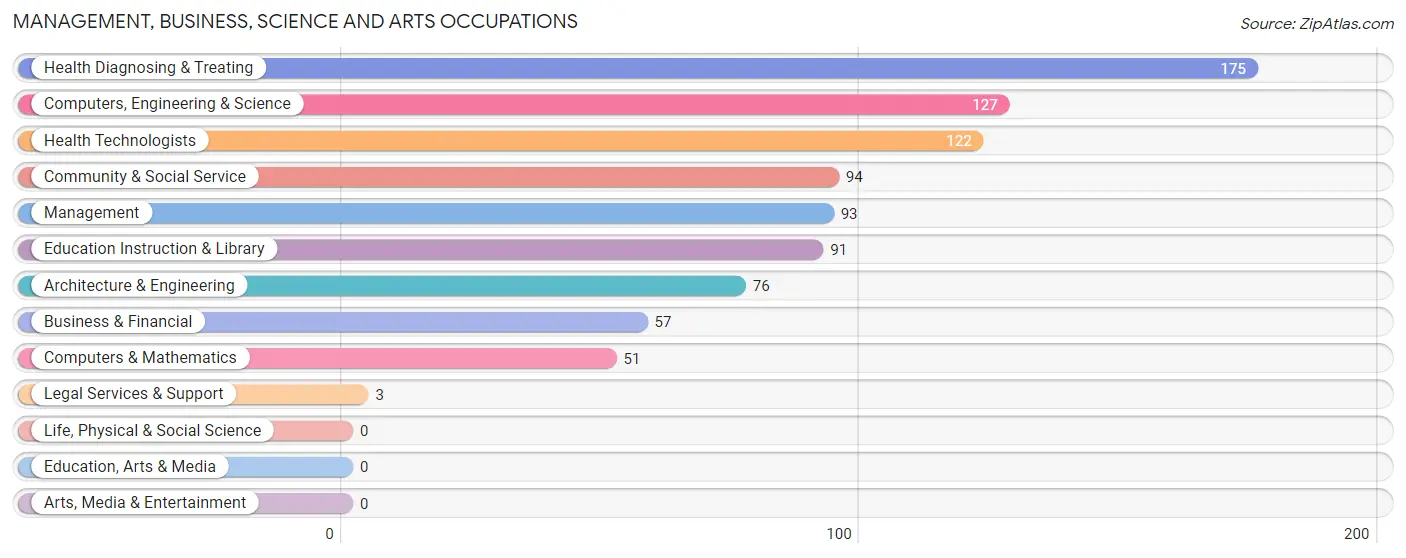
Management, Business, Science and Arts Occupations
The most common Management, Business, Science and Arts occupations in Pine Level are Health Diagnosing & Treating (175 | 8.9%), Computers, Engineering & Science (127 | 6.5%), Health Technologists (122 | 6.2%), Community & Social Service (94 | 4.8%), and Management (93 | 4.8%).
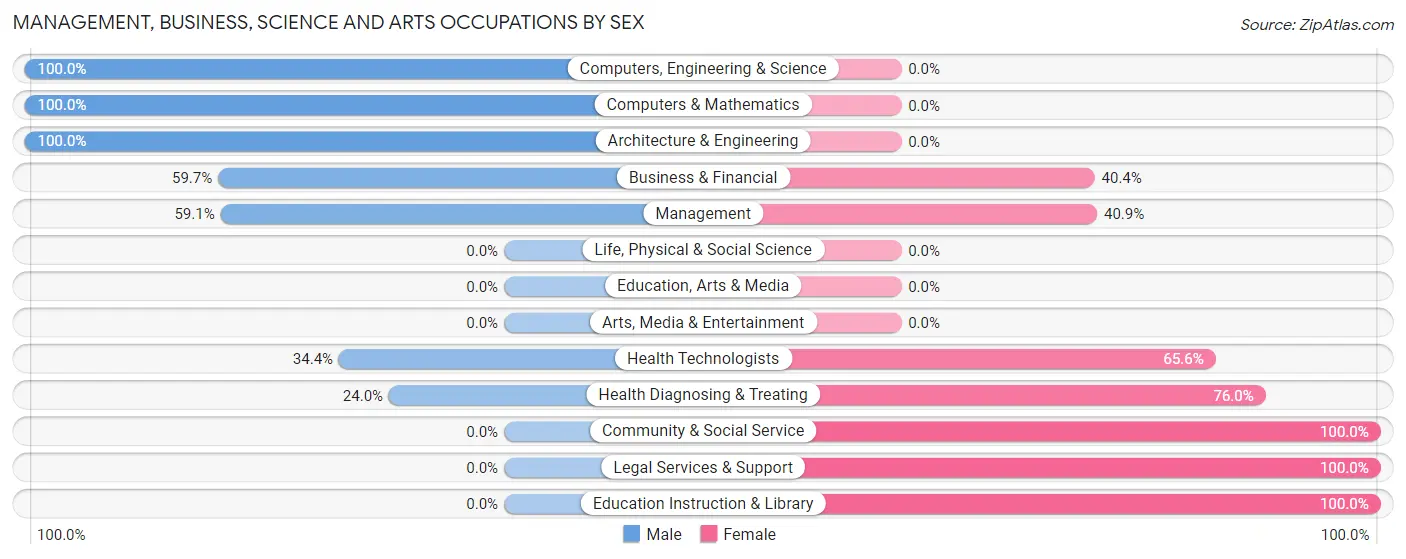
Management, Business, Science and Arts Occupations by Sex
Within the Management, Business, Science and Arts occupations in Pine Level, the most male-oriented occupations are Computers, Engineering & Science (100.0%), Computers & Mathematics (100.0%), and Architecture & Engineering (100.0%), while the most female-oriented occupations are Community & Social Service (100.0%), Legal Services & Support (100.0%), and Education Instruction & Library (100.0%).
| Occupation | Male | Female |
| Management | 55 (59.1%) | 38 (40.9%) |
| Business & Financial | 34 (59.7%) | 23 (40.4%) |
| Computers, Engineering & Science | 127 (100.0%) | 0 (0.0%) |
| Computers & Mathematics | 51 (100.0%) | 0 (0.0%) |
| Architecture & Engineering | 76 (100.0%) | 0 (0.0%) |
| Life, Physical & Social Science | 0 (0.0%) | 0 (0.0%) |
| Community & Social Service | 0 (0.0%) | 94 (100.0%) |
| Education, Arts & Media | 0 (0.0%) | 0 (0.0%) |
| Legal Services & Support | 0 (0.0%) | 3 (100.0%) |
| Education Instruction & Library | 0 (0.0%) | 91 (100.0%) |
| Arts, Media & Entertainment | 0 (0.0%) | 0 (0.0%) |
| Health Diagnosing & Treating | 42 (24.0%) | 133 (76.0%) |
| Health Technologists | 42 (34.4%) | 80 (65.6%) |
| Total (Category) | 258 (47.2%) | 288 (52.7%) |
| Total (Overall) | 973 (49.7%) | 984 (50.3%) |
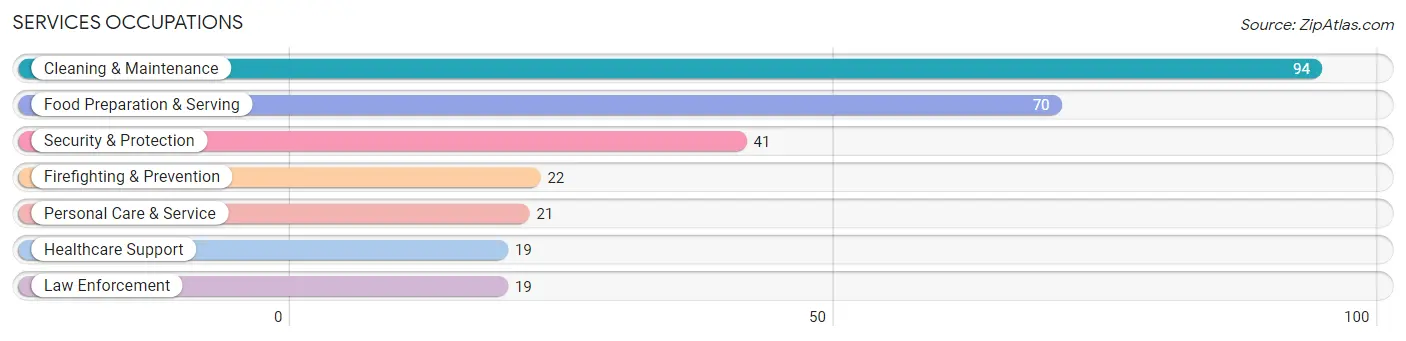
Services Occupations
The most common Services occupations in Pine Level are Cleaning & Maintenance (94 | 4.8%), Food Preparation & Serving (70 | 3.6%), Security & Protection (41 | 2.1%), Firefighting & Prevention (22 | 1.1%), and Personal Care & Service (21 | 1.1%).
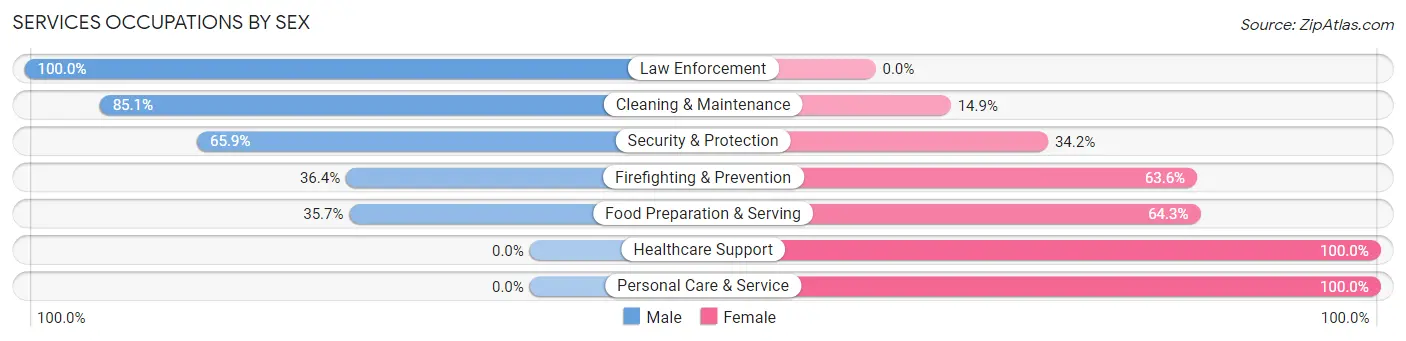
Services Occupations by Sex
Within the Services occupations in Pine Level, the most male-oriented occupations are Law Enforcement (100.0%), Cleaning & Maintenance (85.1%), and Security & Protection (65.8%), while the most female-oriented occupations are Healthcare Support (100.0%), Personal Care & Service (100.0%), and Food Preparation & Serving (64.3%).
| Occupation | Male | Female |
| Healthcare Support | 0 (0.0%) | 19 (100.0%) |
| Security & Protection | 27 (65.8%) | 14 (34.2%) |
| Firefighting & Prevention | 8 (36.4%) | 14 (63.6%) |
| Law Enforcement | 19 (100.0%) | 0 (0.0%) |
| Food Preparation & Serving | 25 (35.7%) | 45 (64.3%) |
| Cleaning & Maintenance | 80 (85.1%) | 14 (14.9%) |
| Personal Care & Service | 0 (0.0%) | 21 (100.0%) |
| Total (Category) | 132 (53.9%) | 113 (46.1%) |
| Total (Overall) | 973 (49.7%) | 984 (50.3%) |
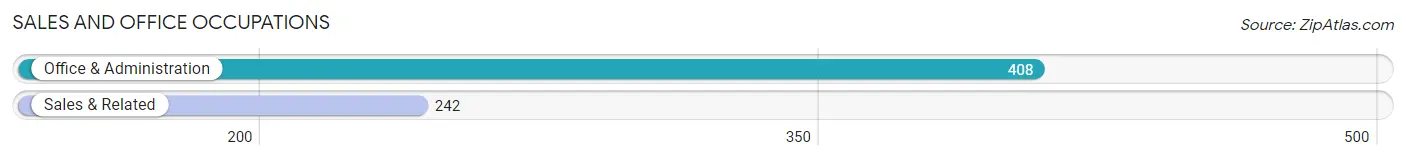
Sales and Office Occupations
The most common Sales and Office occupations in Pine Level are Office & Administration (408 | 20.8%), and Sales & Related (242 | 12.4%).
Sales and Office Occupations by Sex
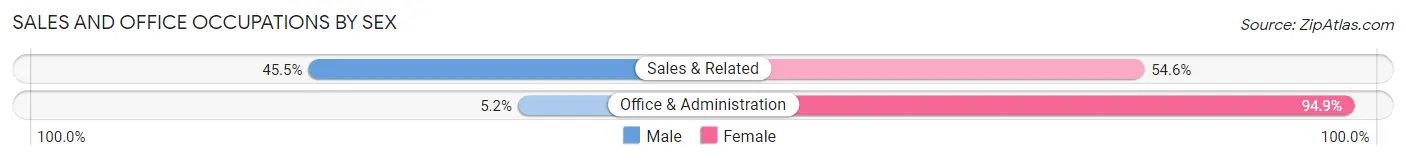
| Occupation | Male | Female |
| Sales & Related | 110 (45.5%) | 132 (54.5%) |
| Office & Administration | 21 (5.1%) | 387 (94.9%) |
| Total (Category) | 131 (20.2%) | 519 (79.8%) |
| Total (Overall) | 973 (49.7%) | 984 (50.3%) |
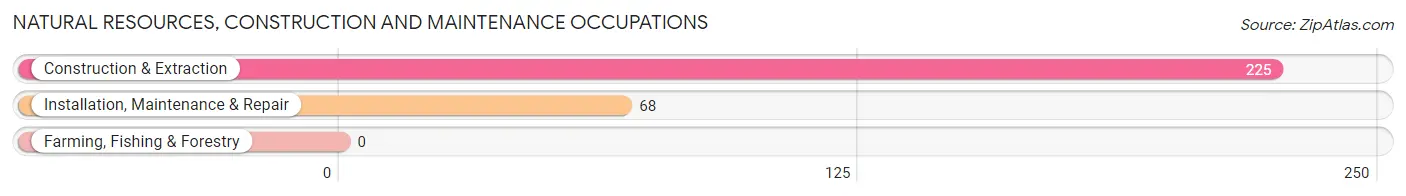
Natural Resources, Construction and Maintenance Occupations
The most common Natural Resources, Construction and Maintenance occupations in Pine Level are Construction & Extraction (225 | 11.5%), and Installation, Maintenance & Repair (68 | 3.5%).
Natural Resources, Construction and Maintenance Occupations by Sex
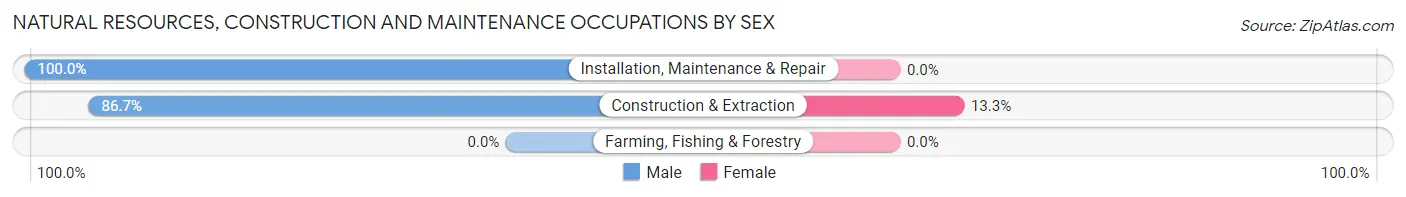
| Occupation | Male | Female |
| Farming, Fishing & Forestry | 0 (0.0%) | 0 (0.0%) |
| Construction & Extraction | 195 (86.7%) | 30 (13.3%) |
| Installation, Maintenance & Repair | 68 (100.0%) | 0 (0.0%) |
| Total (Category) | 263 (89.8%) | 30 (10.2%) |
| Total (Overall) | 973 (49.7%) | 984 (50.3%) |
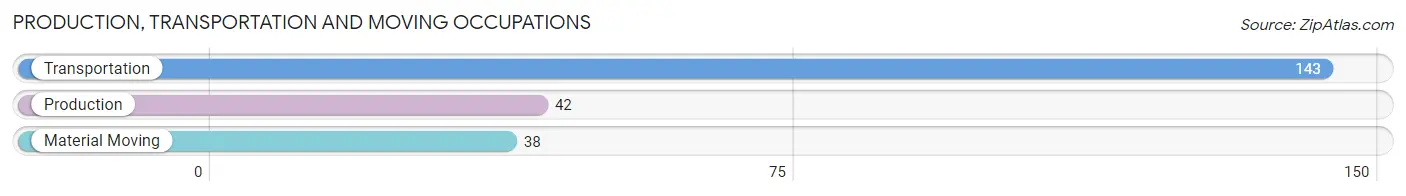
Production, Transportation and Moving Occupations
The most common Production, Transportation and Moving occupations in Pine Level are Transportation (143 | 7.3%), Production (42 | 2.1%), and Material Moving (38 | 1.9%).
Production, Transportation and Moving Occupations by Sex
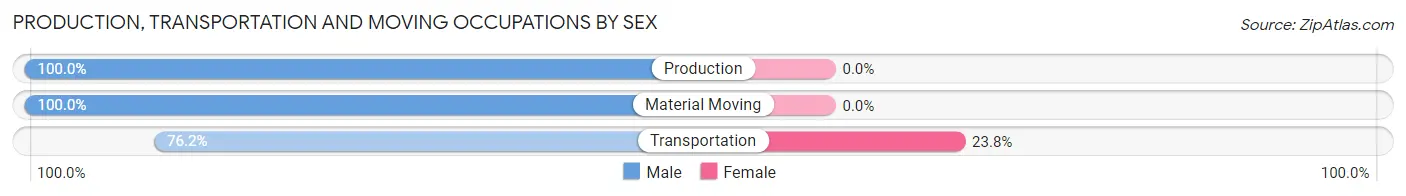
| Occupation | Male | Female |
| Production | 42 (100.0%) | 0 (0.0%) |
| Transportation | 109 (76.2%) | 34 (23.8%) |
| Material Moving | 38 (100.0%) | 0 (0.0%) |
| Total (Category) | 189 (84.8%) | 34 (15.2%) |
| Total (Overall) | 973 (49.7%) | 984 (50.3%) |
Employment Industries by Sex in Pine Level
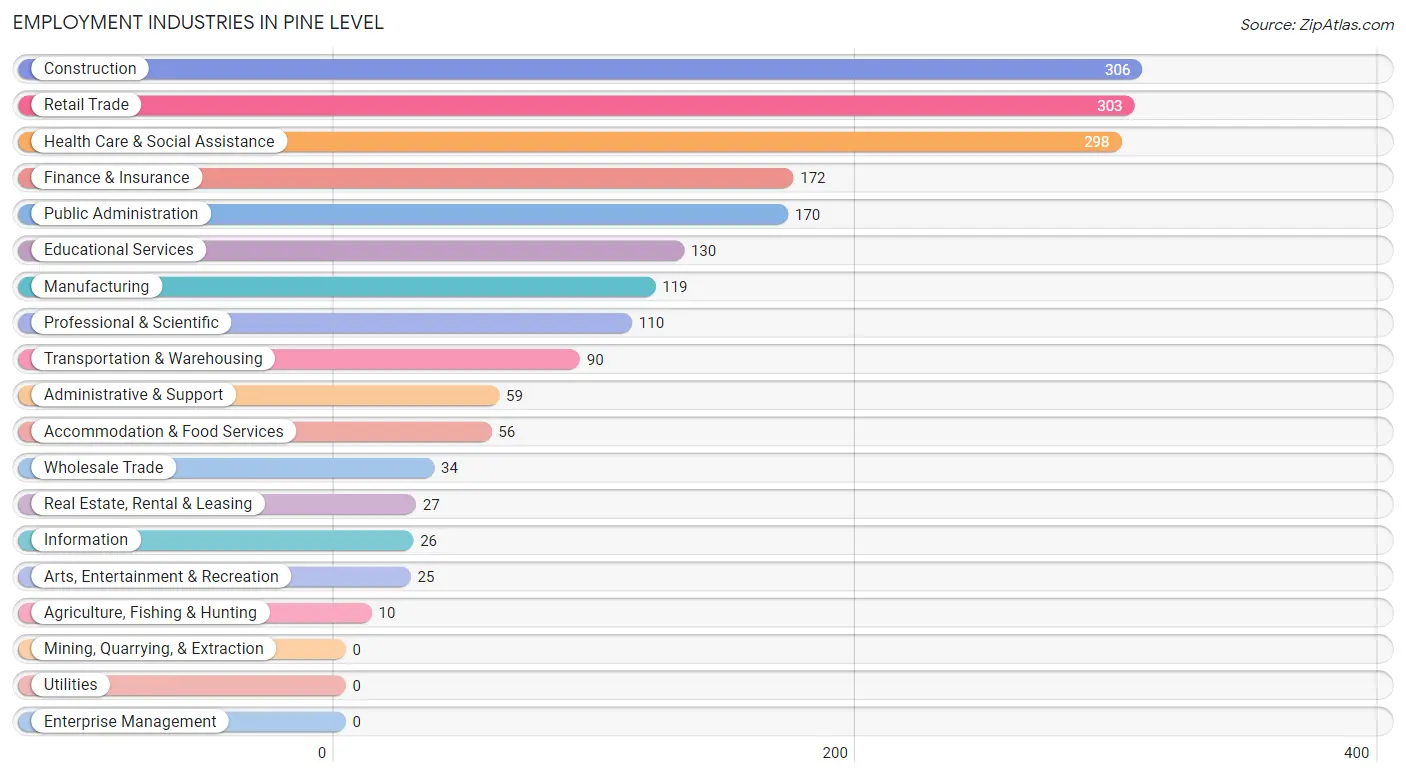
Employment Industries in Pine Level
The major employment industries in Pine Level include Construction (306 | 15.6%), Retail Trade (303 | 15.5%), Health Care & Social Assistance (298 | 15.2%), Finance & Insurance (172 | 8.8%), and Public Administration (170 | 8.7%).
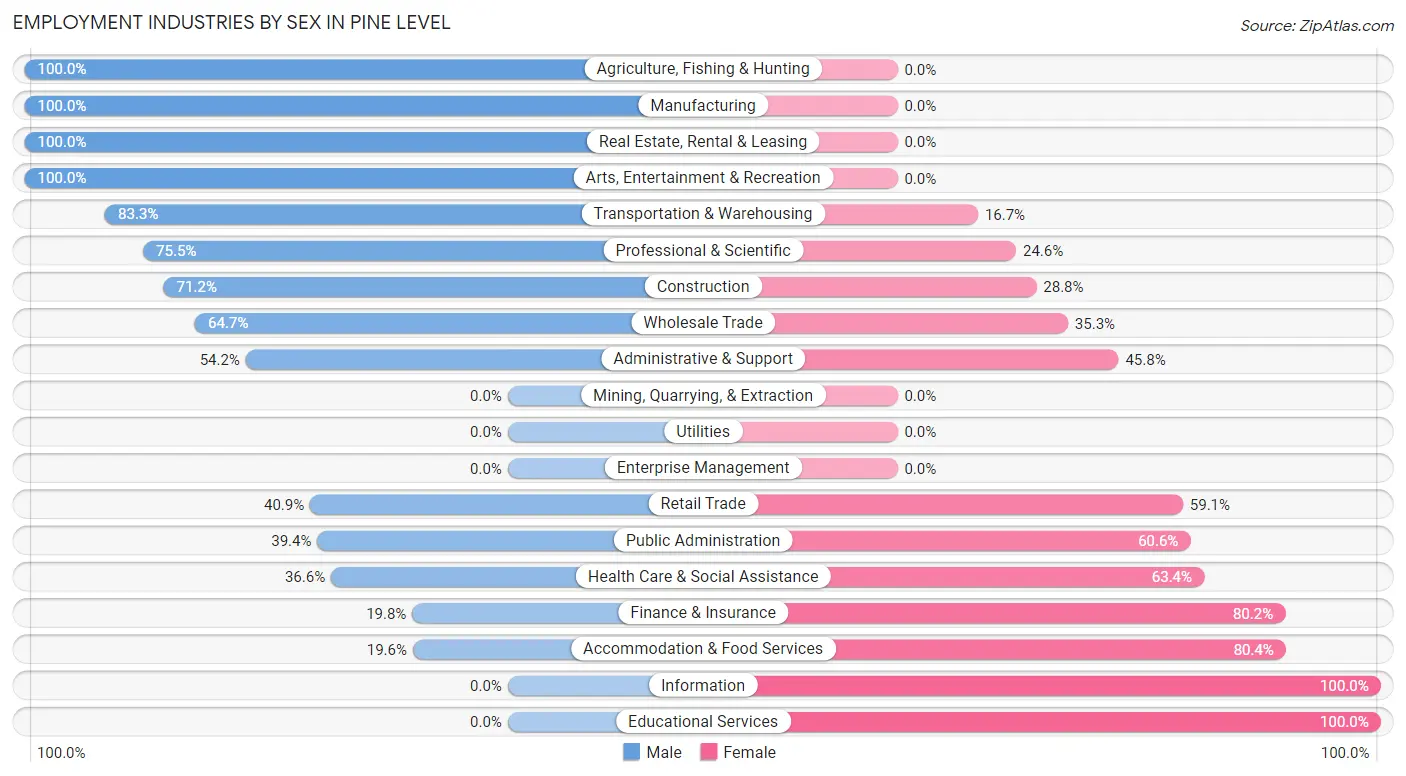
Employment Industries by Sex in Pine Level
The Pine Level industries that see more men than women are Agriculture, Fishing & Hunting (100.0%), Manufacturing (100.0%), and Real Estate, Rental & Leasing (100.0%), whereas the industries that tend to have a higher number of women are Information (100.0%), Educational Services (100.0%), and Accommodation & Food Services (80.4%).
| Industry | Male | Female |
| Agriculture, Fishing & Hunting | 10 (100.0%) | 0 (0.0%) |
| Mining, Quarrying, & Extraction | 0 (0.0%) | 0 (0.0%) |
| Construction | 218 (71.2%) | 88 (28.8%) |
| Manufacturing | 119 (100.0%) | 0 (0.0%) |
| Wholesale Trade | 22 (64.7%) | 12 (35.3%) |
| Retail Trade | 124 (40.9%) | 179 (59.1%) |
| Transportation & Warehousing | 75 (83.3%) | 15 (16.7%) |
| Utilities | 0 (0.0%) | 0 (0.0%) |
| Information | 0 (0.0%) | 26 (100.0%) |
| Finance & Insurance | 34 (19.8%) | 138 (80.2%) |
| Real Estate, Rental & Leasing | 27 (100.0%) | 0 (0.0%) |
| Professional & Scientific | 83 (75.4%) | 27 (24.5%) |
| Enterprise Management | 0 (0.0%) | 0 (0.0%) |
| Administrative & Support | 32 (54.2%) | 27 (45.8%) |
| Educational Services | 0 (0.0%) | 130 (100.0%) |
| Health Care & Social Assistance | 109 (36.6%) | 189 (63.4%) |
| Arts, Entertainment & Recreation | 25 (100.0%) | 0 (0.0%) |
| Accommodation & Food Services | 11 (19.6%) | 45 (80.4%) |
| Public Administration | 67 (39.4%) | 103 (60.6%) |
| Total | 973 (49.7%) | 984 (50.3%) |
Education in Pine Level
School Enrollment in Pine Level
The most common levels of schooling among the 877 students in Pine Level are high school (303 | 34.5%), middle school (171 | 19.5%), and elementary school (138 | 15.7%).
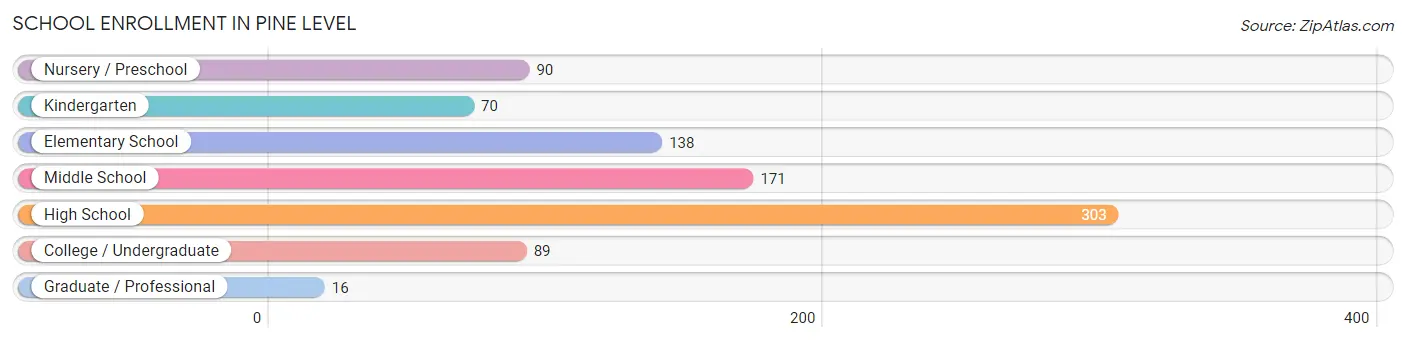
| School Level | # Students | % Students |
| Nursery / Preschool | 90 | 10.3% |
| Kindergarten | 70 | 8.0% |
| Elementary School | 138 | 15.7% |
| Middle School | 171 | 19.5% |
| High School | 303 | 34.5% |
| College / Undergraduate | 89 | 10.2% |
| Graduate / Professional | 16 | 1.8% |
| Total | 877 | 100.0% |
School Enrollment by Age by Funding Source in Pine Level
Out of a total of 877 students who are enrolled in schools in Pine Level, 202 (23.0%) attend a private institution, while the remaining 675 (77.0%) are enrolled in public schools. The age group of 18 to 19 year olds has the highest likelihood of being enrolled in private schools, with 19 (100.0% in the age bracket) enrolled. Conversely, the age group of 20 to 24 year olds has the lowest likelihood of being enrolled in a private school, with 36 (100.0% in the age bracket) attending a public institution.
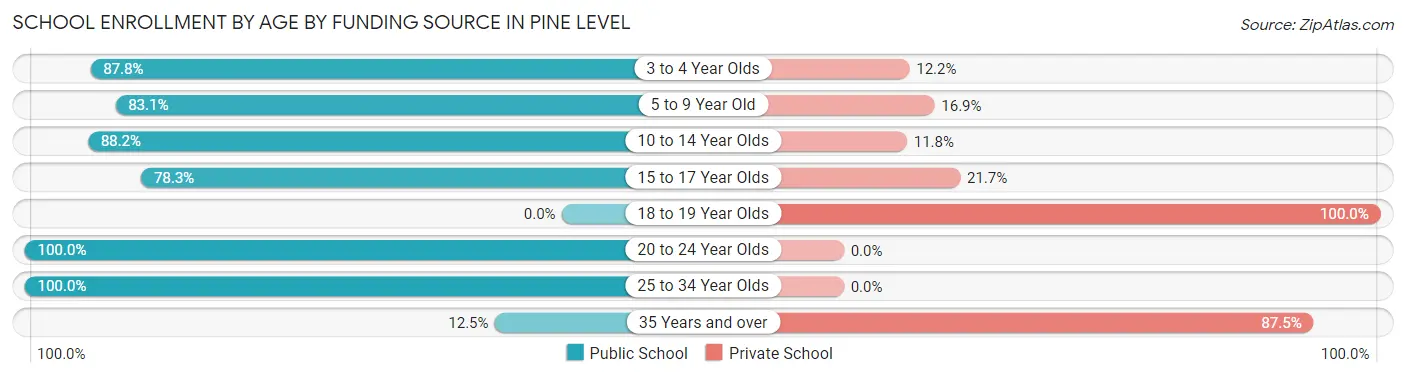
| Age Bracket | Public School | Private School |
| 3 to 4 Year Olds | 79 (87.8%) | 11 (12.2%) |
| 5 to 9 Year Old | 123 (83.1%) | 25 (16.9%) |
| 10 to 14 Year Olds | 210 (88.2%) | 28 (11.8%) |
| 15 to 17 Year Olds | 177 (78.3%) | 49 (21.7%) |
| 18 to 19 Year Olds | 0 (0.0%) | 19 (100.0%) |
| 20 to 24 Year Olds | 36 (100.0%) | 0 (0.0%) |
| 25 to 34 Year Olds | 40 (100.0%) | 0 (0.0%) |
| 35 Years and over | 10 (12.5%) | 70 (87.5%) |
| Total | 675 (77.0%) | 202 (23.0%) |
Educational Attainment by Field of Study in Pine Level
Business (315 | 49.4%), bio, nature & agricultural (108 | 17.0%), science & technology (93 | 14.6%), arts & humanities (43 | 6.8%), and education (41 | 6.4%) are the most common fields of study among 637 individuals in Pine Level who have obtained a bachelor's degree or higher.
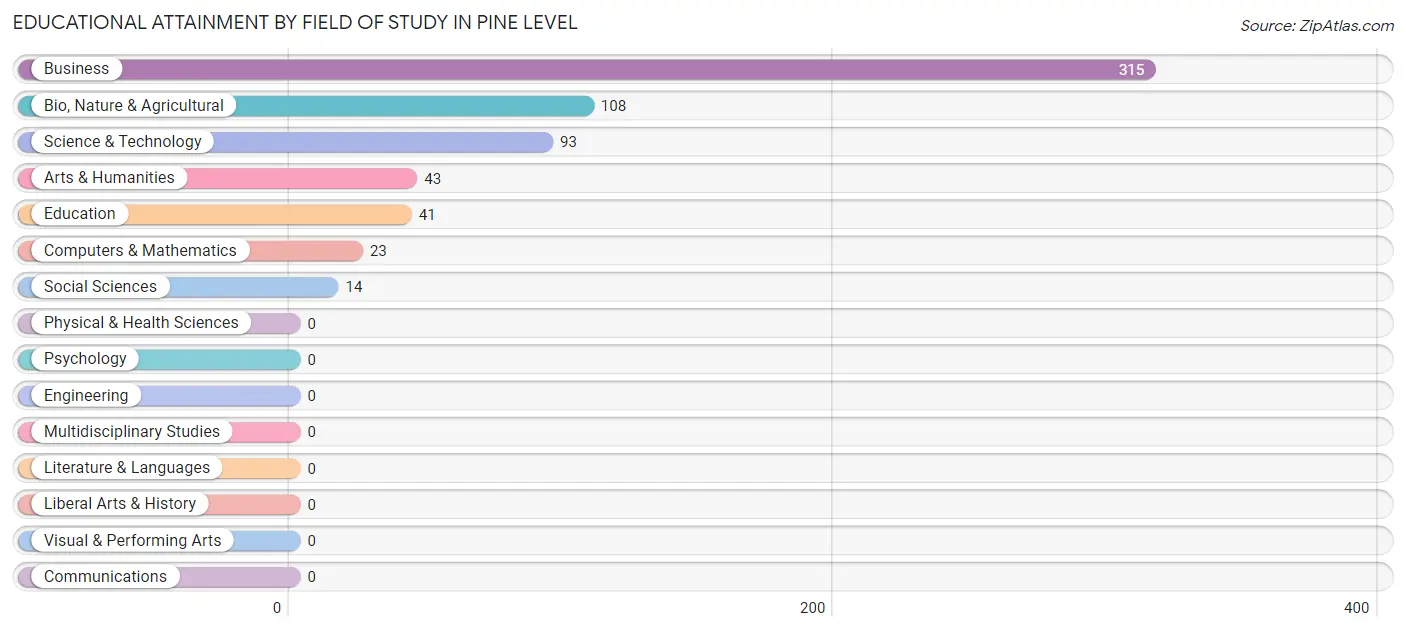
| Field of Study | # Graduates | % Graduates |
| Computers & Mathematics | 23 | 3.6% |
| Bio, Nature & Agricultural | 108 | 17.0% |
| Physical & Health Sciences | 0 | 0.0% |
| Psychology | 0 | 0.0% |
| Social Sciences | 14 | 2.2% |
| Engineering | 0 | 0.0% |
| Multidisciplinary Studies | 0 | 0.0% |
| Science & Technology | 93 | 14.6% |
| Business | 315 | 49.4% |
| Education | 41 | 6.4% |
| Literature & Languages | 0 | 0.0% |
| Liberal Arts & History | 0 | 0.0% |
| Visual & Performing Arts | 0 | 0.0% |
| Communications | 0 | 0.0% |
| Arts & Humanities | 43 | 6.8% |
| Total | 637 | 100.0% |
Transportation & Commute in Pine Level
Vehicle Availability by Sex in Pine Level
The most prevalent vehicle ownership categories in Pine Level are males with 3 vehicles (522, accounting for 53.6%) and females with 3 vehicles (464, making up 54.4%).
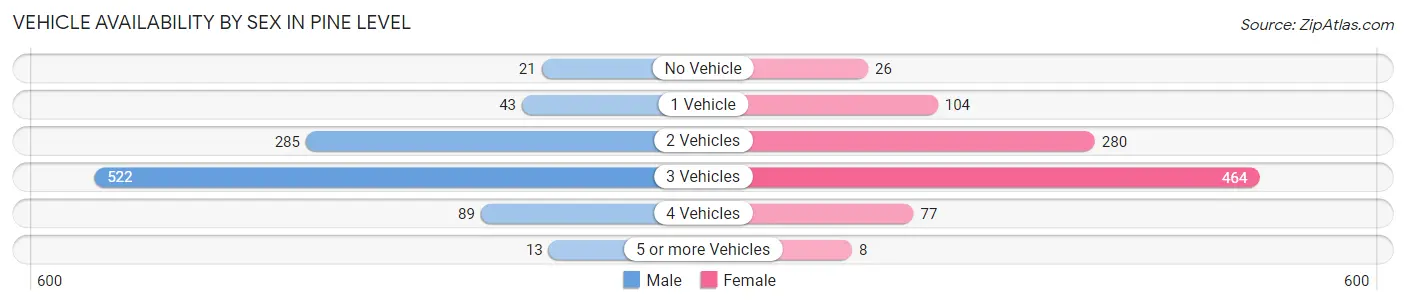
| Vehicles Available | Male | Female |
| No Vehicle | 21 (2.2%) | 26 (2.7%) |
| 1 Vehicle | 43 (4.4%) | 104 (10.8%) |
| 2 Vehicles | 285 (29.3%) | 280 (29.2%) |
| 3 Vehicles | 522 (53.6%) | 464 (48.4%) |
| 4 Vehicles | 89 (9.1%) | 77 (8.0%) |
| 5 or more Vehicles | 13 (1.3%) | 8 (0.8%) |
| Total | 973 (100.0%) | 959 (100.0%) |
Commute Time in Pine Level
The most frequently occuring commute durations in Pine Level are 30 to 34 minutes (561 commuters, 30.3%), 20 to 24 minutes (308 commuters, 16.6%), and 10 to 14 minutes (264 commuters, 14.2%).
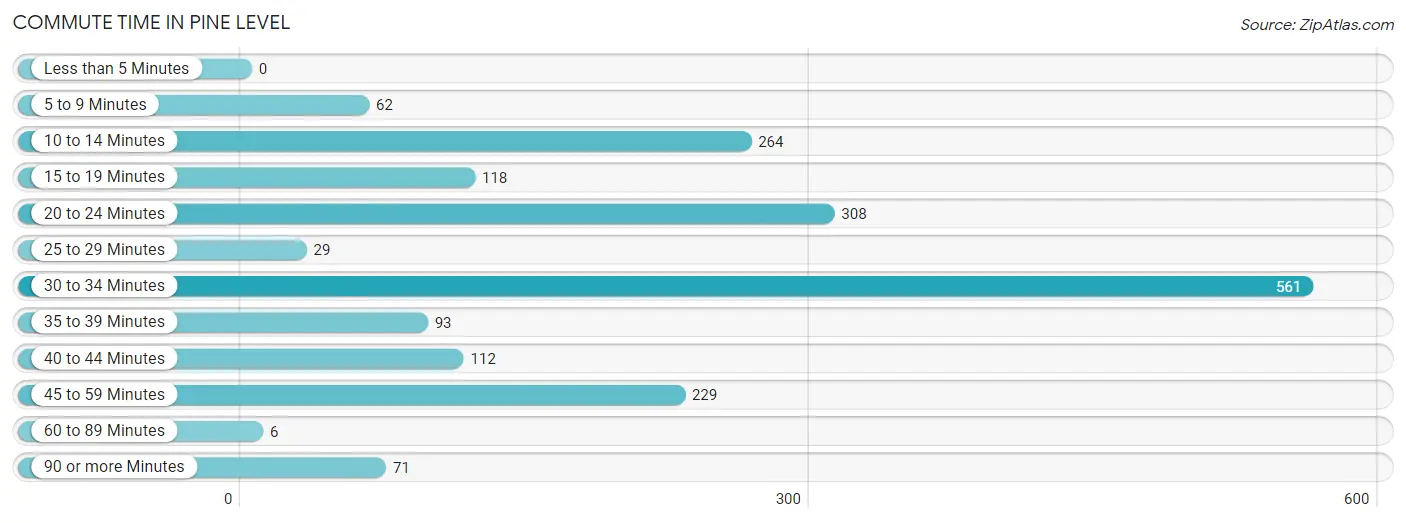
| Commute Time | # Commuters | % Commuters |
| Less than 5 Minutes | 0 | 0.0% |
| 5 to 9 Minutes | 62 | 3.4% |
| 10 to 14 Minutes | 264 | 14.2% |
| 15 to 19 Minutes | 118 | 6.4% |
| 20 to 24 Minutes | 308 | 16.6% |
| 25 to 29 Minutes | 29 | 1.6% |
| 30 to 34 Minutes | 561 | 30.3% |
| 35 to 39 Minutes | 93 | 5.0% |
| 40 to 44 Minutes | 112 | 6.0% |
| 45 to 59 Minutes | 229 | 12.4% |
| 60 to 89 Minutes | 6 | 0.3% |
| 90 or more Minutes | 71 | 3.8% |
Commute Time by Sex in Pine Level
The most common commute times in Pine Level are 30 to 34 minutes (265 commuters, 27.9%) for males and 30 to 34 minutes (296 commuters, 32.7%) for females.
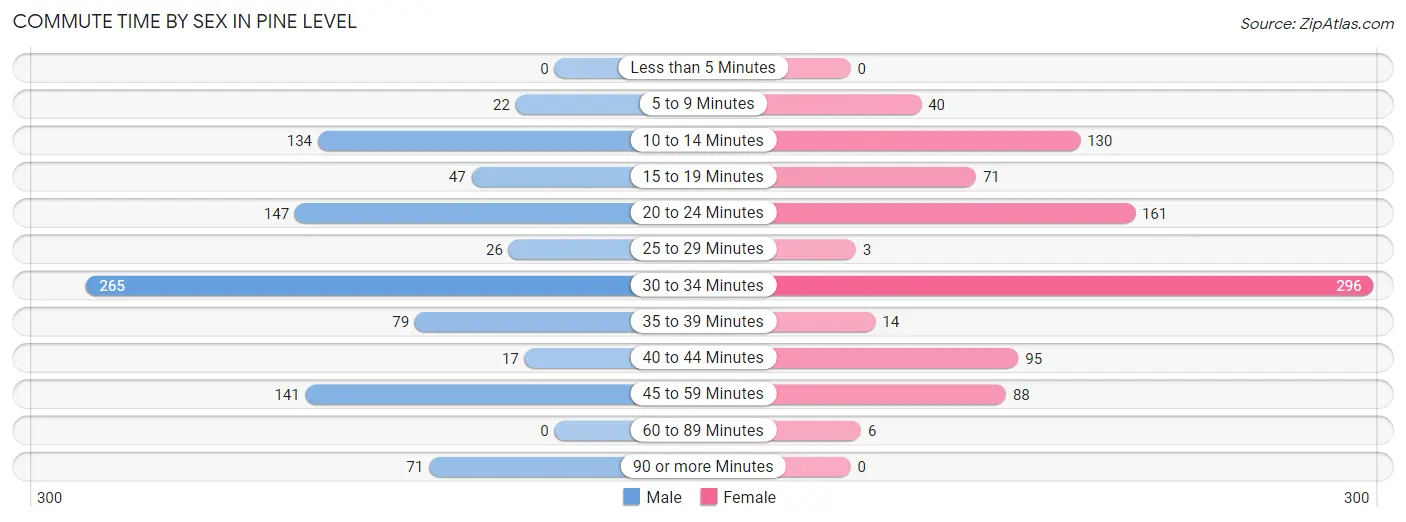
| Commute Time | Male | Female |
| Less than 5 Minutes | 0 (0.0%) | 0 (0.0%) |
| 5 to 9 Minutes | 22 (2.3%) | 40 (4.4%) |
| 10 to 14 Minutes | 134 (14.1%) | 130 (14.4%) |
| 15 to 19 Minutes | 47 (5.0%) | 71 (7.9%) |
| 20 to 24 Minutes | 147 (15.5%) | 161 (17.8%) |
| 25 to 29 Minutes | 26 (2.7%) | 3 (0.3%) |
| 30 to 34 Minutes | 265 (27.9%) | 296 (32.7%) |
| 35 to 39 Minutes | 79 (8.3%) | 14 (1.5%) |
| 40 to 44 Minutes | 17 (1.8%) | 95 (10.5%) |
| 45 to 59 Minutes | 141 (14.9%) | 88 (9.7%) |
| 60 to 89 Minutes | 0 (0.0%) | 6 (0.7%) |
| 90 or more Minutes | 71 (7.5%) | 0 (0.0%) |
Time of Departure to Work by Sex in Pine Level
The most frequent times of departure to work in Pine Level are 6:30 AM to 6:59 AM (161, 17.0%) for males and 7:00 AM to 7:29 AM (288, 31.9%) for females.
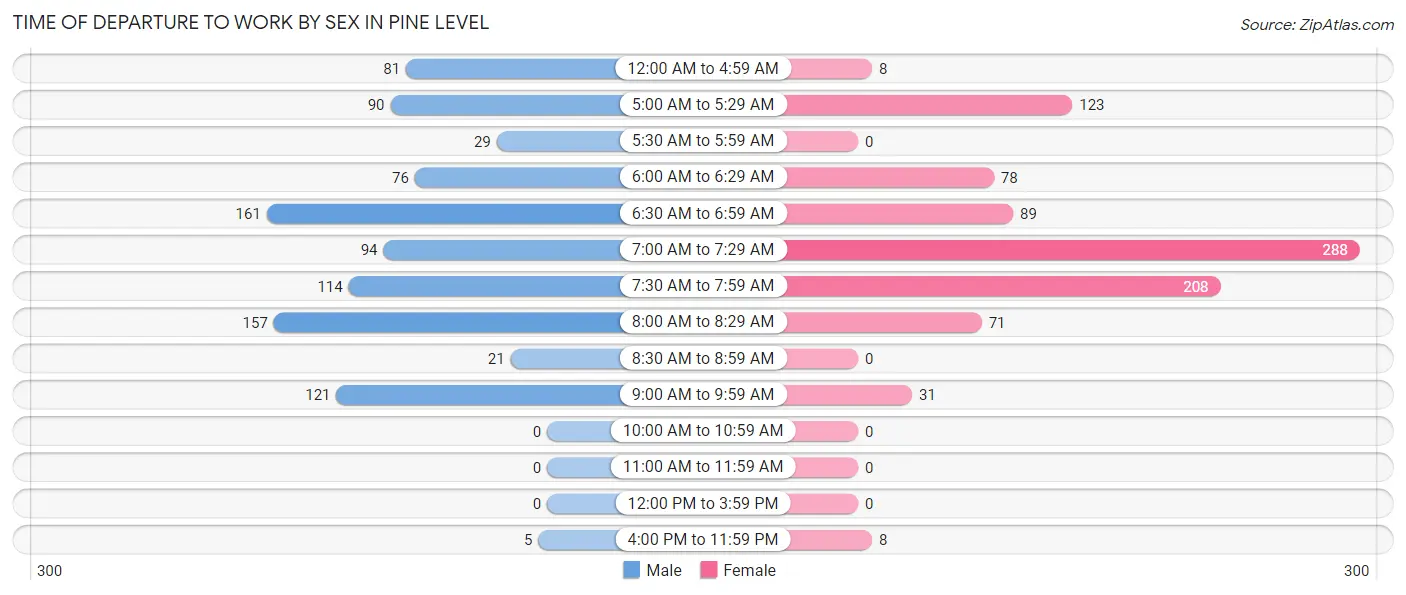
| Time of Departure | Male | Female |
| 12:00 AM to 4:59 AM | 81 (8.5%) | 8 (0.9%) |
| 5:00 AM to 5:29 AM | 90 (9.5%) | 123 (13.6%) |
| 5:30 AM to 5:59 AM | 29 (3.1%) | 0 (0.0%) |
| 6:00 AM to 6:29 AM | 76 (8.0%) | 78 (8.6%) |
| 6:30 AM to 6:59 AM | 161 (17.0%) | 89 (9.9%) |
| 7:00 AM to 7:29 AM | 94 (9.9%) | 288 (31.9%) |
| 7:30 AM to 7:59 AM | 114 (12.0%) | 208 (23.0%) |
| 8:00 AM to 8:29 AM | 157 (16.5%) | 71 (7.9%) |
| 8:30 AM to 8:59 AM | 21 (2.2%) | 0 (0.0%) |
| 9:00 AM to 9:59 AM | 121 (12.8%) | 31 (3.4%) |
| 10:00 AM to 10:59 AM | 0 (0.0%) | 0 (0.0%) |
| 11:00 AM to 11:59 AM | 0 (0.0%) | 0 (0.0%) |
| 12:00 PM to 3:59 PM | 0 (0.0%) | 0 (0.0%) |
| 4:00 PM to 11:59 PM | 5 (0.5%) | 8 (0.9%) |
| Total | 949 (100.0%) | 904 (100.0%) |
Housing Occupancy in Pine Level
Occupancy by Ownership in Pine Level
Of the total 1,405 dwellings in Pine Level, owner-occupied units account for 1,349 (96.0%), while renter-occupied units make up 56 (4.0%).
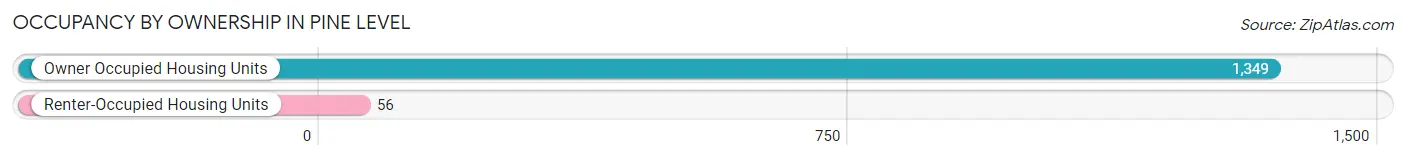
| Occupancy | # Housing Units | % Housing Units |
| Owner Occupied Housing Units | 1,349 | 96.0% |
| Renter-Occupied Housing Units | 56 | 4.0% |
| Total Occupied Housing Units | 1,405 | 100.0% |
Occupancy by Household Size in Pine Level
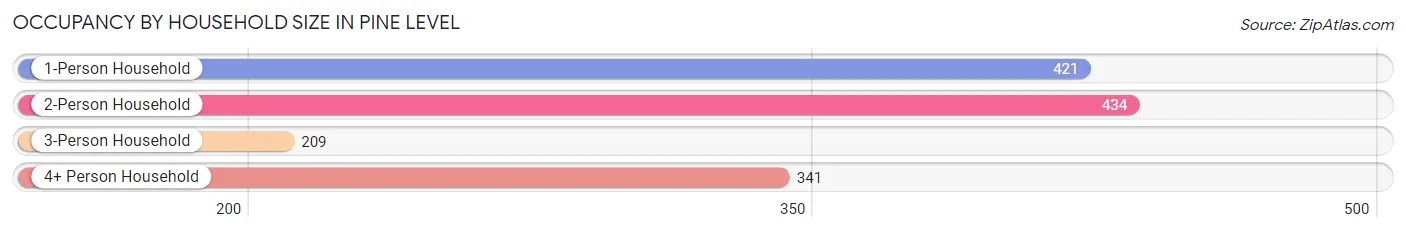
| Household Size | # Housing Units | % Housing Units |
| 1-Person Household | 421 | 30.0% |
| 2-Person Household | 434 | 30.9% |
| 3-Person Household | 209 | 14.9% |
| 4+ Person Household | 341 | 24.3% |
| Total Housing Units | 1,405 | 100.0% |
Occupancy by Ownership by Household Size in Pine Level
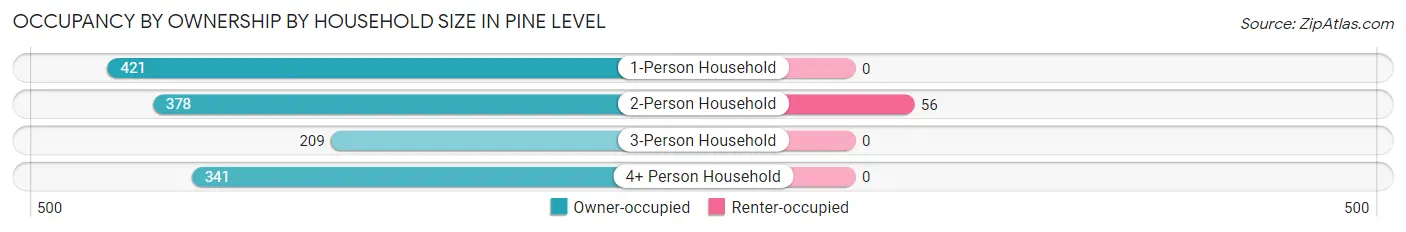
| Household Size | Owner-occupied | Renter-occupied |
| 1-Person Household | 421 (100.0%) | 0 (0.0%) |
| 2-Person Household | 378 (87.1%) | 56 (12.9%) |
| 3-Person Household | 209 (100.0%) | 0 (0.0%) |
| 4+ Person Household | 341 (100.0%) | 0 (0.0%) |
| Total Housing Units | 1,349 (96.0%) | 56 (4.0%) |
Occupancy by Educational Attainment in Pine Level
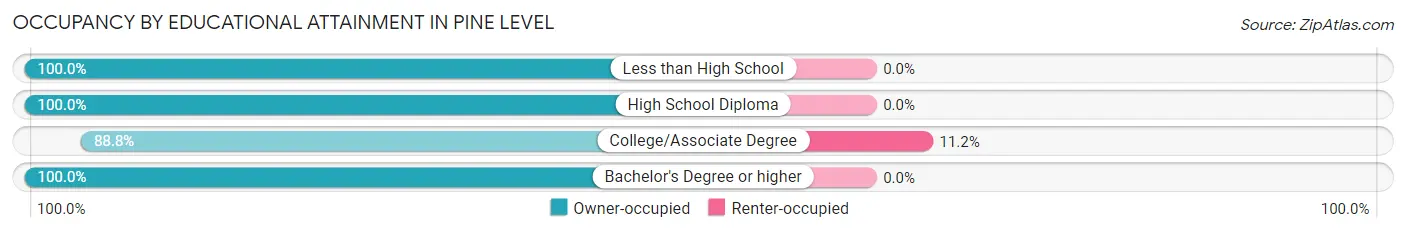
| Household Size | Owner-occupied | Renter-occupied |
| Less than High School | 54 (100.0%) | 0 (0.0%) |
| High School Diploma | 473 (100.0%) | 0 (0.0%) |
| College/Associate Degree | 445 (88.8%) | 56 (11.2%) |
| Bachelor's Degree or higher | 377 (100.0%) | 0 (0.0%) |
Occupancy by Age of Householder in Pine Level
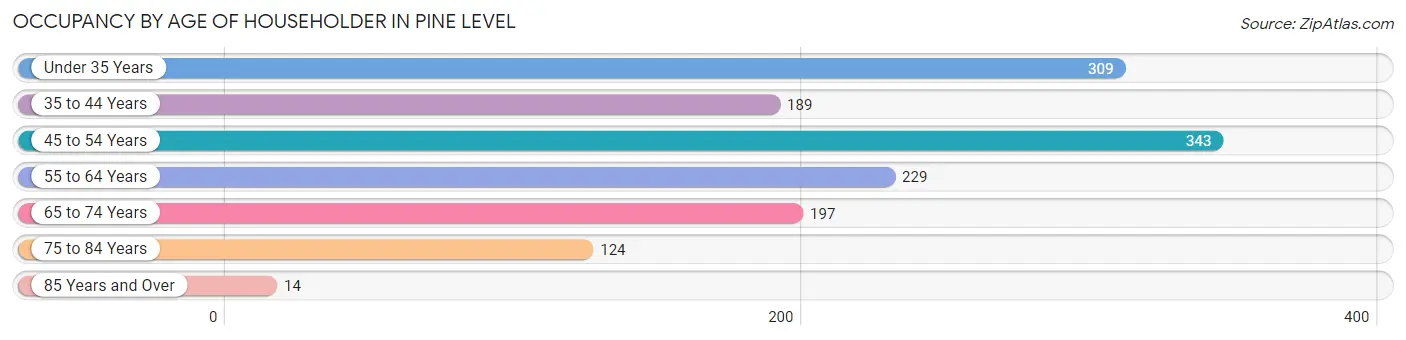
| Age Bracket | # Households | % Households |
| Under 35 Years | 309 | 22.0% |
| 35 to 44 Years | 189 | 13.5% |
| 45 to 54 Years | 343 | 24.4% |
| 55 to 64 Years | 229 | 16.3% |
| 65 to 74 Years | 197 | 14.0% |
| 75 to 84 Years | 124 | 8.8% |
| 85 Years and Over | 14 | 1.0% |
| Total | 1,405 | 100.0% |
Housing Finances in Pine Level
Median Income by Occupancy in Pine Level
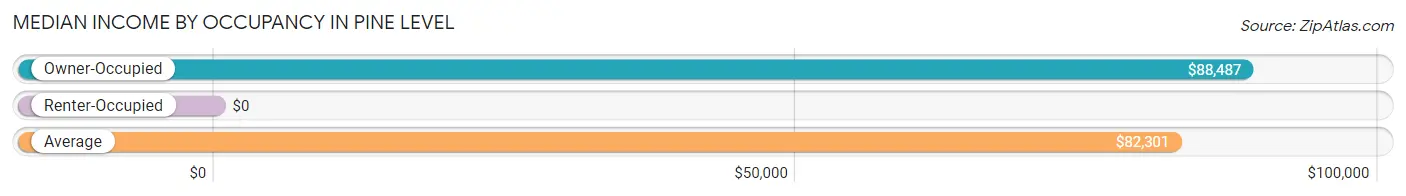
| Occupancy Type | # Households | Median Income |
| Owner-Occupied | 1,349 (96.0%) | $88,487 |
| Renter-Occupied | 56 (4.0%) | $0 |
| Average | 1,405 (100.0%) | $82,301 |
Occupancy by Householder Income Bracket in Pine Level
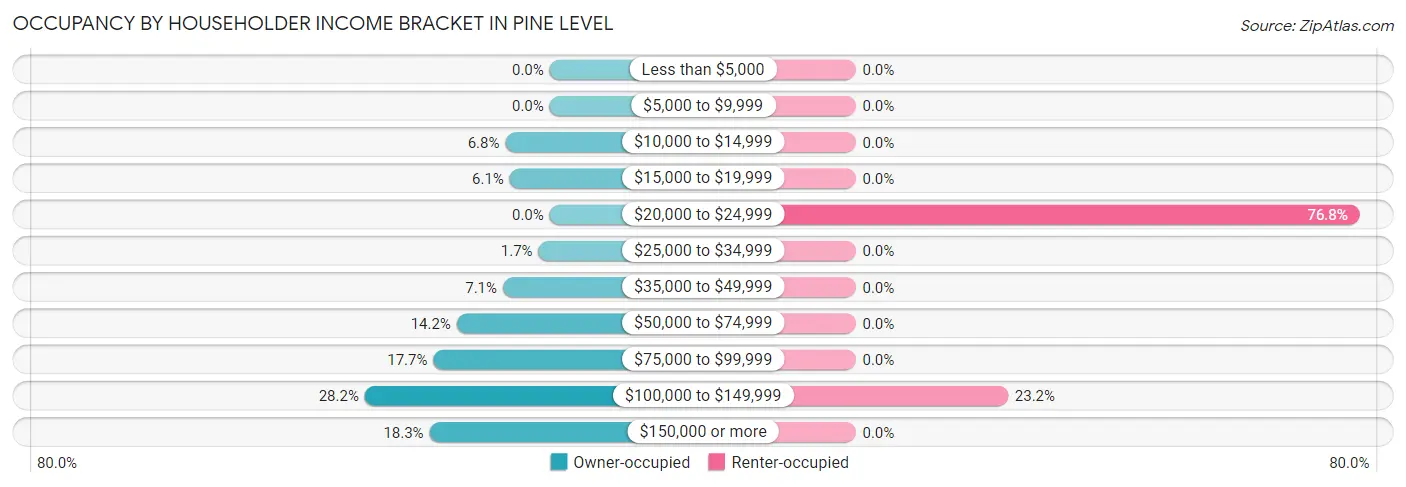
| Income Bracket | Owner-occupied | Renter-occupied |
| Less than $5,000 | 0 (0.0%) | 0 (0.0%) |
| $5,000 to $9,999 | 0 (0.0%) | 0 (0.0%) |
| $10,000 to $14,999 | 91 (6.8%) | 0 (0.0%) |
| $15,000 to $19,999 | 82 (6.1%) | 0 (0.0%) |
| $20,000 to $24,999 | 0 (0.0%) | 43 (76.8%) |
| $25,000 to $34,999 | 23 (1.7%) | 0 (0.0%) |
| $35,000 to $49,999 | 96 (7.1%) | 0 (0.0%) |
| $50,000 to $74,999 | 191 (14.2%) | 0 (0.0%) |
| $75,000 to $99,999 | 239 (17.7%) | 0 (0.0%) |
| $100,000 to $149,999 | 380 (28.2%) | 13 (23.2%) |
| $150,000 or more | 247 (18.3%) | 0 (0.0%) |
| Total | 1,349 (100.0%) | 56 (100.0%) |
Monthly Housing Cost Tiers in Pine Level
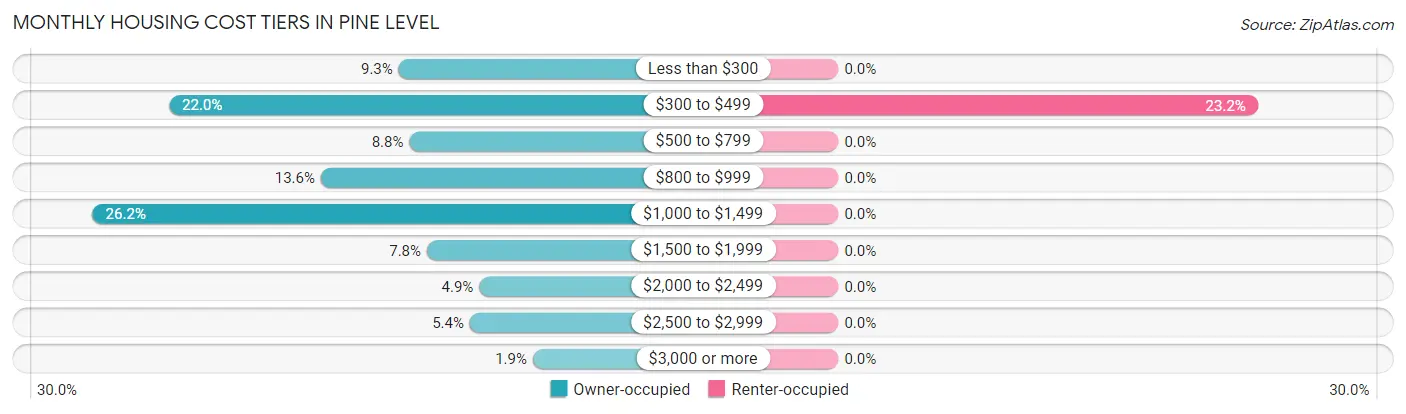
| Monthly Cost | Owner-occupied | Renter-occupied |
| Less than $300 | 126 (9.3%) | 0 (0.0%) |
| $300 to $499 | 297 (22.0%) | 13 (23.2%) |
| $500 to $799 | 118 (8.7%) | 0 (0.0%) |
| $800 to $999 | 184 (13.6%) | 0 (0.0%) |
| $1,000 to $1,499 | 354 (26.2%) | 0 (0.0%) |
| $1,500 to $1,999 | 105 (7.8%) | 0 (0.0%) |
| $2,000 to $2,499 | 66 (4.9%) | 0 (0.0%) |
| $2,500 to $2,999 | 73 (5.4%) | 0 (0.0%) |
| $3,000 or more | 26 (1.9%) | 0 (0.0%) |
| Total | 1,349 (100.0%) | 56 (100.0%) |
Physical Housing Characteristics in Pine Level
Housing Structures in Pine Level
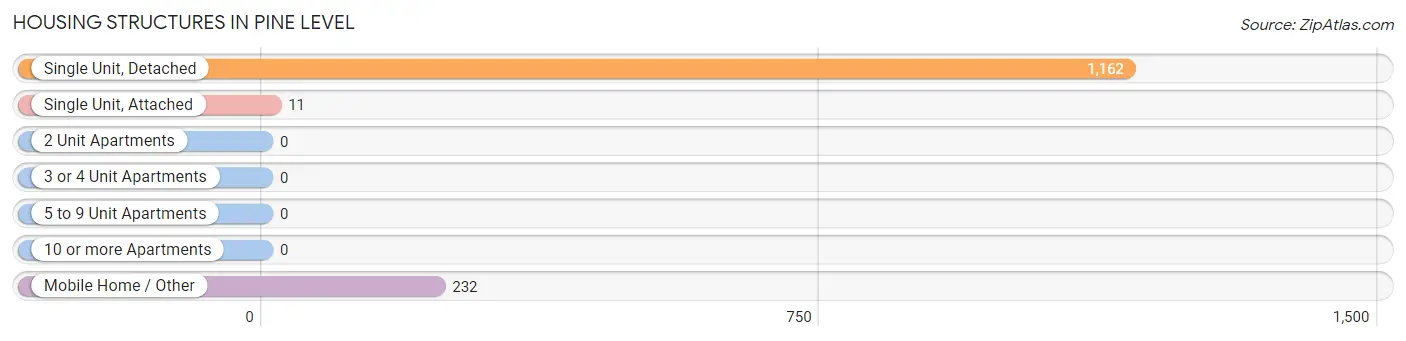
| Structure Type | # Housing Units | % Housing Units |
| Single Unit, Detached | 1,162 | 82.7% |
| Single Unit, Attached | 11 | 0.8% |
| 2 Unit Apartments | 0 | 0.0% |
| 3 or 4 Unit Apartments | 0 | 0.0% |
| 5 to 9 Unit Apartments | 0 | 0.0% |
| 10 or more Apartments | 0 | 0.0% |
| Mobile Home / Other | 232 | 16.5% |
| Total | 1,405 | 100.0% |
Housing Structures by Occupancy in Pine Level
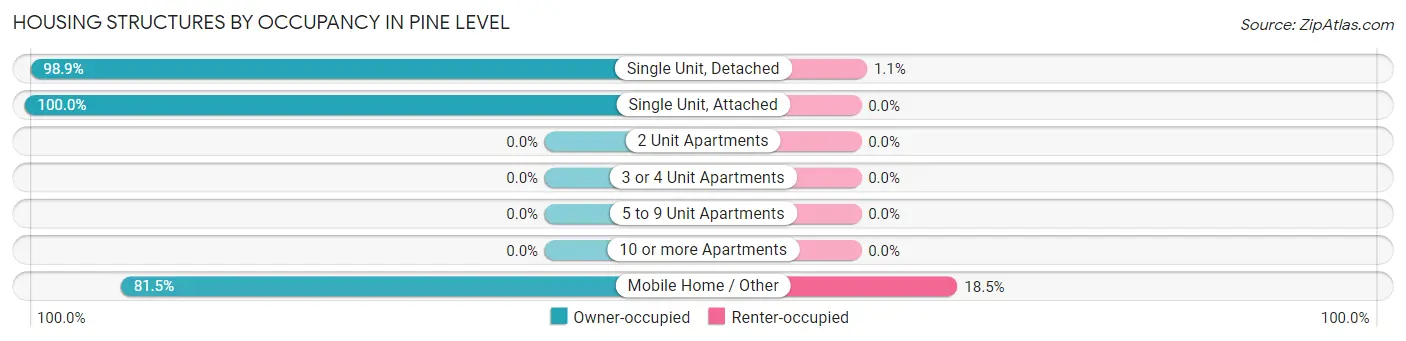
| Structure Type | Owner-occupied | Renter-occupied |
| Single Unit, Detached | 1,149 (98.9%) | 13 (1.1%) |
| Single Unit, Attached | 11 (100.0%) | 0 (0.0%) |
| 2 Unit Apartments | 0 (0.0%) | 0 (0.0%) |
| 3 or 4 Unit Apartments | 0 (0.0%) | 0 (0.0%) |
| 5 to 9 Unit Apartments | 0 (0.0%) | 0 (0.0%) |
| 10 or more Apartments | 0 (0.0%) | 0 (0.0%) |
| Mobile Home / Other | 189 (81.5%) | 43 (18.5%) |
| Total | 1,349 (96.0%) | 56 (4.0%) |
Housing Structures by Number of Rooms in Pine Level
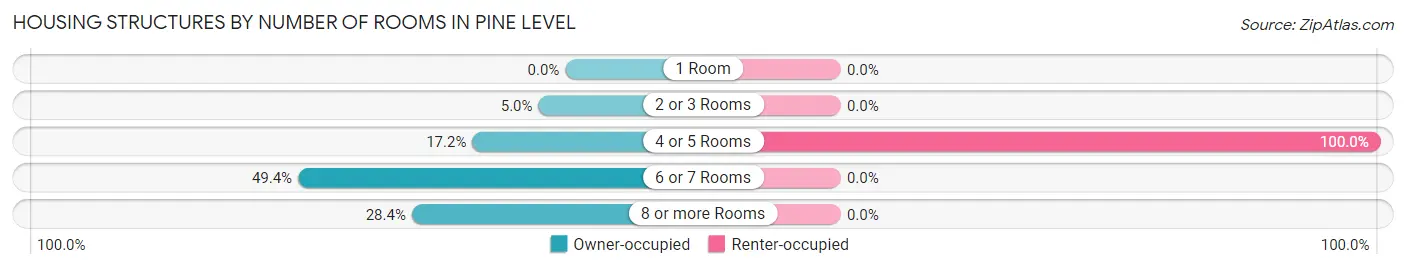
| Number of Rooms | Owner-occupied | Renter-occupied |
| 1 Room | 0 (0.0%) | 0 (0.0%) |
| 2 or 3 Rooms | 67 (5.0%) | 0 (0.0%) |
| 4 or 5 Rooms | 232 (17.2%) | 56 (100.0%) |
| 6 or 7 Rooms | 667 (49.4%) | 0 (0.0%) |
| 8 or more Rooms | 383 (28.4%) | 0 (0.0%) |
| Total | 1,349 (100.0%) | 56 (100.0%) |
Housing Structure by Heating Type in Pine Level
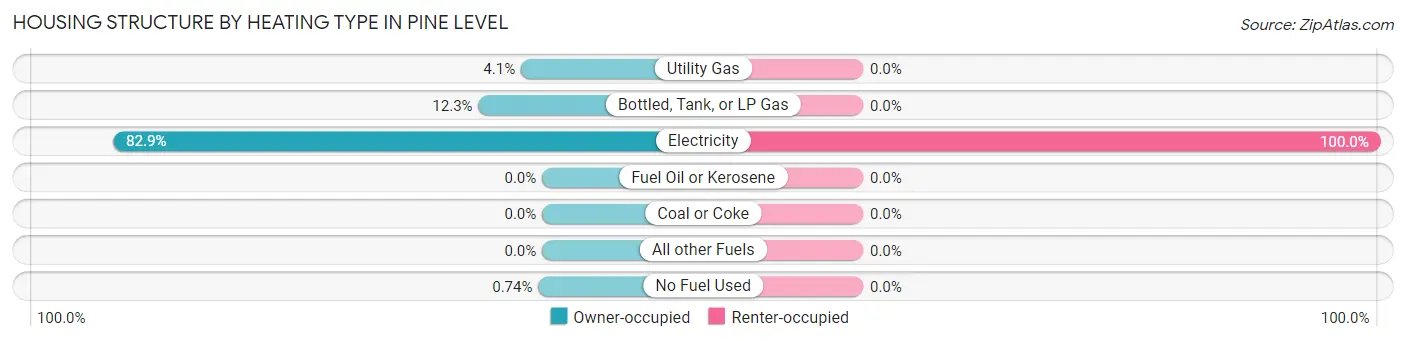
| Heating Type | Owner-occupied | Renter-occupied |
| Utility Gas | 55 (4.1%) | 0 (0.0%) |
| Bottled, Tank, or LP Gas | 166 (12.3%) | 0 (0.0%) |
| Electricity | 1,118 (82.9%) | 56 (100.0%) |
| Fuel Oil or Kerosene | 0 (0.0%) | 0 (0.0%) |
| Coal or Coke | 0 (0.0%) | 0 (0.0%) |
| All other Fuels | 0 (0.0%) | 0 (0.0%) |
| No Fuel Used | 10 (0.7%) | 0 (0.0%) |
| Total | 1,349 (100.0%) | 56 (100.0%) |
Household Vehicle Usage in Pine Level
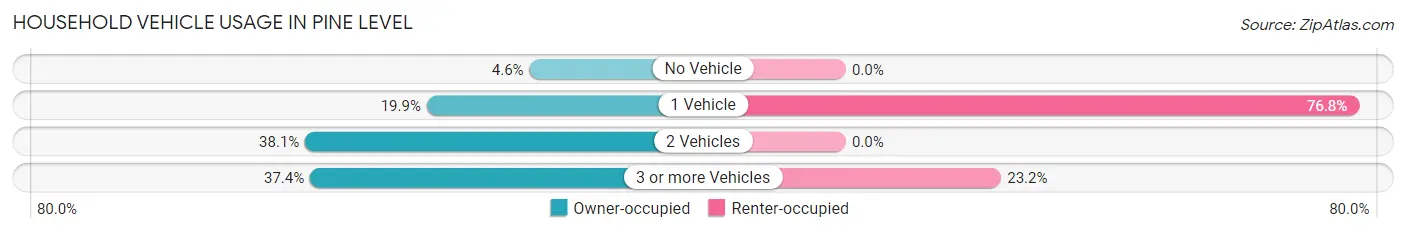
| Vehicles per Household | Owner-occupied | Renter-occupied |
| No Vehicle | 62 (4.6%) | 0 (0.0%) |
| 1 Vehicle | 269 (19.9%) | 43 (76.8%) |
| 2 Vehicles | 514 (38.1%) | 0 (0.0%) |
| 3 or more Vehicles | 504 (37.4%) | 13 (23.2%) |
| Total | 1,349 (100.0%) | 56 (100.0%) |
Real Estate & Mortgages in Pine Level
Real Estate and Mortgage Overview in Pine Level
| Characteristic | Without Mortgage | With Mortgage |
| Housing Units | 594 | 755 |
| Median Property Value | $200,600 | $207,200 |
| Median Household Income | $58,750 | $203 |
| Monthly Housing Costs | $415 | $26 |
| Real Estate Taxes | $453 | $36 |
Property Value by Mortgage Status in Pine Level
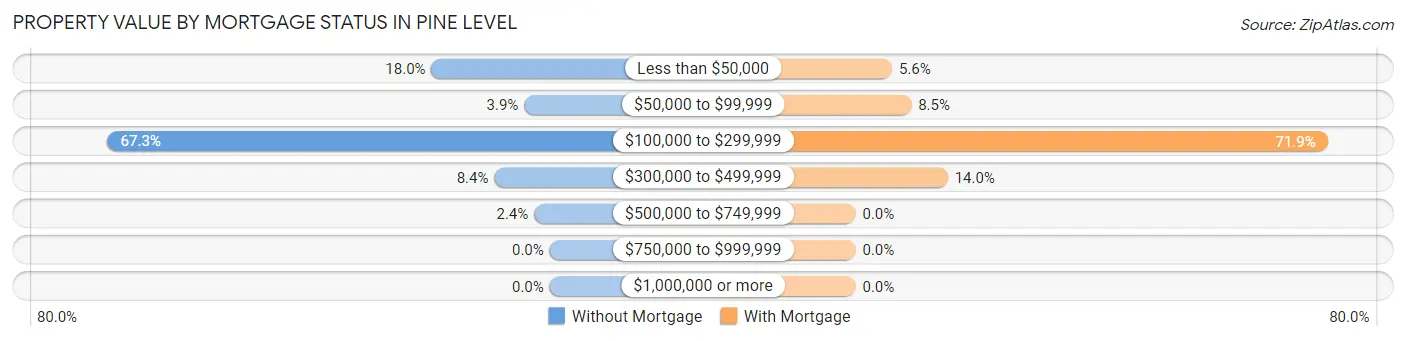
| Property Value | Without Mortgage | With Mortgage |
| Less than $50,000 | 107 (18.0%) | 42 (5.6%) |
| $50,000 to $99,999 | 23 (3.9%) | 64 (8.5%) |
| $100,000 to $299,999 | 400 (67.3%) | 543 (71.9%) |
| $300,000 to $499,999 | 50 (8.4%) | 106 (14.0%) |
| $500,000 to $749,999 | 14 (2.4%) | 0 (0.0%) |
| $750,000 to $999,999 | 0 (0.0%) | 0 (0.0%) |
| $1,000,000 or more | 0 (0.0%) | 0 (0.0%) |
| Total | 594 (100.0%) | 755 (100.0%) |
Household Income by Mortgage Status in Pine Level
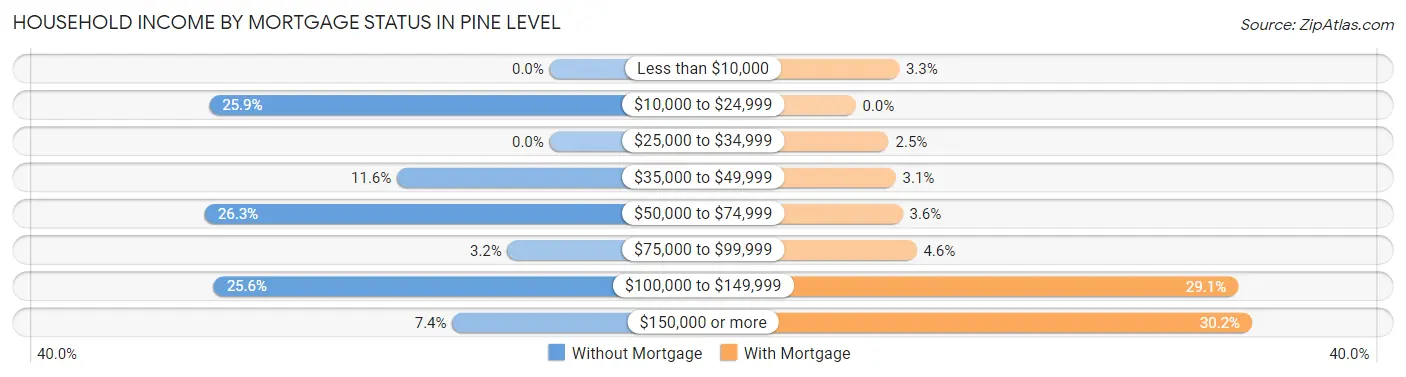
| Household Income | Without Mortgage | With Mortgage |
| Less than $10,000 | 0 (0.0%) | 25 (3.3%) |
| $10,000 to $24,999 | 154 (25.9%) | 0 (0.0%) |
| $25,000 to $34,999 | 0 (0.0%) | 19 (2.5%) |
| $35,000 to $49,999 | 69 (11.6%) | 23 (3.0%) |
| $50,000 to $74,999 | 156 (26.3%) | 27 (3.6%) |
| $75,000 to $99,999 | 19 (3.2%) | 35 (4.6%) |
| $100,000 to $149,999 | 152 (25.6%) | 220 (29.1%) |
| $150,000 or more | 44 (7.4%) | 228 (30.2%) |
| Total | 594 (100.0%) | 755 (100.0%) |
Property Value to Household Income Ratio in Pine Level
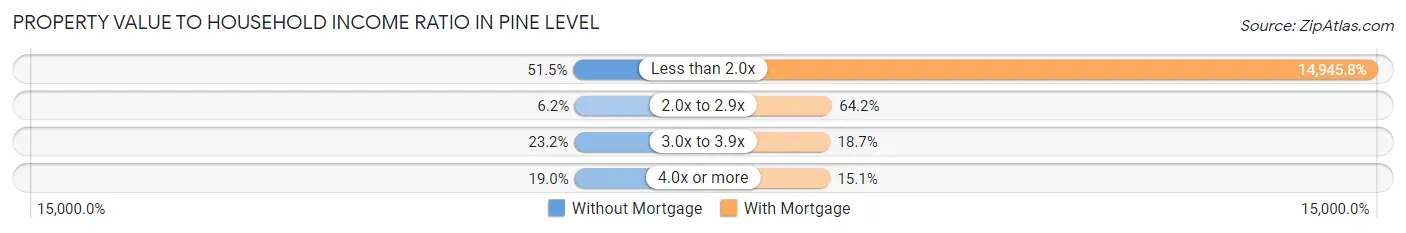
| Value-to-Income Ratio | Without Mortgage | With Mortgage |
| Less than 2.0x | 306 (51.5%) | 112,841 (14,945.8%) |
| 2.0x to 2.9x | 37 (6.2%) | 485 (64.2%) |
| 3.0x to 3.9x | 138 (23.2%) | 141 (18.7%) |
| 4.0x or more | 113 (19.0%) | 114 (15.1%) |
| Total | 594 (100.0%) | 755 (100.0%) |
Real Estate Taxes by Mortgage Status in Pine Level
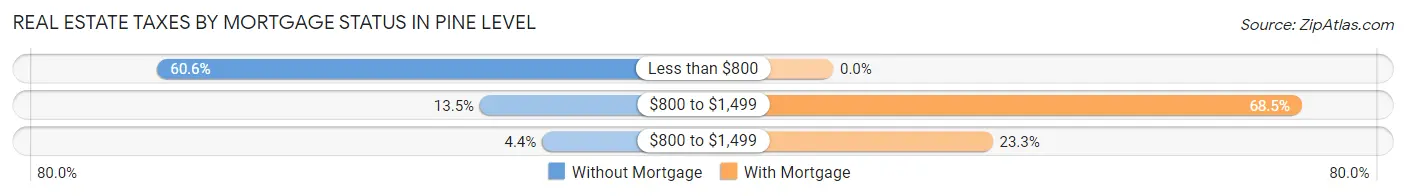
| Property Taxes | Without Mortgage | With Mortgage |
| Less than $800 | 360 (60.6%) | 0 (0.0%) |
| $800 to $1,499 | 80 (13.5%) | 517 (68.5%) |
| $800 to $1,499 | 26 (4.4%) | 176 (23.3%) |
| Total | 594 (100.0%) | 755 (100.0%) |
Health & Disability in Pine Level
Health Insurance Coverage by Age in Pine Level
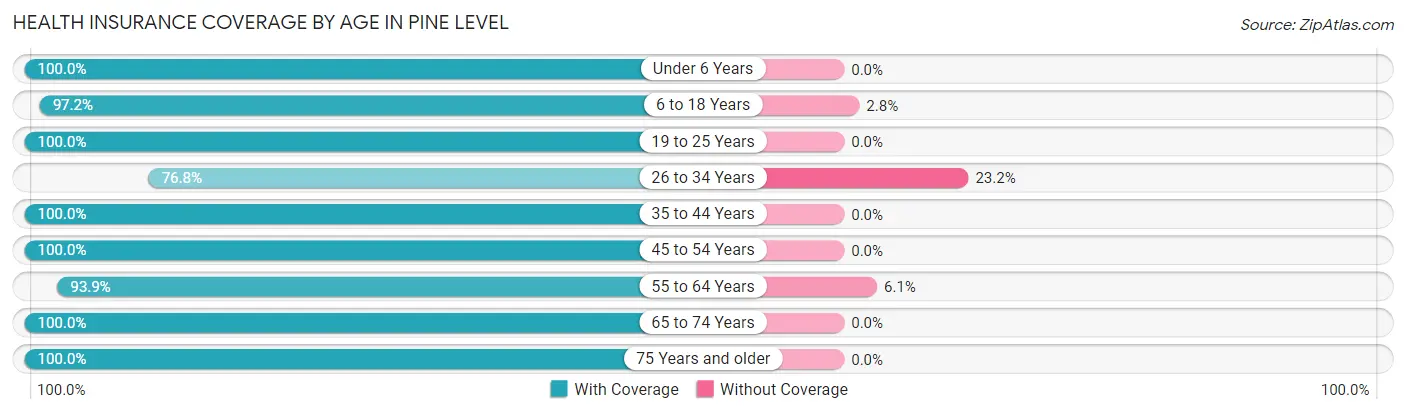
| Age Bracket | With Coverage | Without Coverage |
| Under 6 Years | 447 (100.0%) | 0 (0.0%) |
| 6 to 18 Years | 551 (97.2%) | 16 (2.8%) |
| 19 to 25 Years | 306 (100.0%) | 0 (0.0%) |
| 26 to 34 Years | 365 (76.8%) | 110 (23.2%) |
| 35 to 44 Years | 392 (100.0%) | 0 (0.0%) |
| 45 to 54 Years | 723 (100.0%) | 0 (0.0%) |
| 55 to 64 Years | 460 (93.9%) | 30 (6.1%) |
| 65 to 74 Years | 248 (100.0%) | 0 (0.0%) |
| 75 Years and older | 220 (100.0%) | 0 (0.0%) |
| Total | 3,712 (96.0%) | 156 (4.0%) |
Health Insurance Coverage by Citizenship Status in Pine Level
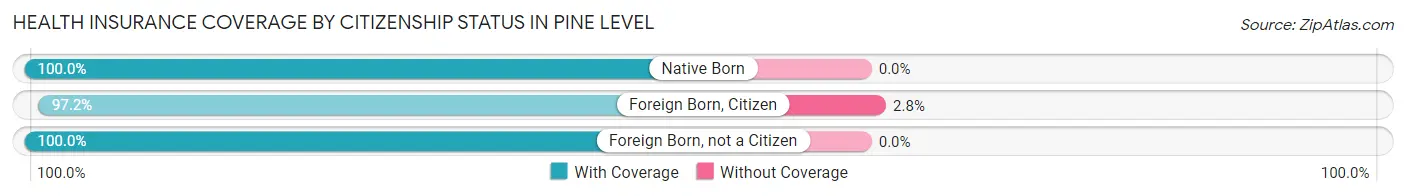
| Citizenship Status | With Coverage | Without Coverage |
| Native Born | 447 (100.0%) | 0 (0.0%) |
| Foreign Born, Citizen | 551 (97.2%) | 16 (2.8%) |
| Foreign Born, not a Citizen | 306 (100.0%) | 0 (0.0%) |
Health Insurance Coverage by Household Income in Pine Level
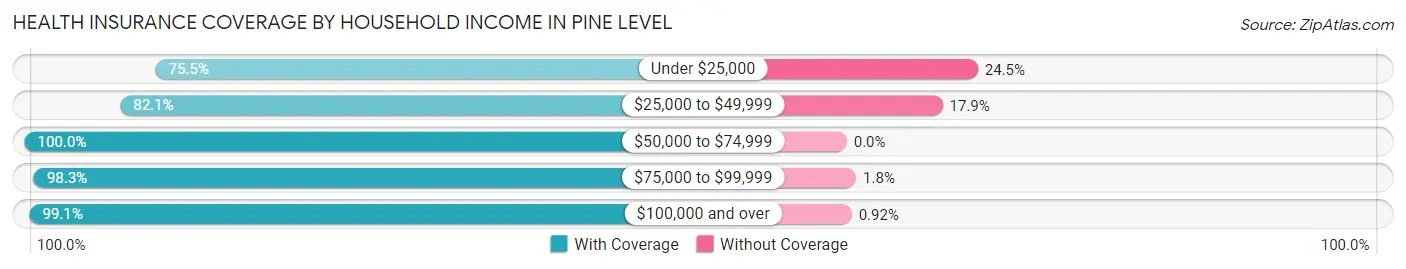
| Household Income | With Coverage | Without Coverage |
| Under $25,000 | 206 (75.5%) | 67 (24.5%) |
| $25,000 to $49,999 | 247 (82.1%) | 54 (17.9%) |
| $50,000 to $74,999 | 472 (100.0%) | 0 (0.0%) |
| $75,000 to $99,999 | 1,065 (98.3%) | 19 (1.8%) |
| $100,000 and over | 1,722 (99.1%) | 16 (0.9%) |
Public vs Private Health Insurance Coverage by Age in Pine Level
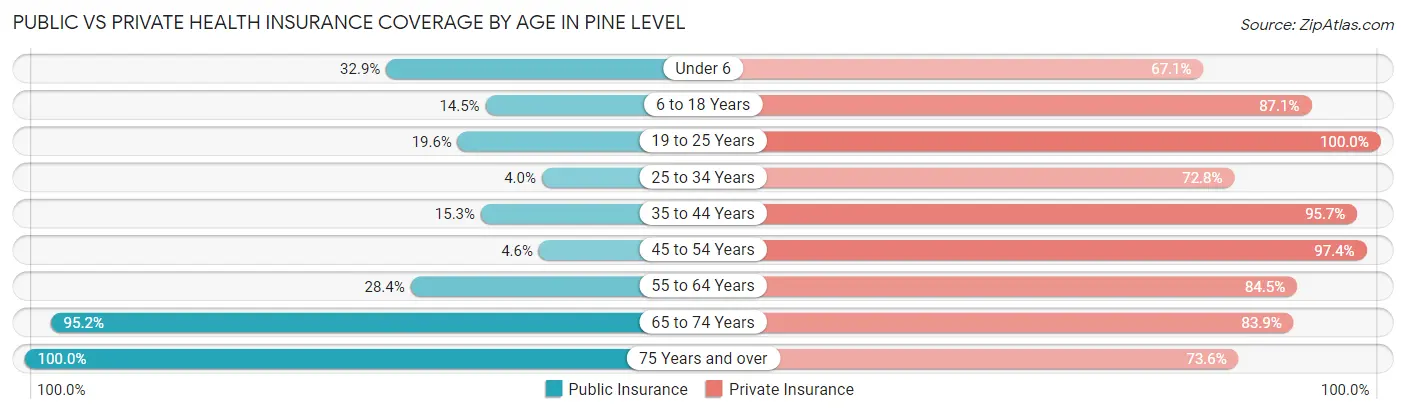
| Age Bracket | Public Insurance | Private Insurance |
| Under 6 | 147 (32.9%) | 300 (67.1%) |
| 6 to 18 Years | 82 (14.5%) | 494 (87.1%) |
| 19 to 25 Years | 60 (19.6%) | 306 (100.0%) |
| 25 to 34 Years | 19 (4.0%) | 346 (72.8%) |
| 35 to 44 Years | 60 (15.3%) | 375 (95.7%) |
| 45 to 54 Years | 33 (4.6%) | 704 (97.4%) |
| 55 to 64 Years | 139 (28.4%) | 414 (84.5%) |
| 65 to 74 Years | 236 (95.2%) | 208 (83.9%) |
| 75 Years and over | 220 (100.0%) | 162 (73.6%) |
| Total | 996 (25.8%) | 3,309 (85.6%) |
Disability Status by Sex by Age in Pine Level
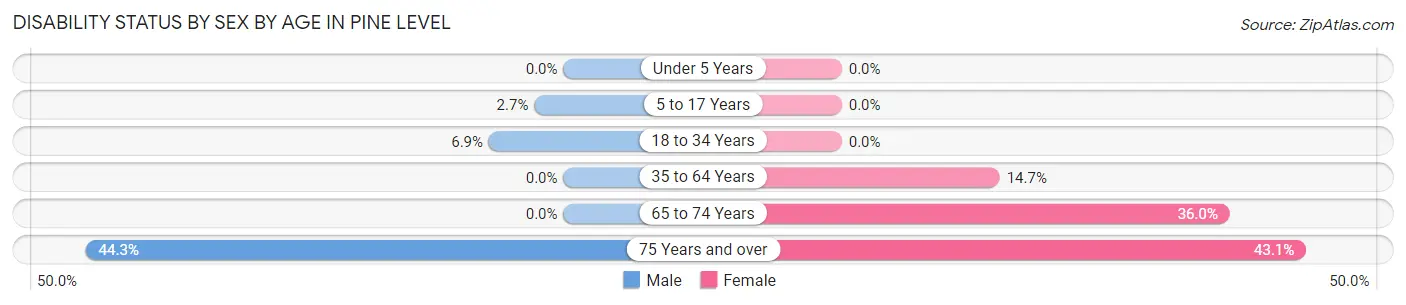
| Age Bracket | Male | Female |
| Under 5 Years | 0 (0.0%) | 0 (0.0%) |
| 5 to 17 Years | 9 (2.7%) | 0 (0.0%) |
| 18 to 34 Years | 25 (6.9%) | 0 (0.0%) |
| 35 to 64 Years | 0 (0.0%) | 129 (14.7%) |
| 65 to 74 Years | 0 (0.0%) | 45 (36.0%) |
| 75 Years and over | 43 (44.3%) | 53 (43.1%) |
Disability Class by Sex by Age in Pine Level
Disability Class: Hearing Difficulty
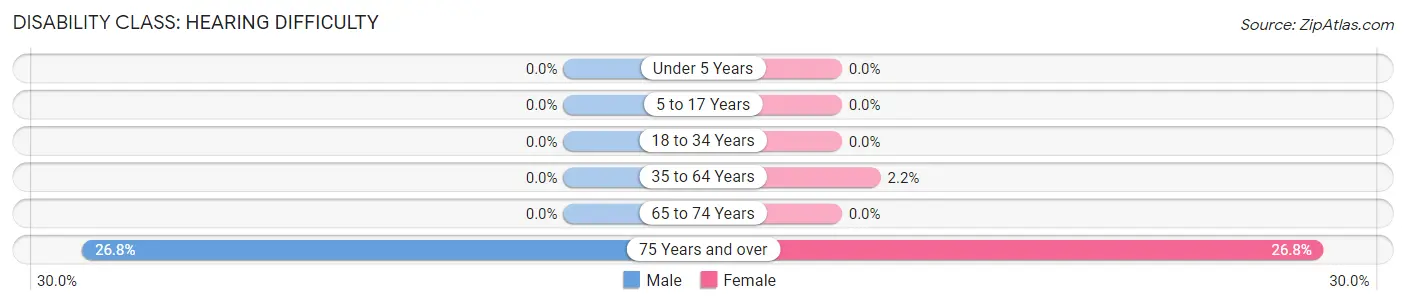
| Age Bracket | Male | Female |
| Under 5 Years | 0 (0.0%) | 0 (0.0%) |
| 5 to 17 Years | 0 (0.0%) | 0 (0.0%) |
| 18 to 34 Years | 0 (0.0%) | 0 (0.0%) |
| 35 to 64 Years | 0 (0.0%) | 19 (2.2%) |
| 65 to 74 Years | 0 (0.0%) | 0 (0.0%) |
| 75 Years and over | 26 (26.8%) | 33 (26.8%) |
Disability Class: Vision Difficulty
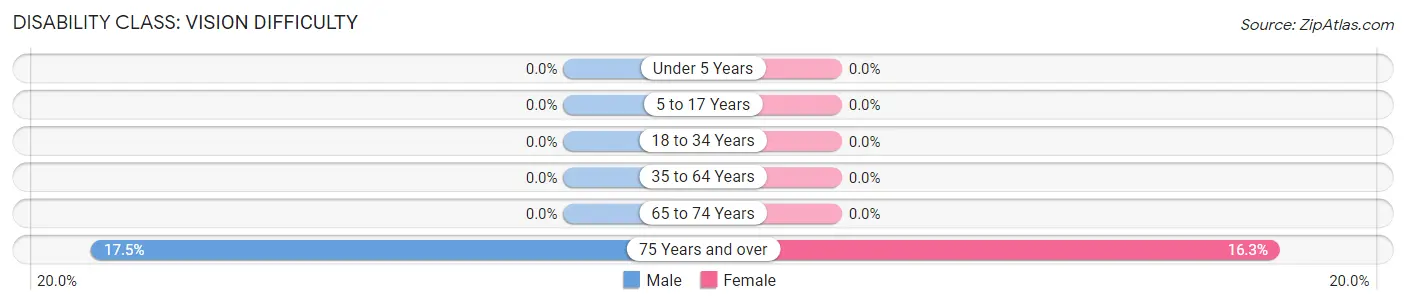
| Age Bracket | Male | Female |
| Under 5 Years | 0 (0.0%) | 0 (0.0%) |
| 5 to 17 Years | 0 (0.0%) | 0 (0.0%) |
| 18 to 34 Years | 0 (0.0%) | 0 (0.0%) |
| 35 to 64 Years | 0 (0.0%) | 0 (0.0%) |
| 65 to 74 Years | 0 (0.0%) | 0 (0.0%) |
| 75 Years and over | 17 (17.5%) | 20 (16.3%) |
Disability Class: Cognitive Difficulty
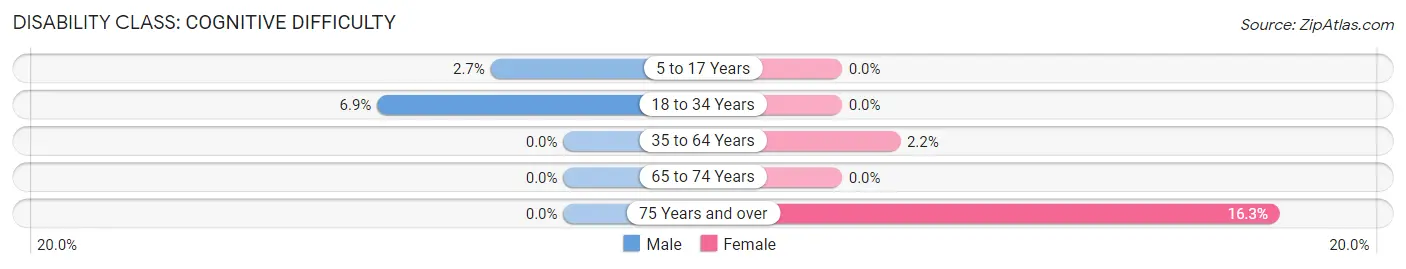
| Age Bracket | Male | Female |
| 5 to 17 Years | 9 (2.7%) | 0 (0.0%) |
| 18 to 34 Years | 25 (6.9%) | 0 (0.0%) |
| 35 to 64 Years | 0 (0.0%) | 19 (2.2%) |
| 65 to 74 Years | 0 (0.0%) | 0 (0.0%) |
| 75 Years and over | 0 (0.0%) | 20 (16.3%) |
Disability Class: Ambulatory Difficulty
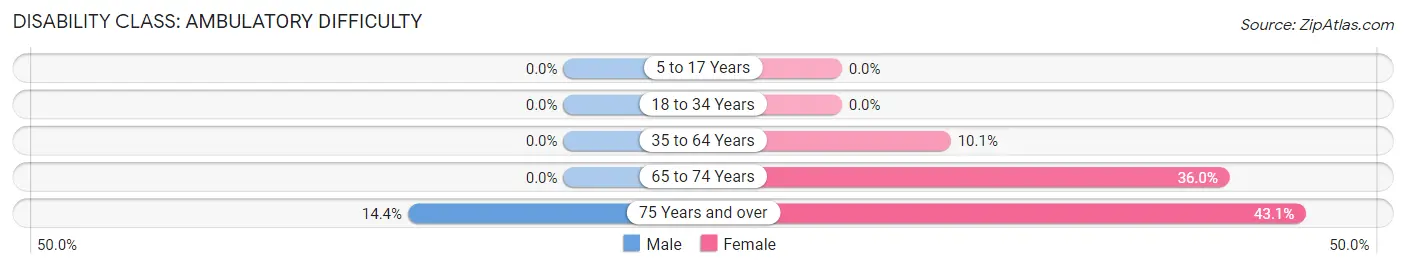
| Age Bracket | Male | Female |
| 5 to 17 Years | 0 (0.0%) | 0 (0.0%) |
| 18 to 34 Years | 0 (0.0%) | 0 (0.0%) |
| 35 to 64 Years | 0 (0.0%) | 89 (10.1%) |
| 65 to 74 Years | 0 (0.0%) | 45 (36.0%) |
| 75 Years and over | 14 (14.4%) | 53 (43.1%) |
Disability Class: Self-Care Difficulty
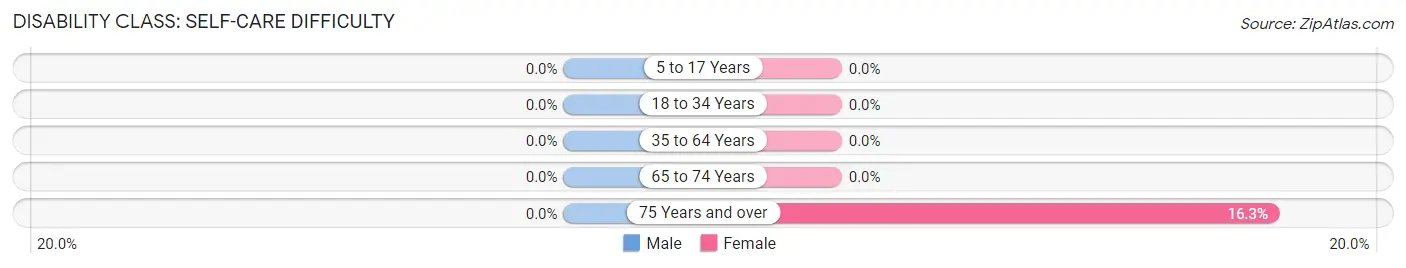
| Age Bracket | Male | Female |
| 5 to 17 Years | 0 (0.0%) | 0 (0.0%) |
| 18 to 34 Years | 0 (0.0%) | 0 (0.0%) |
| 35 to 64 Years | 0 (0.0%) | 0 (0.0%) |
| 65 to 74 Years | 0 (0.0%) | 0 (0.0%) |
| 75 Years and over | 0 (0.0%) | 20 (16.3%) |
Technology Access in Pine Level
Computing Device Access in Pine Level
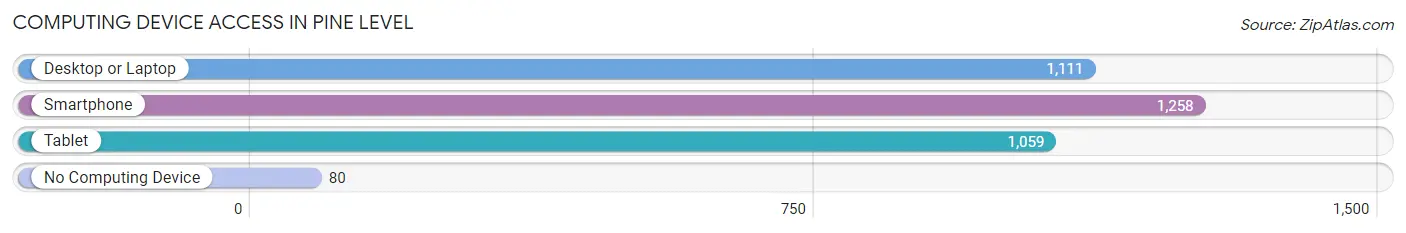
| Device Type | # Households | % Households |
| Desktop or Laptop | 1,111 | 79.1% |
| Smartphone | 1,258 | 89.5% |
| Tablet | 1,059 | 75.4% |
| No Computing Device | 80 | 5.7% |
| Total | 1,405 | 100.0% |
Internet Access in Pine Level
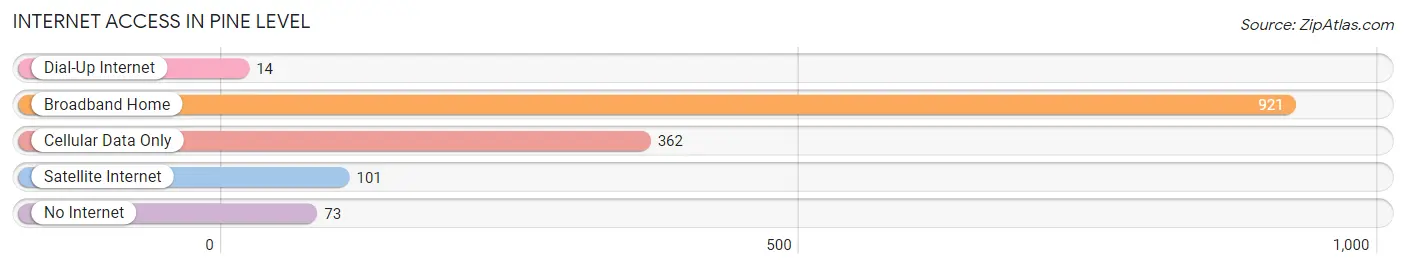
| Internet Type | # Households | % Households |
| Dial-Up Internet | 14 | 1.0% |
| Broadband Home | 921 | 65.5% |
| Cellular Data Only | 362 | 25.8% |
| Satellite Internet | 101 | 7.2% |
| No Internet | 73 | 5.2% |
| Total | 1,405 | 100.0% |
Pine Level Summary
Pine Level is a small town located in Autauga County, Alabama. It is situated about 20 miles south of Montgomery, the state capital. The town has a population of approximately 1,000 people and is part of the Montgomery Metropolitan Statistical Area.
History
Pine Level was founded in 1820 by a group of settlers from Georgia. The town was named for the abundance of pine trees in the area. The town was incorporated in 1887 and was the first town in Autauga County to be incorporated.
The town was a major center for cotton production in the 19th century. The town was also home to a number of sawmills and gristmills. The town was also home to a number of churches, including the Pine Level Baptist Church, which was founded in 1820.
Geography
Pine Level is located in Autauga County, Alabama. The town is situated about 20 miles south of Montgomery, the state capital. The town is located in the central part of the county, near the Autauga County line. The town is situated on the banks of the Autauga Creek.
The town has a total area of 1.2 square miles, all of which is land. The town is located in a hilly area, with the highest point being about 200 feet above sea level. The town is located in a humid subtropical climate zone, with hot summers and mild winters.
Economy
The economy of Pine Level is largely based on agriculture. The town is home to a number of farms, which produce a variety of crops, including cotton, corn, soybeans, and peanuts. The town is also home to a number of small businesses, including restaurants, convenience stores, and auto repair shops.
Demographics
As of the 2010 census, the population of Pine Level was 1,000. The racial makeup of the town was 97.2% White, 0.7% African American, 0.3% Native American, 0.2% Asian, and 1.6% from other races. The median household income was $35,000, and the median family income was $41,000. The per capita income was $17,000.
Conclusion
Pine Level is a small town located in Autauga County, Alabama. The town has a population of approximately 1,000 people and is part of the Montgomery Metropolitan Statistical Area. The town was founded in 1820 and was a major center for cotton production in the 19th century. The economy of Pine Level is largely based on agriculture, and the town is home to a number of small businesses. The population of Pine Level is predominantly White, with a small percentage of African American, Native American, and Asian residents.
Common Questions
What is Per Capita Income in Pine Level?
Per Capita income in Pine Level is $39,384.
What is the Median Family Income in Pine Level?
Median Family Income in Pine Level is $93,523.
What is the Median Household income in Pine Level?
Median Household Income in Pine Level is $82,301.
What is Income or Wage Gap in Pine Level?
Income or Wage Gap in Pine Level is 27.2%.
Women in Pine Level earn 72.8 cents for every dollar earned by a man.
What is Inequality or Gini Index in Pine Level?
Inequality or Gini Index in Pine Level is 0.39.
What is the Total Population of Pine Level?
Total Population of Pine Level is 3,881.
What is the Total Male Population of Pine Level?
Total Male Population of Pine Level is 1,865.
What is the Total Female Population of Pine Level?
Total Female Population of Pine Level is 2,016.
What is the Ratio of Males per 100 Females in Pine Level?
There are 92.51 Males per 100 Females in Pine Level.
What is the Ratio of Females per 100 Males in Pine Level?
There are 108.10 Females per 100 Males in Pine Level.
What is the Median Population Age in Pine Level?
Median Population Age in Pine Level is 37.8 Years.
What is the Average Family Size in Pine Level
Average Family Size in Pine Level is 3.5 People.
What is the Average Household Size in Pine Level
Average Household Size in Pine Level is 2.8 People.
How Large is the Labor Force in Pine Level?
There are 2,061 People in the Labor Forcein in Pine Level.
What is the Percentage of People in the Labor Force in Pine Level?
67.2% of People are in the Labor Force in Pine Level.
What is the Unemployment Rate in Pine Level?
Unemployment Rate in Pine Level is 4.4%.