Stapleton, AL Map & Demographics
Stapleton Map
Stapleton Overview
$35,066
PER CAPITA INCOME
$152,902
AVG FAMILY INCOME
$124,531
AVG HOUSEHOLD INCOME
0.34
INEQUALITY / GINI INDEX
2,392
TOTAL POPULATION
1,281
MALE POPULATION
1,111
FEMALE POPULATION
115.30
MALES / 100 FEMALES
86.73
FEMALES / 100 MALES
37.2
MEDIAN AGE
4.0
AVG FAMILY SIZE
3.6
AVG HOUSEHOLD SIZE
1,089
LABOR FORCE [ PEOPLE ]
74.8%
PERCENT IN LABOR FORCE
Stapleton Zip Codes
Stapleton Area Codes
Income in Stapleton
Income Overview in Stapleton
Per Capita Income in Stapleton is $35,066, while median incomes of families and households are $152,902 and $124,531 respectively.
| Characteristic | Number | Measure |
| Per Capita Income | 2,392 | $35,066 |
| Median Family Income | 527 | $152,902 |
| Mean Family Income | 527 | $137,647 |
| Median Household Income | 666 | $124,531 |
| Mean Household Income | 666 | $119,956 |
| Income Deficit | 527 | $0 |
| Wage / Income Gap (%) | 2,392 | 0.00% |
| Wage / Income Gap ($) | 2,392 | 100.00¢ per $1 |
| Gini / Inequality Index | 2,392 | 0.34 |
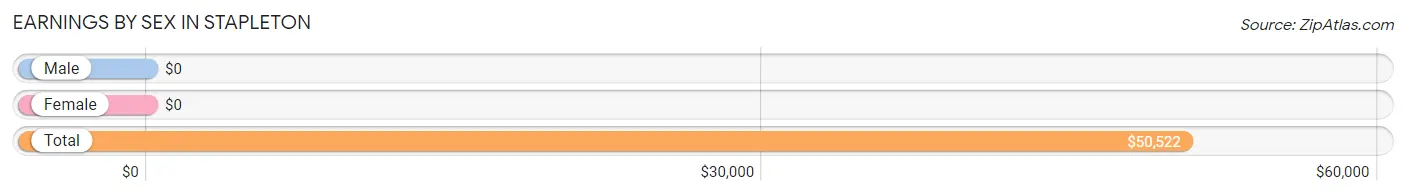
Earnings by Sex in Stapleton
| Sex | Number | Average Earnings |
| Male | 499 (45.8%) | $0 |
| Female | 590 (54.2%) | $0 |
| Total | 1,089 (100.0%) | $50,522 |
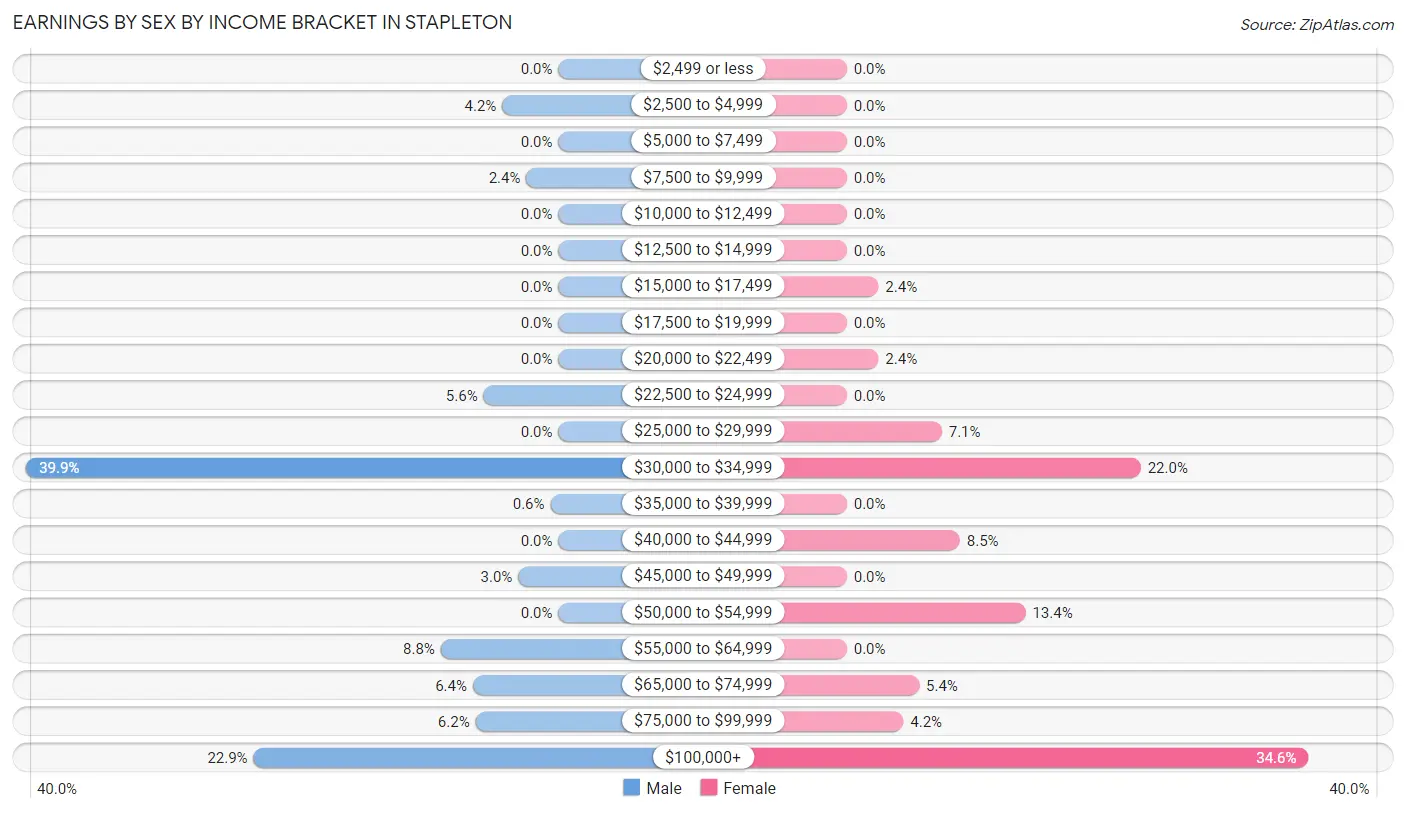
Earnings by Sex by Income Bracket in Stapleton
The most common earnings brackets in Stapleton are $30,000 to $34,999 for men (199 | 39.9%) and $100,000+ for women (204 | 34.6%).
| Income | Male | Female |
| $2,499 or less | 0 (0.0%) | 0 (0.0%) |
| $2,500 to $4,999 | 21 (4.2%) | 0 (0.0%) |
| $5,000 to $7,499 | 0 (0.0%) | 0 (0.0%) |
| $7,500 to $9,999 | 12 (2.4%) | 0 (0.0%) |
| $10,000 to $12,499 | 0 (0.0%) | 0 (0.0%) |
| $12,500 to $14,999 | 0 (0.0%) | 0 (0.0%) |
| $15,000 to $17,499 | 0 (0.0%) | 14 (2.4%) |
| $17,500 to $19,999 | 0 (0.0%) | 0 (0.0%) |
| $20,000 to $22,499 | 0 (0.0%) | 14 (2.4%) |
| $22,500 to $24,999 | 28 (5.6%) | 0 (0.0%) |
| $25,000 to $29,999 | 0 (0.0%) | 42 (7.1%) |
| $30,000 to $34,999 | 199 (39.9%) | 130 (22.0%) |
| $35,000 to $39,999 | 3 (0.6%) | 0 (0.0%) |
| $40,000 to $44,999 | 0 (0.0%) | 50 (8.5%) |
| $45,000 to $49,999 | 15 (3.0%) | 0 (0.0%) |
| $50,000 to $54,999 | 0 (0.0%) | 79 (13.4%) |
| $55,000 to $64,999 | 44 (8.8%) | 0 (0.0%) |
| $65,000 to $74,999 | 32 (6.4%) | 32 (5.4%) |
| $75,000 to $99,999 | 31 (6.2%) | 25 (4.2%) |
| $100,000+ | 114 (22.9%) | 204 (34.6%) |
| Total | 499 (100.0%) | 590 (100.0%) |
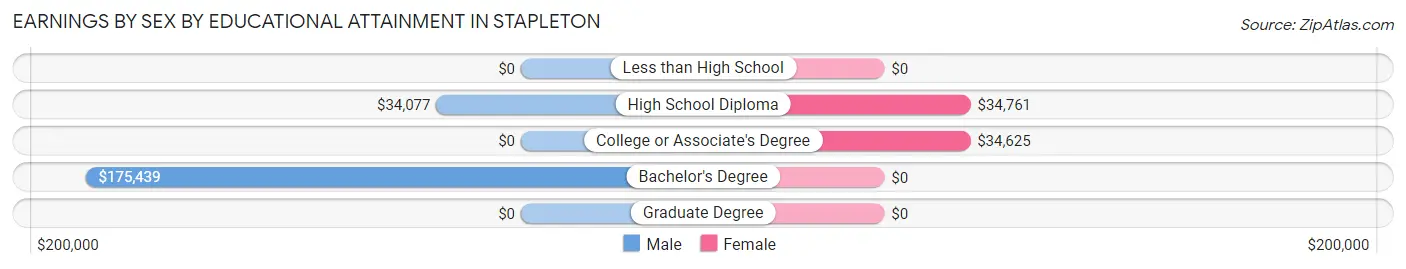
Earnings by Sex by Educational Attainment in Stapleton
| Educational Attainment | Male Income | Female Income |
| Less than High School | - | - |
| High School Diploma | $34,077 | $34,761 |
| College or Associate's Degree | - | - |
| Bachelor's Degree | $175,439 | $0 |
| Graduate Degree | - | - |
| Total | - | - |
Family Income in Stapleton
Family Income Brackets in Stapleton
According to the Stapleton family income data, there are 233 families falling into the $150,000 to $199,999 income range, which is the most common income bracket and makes up 44.2% of all families.
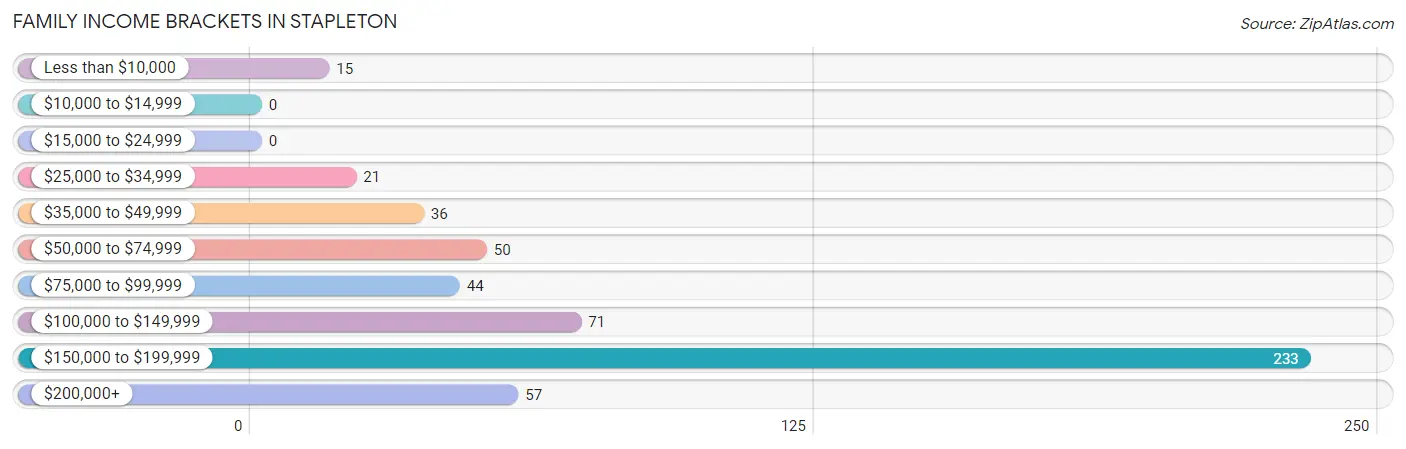
| Income Bracket | # Families | % Families |
| Less than $10,000 | 15 | 2.8% |
| $10,000 to $14,999 | 0 | 0.0% |
| $15,000 to $24,999 | 0 | 0.0% |
| $25,000 to $34,999 | 21 | 4.0% |
| $35,000 to $49,999 | 36 | 6.8% |
| $50,000 to $74,999 | 50 | 9.5% |
| $75,000 to $99,999 | 44 | 8.3% |
| $100,000 to $149,999 | 71 | 13.5% |
| $150,000 to $199,999 | 233 | 44.2% |
| $200,000+ | 57 | 10.8% |
Family Income by Famaliy Size in Stapleton
2-person families (247 | 46.9%) account for the highest median family income in Stapleton with $148,150 per family, while 2-person families (247 | 46.9%) have the highest median income of $74,075 per family member.
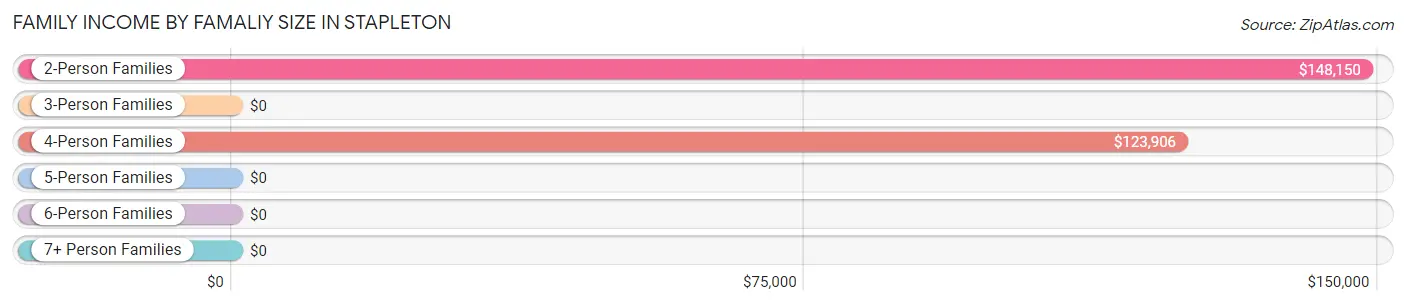
| Income Bracket | # Families | Median Income |
| 2-Person Families | 247 (46.9%) | $148,150 |
| 3-Person Families | 33 (6.3%) | $0 |
| 4-Person Families | 68 (12.9%) | $123,906 |
| 5-Person Families | 14 (2.7%) | $0 |
| 6-Person Families | 165 (31.3%) | $0 |
| 7+ Person Families | 0 (0.0%) | $0 |
| Total | 527 (100.0%) | $152,902 |
Family Income by Number of Earners in Stapleton
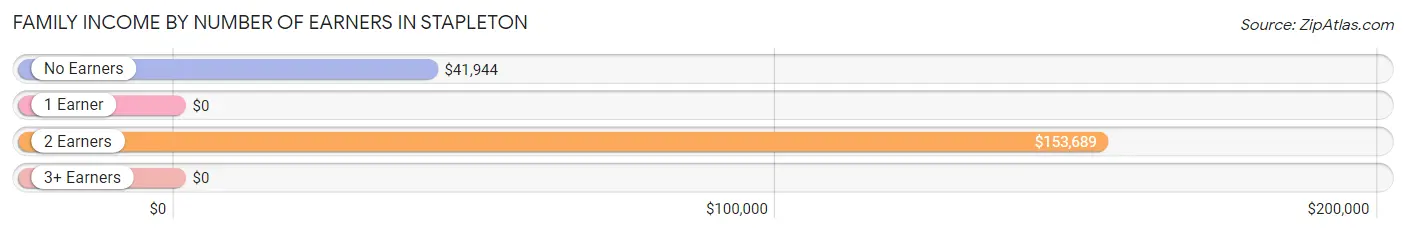
| Number of Earners | # Families | Median Income |
| No Earners | 62 (11.8%) | $41,944 |
| 1 Earner | 62 (11.8%) | $0 |
| 2 Earners | 383 (72.7%) | $153,689 |
| 3+ Earners | 20 (3.8%) | $0 |
| Total | 527 (100.0%) | $152,902 |
Household Income in Stapleton
Household Income Brackets in Stapleton
With 245 households falling in the category, the $150,000 to $199,999 income range is the most frequent in Stapleton, accounting for 36.8% of all households.
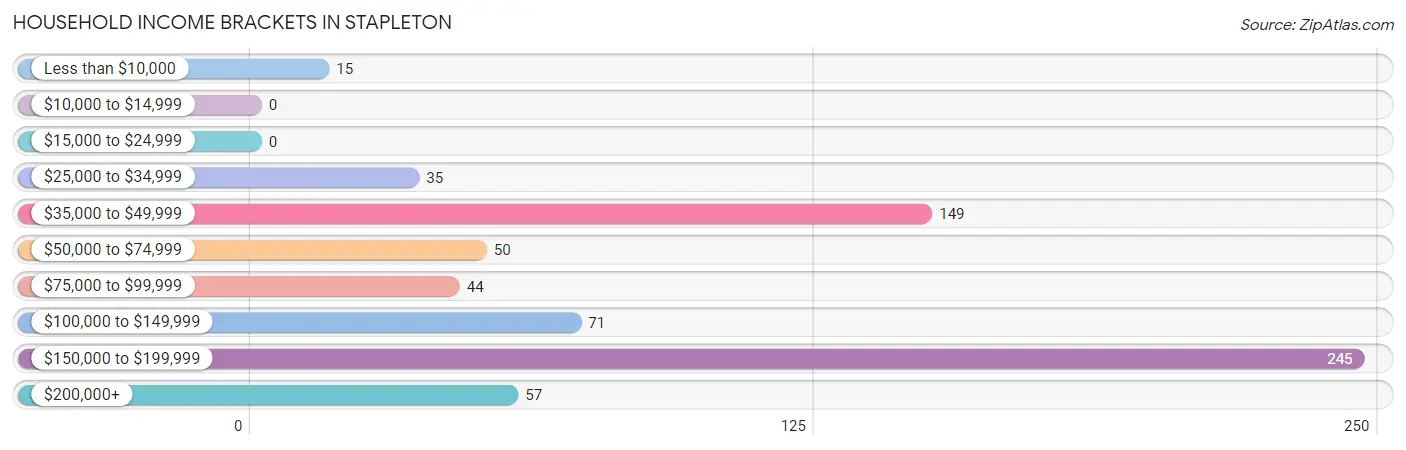
| Income Bracket | # Households | % Households |
| Less than $10,000 | 15 | 2.3% |
| $10,000 to $14,999 | 0 | 0.0% |
| $15,000 to $24,999 | 0 | 0.0% |
| $25,000 to $34,999 | 35 | 5.3% |
| $35,000 to $49,999 | 149 | 22.4% |
| $50,000 to $74,999 | 50 | 7.5% |
| $75,000 to $99,999 | 44 | 6.6% |
| $100,000 to $149,999 | 71 | 10.7% |
| $150,000 to $199,999 | 245 | 36.8% |
| $200,000+ | 57 | 8.6% |
Household Income by Householder Age in Stapleton
The median household income in Stapleton is $124,531, with the highest median household income of $153,205 found in the 25 to 44 years age bracket for the primary householder. A total of 237 households (35.6%) fall into this category.
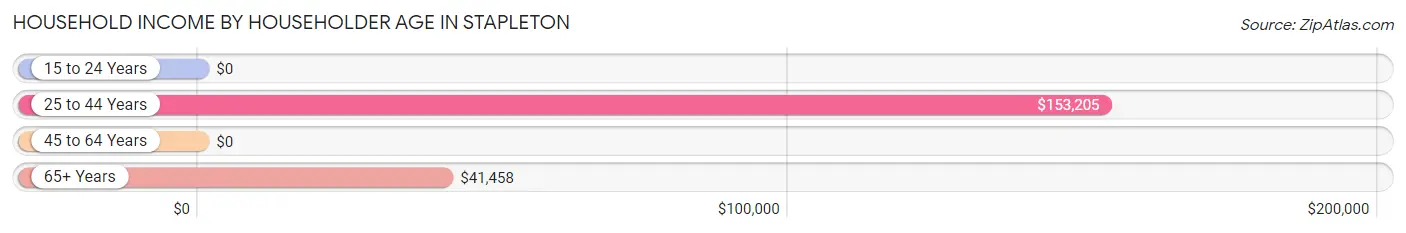
| Income Bracket | # Households | Median Income |
| 15 to 24 Years | 0 (0.0%) | $0 |
| 25 to 44 Years | 237 (35.6%) | $153,205 |
| 45 to 64 Years | 336 (50.4%) | $0 |
| 65+ Years | 93 (14.0%) | $41,458 |
| Total | 666 (100.0%) | $124,531 |
Poverty in Stapleton
Income Below Poverty by Sex and Age in Stapleton
With 12.7% poverty level for males and 5.0% for females among the residents of Stapleton, 55 to 64 year old males and 15 year old females are the most vulnerable to poverty, with 123 males (52.6%) and 14 females (100.0%) in their respective age groups living below the poverty level.
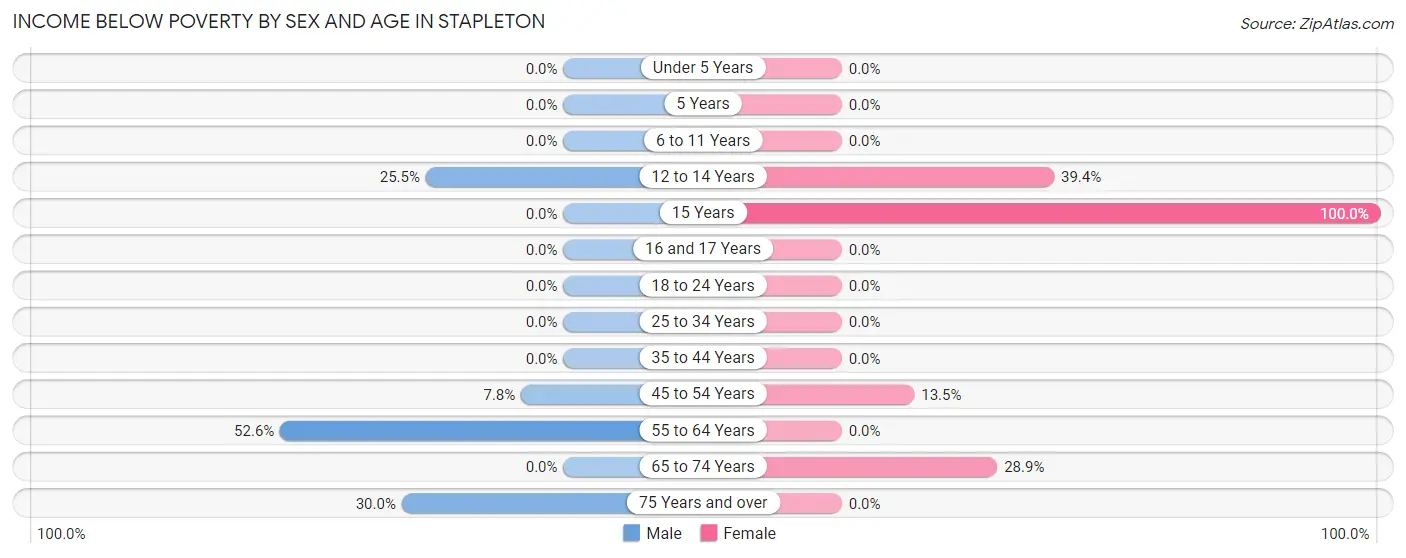
| Age Bracket | Male | Female |
| Under 5 Years | 0 (0.0%) | 0 (0.0%) |
| 5 Years | 0 (0.0%) | 0 (0.0%) |
| 6 to 11 Years | 0 (0.0%) | 0 (0.0%) |
| 12 to 14 Years | 12 (25.5%) | 13 (39.4%) |
| 15 Years | 0 (0.0%) | 14 (100.0%) |
| 16 and 17 Years | 0 (0.0%) | 0 (0.0%) |
| 18 to 24 Years | 0 (0.0%) | 0 (0.0%) |
| 25 to 34 Years | 0 (0.0%) | 0 (0.0%) |
| 35 to 44 Years | 0 (0.0%) | 0 (0.0%) |
| 45 to 54 Years | 12 (7.8%) | 14 (13.5%) |
| 55 to 64 Years | 123 (52.6%) | 0 (0.0%) |
| 65 to 74 Years | 0 (0.0%) | 15 (28.8%) |
| 75 Years and over | 15 (30.0%) | 0 (0.0%) |
| Total | 162 (12.7%) | 56 (5.0%) |
Income Above Poverty by Sex and Age in Stapleton
According to the poverty statistics in Stapleton, males aged under 5 years and females aged under 5 years are the age groups that are most secure financially, with 100.0% of males and 100.0% of females in these age groups living above the poverty line.
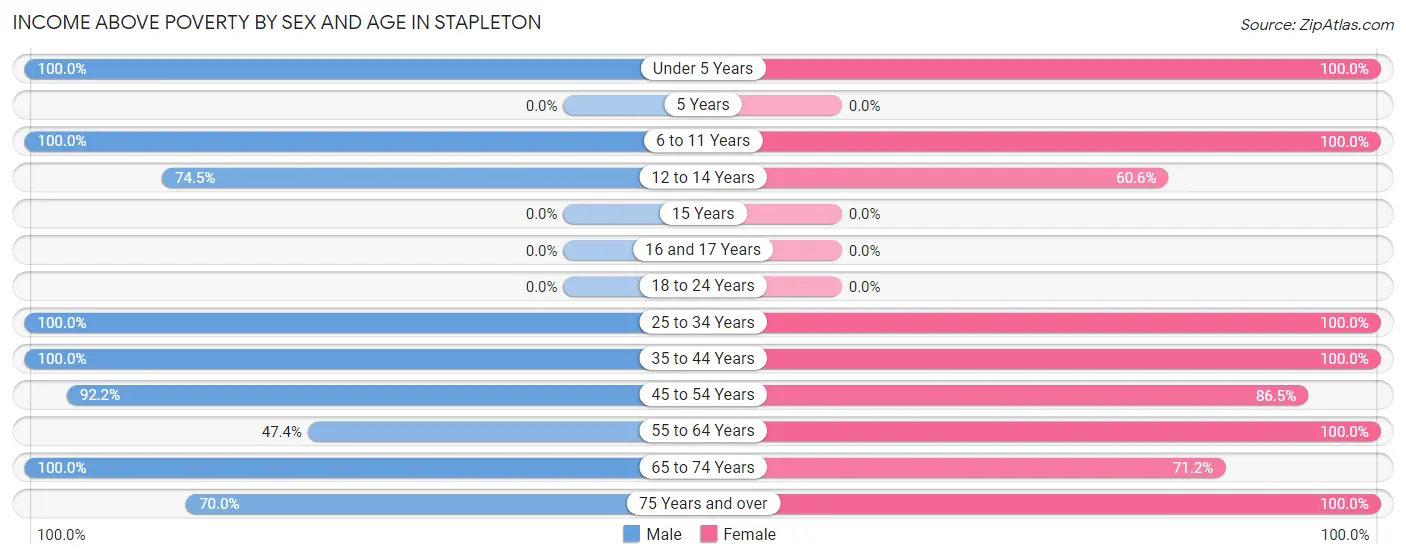
| Age Bracket | Male | Female |
| Under 5 Years | 314 (100.0%) | 34 (100.0%) |
| 5 Years | 0 (0.0%) | 0 (0.0%) |
| 6 to 11 Years | 158 (100.0%) | 336 (100.0%) |
| 12 to 14 Years | 35 (74.5%) | 20 (60.6%) |
| 15 Years | 0 (0.0%) | 0 (0.0%) |
| 16 and 17 Years | 0 (0.0%) | 0 (0.0%) |
| 18 to 24 Years | 0 (0.0%) | 0 (0.0%) |
| 25 to 34 Years | 83 (100.0%) | 149 (100.0%) |
| 35 to 44 Years | 199 (100.0%) | 165 (100.0%) |
| 45 to 54 Years | 141 (92.2%) | 90 (86.5%) |
| 55 to 64 Years | 111 (47.4%) | 196 (100.0%) |
| 65 to 74 Years | 43 (100.0%) | 37 (71.2%) |
| 75 Years and over | 35 (70.0%) | 28 (100.0%) |
| Total | 1,119 (87.4%) | 1,055 (95.0%) |
Income Below Poverty Among Married-Couple Families in Stapleton
The poverty statistics for married-couple families in Stapleton show that 6.1% or 29 of the total 472 families live below the poverty line. Families with 3 or 4 children have the highest poverty rate of 7.8%, comprising of 14 families. On the other hand, families with 1 or 2 children have the lowest poverty rate of 0.0%, which includes 0 families.
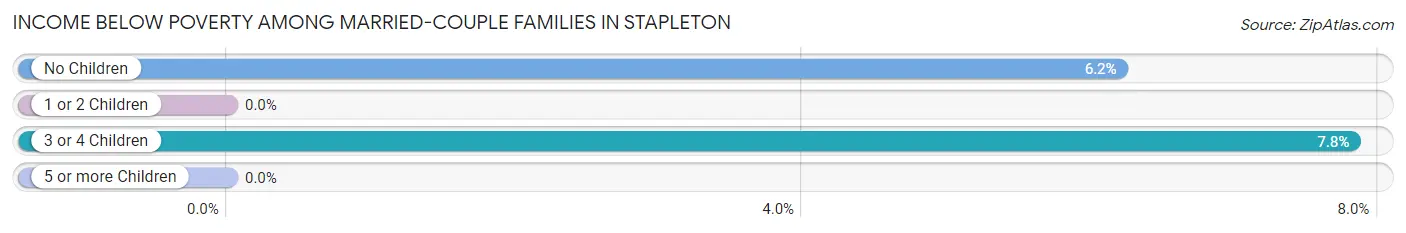
| Children | Above Poverty | Below Poverty |
| No Children | 227 (93.8%) | 15 (6.2%) |
| 1 or 2 Children | 51 (100.0%) | 0 (0.0%) |
| 3 or 4 Children | 165 (92.2%) | 14 (7.8%) |
| 5 or more Children | 0 (0.0%) | 0 (0.0%) |
| Total | 443 (93.9%) | 29 (6.1%) |
Income Below Poverty Among Single-Parent Households in Stapleton
| Children | Single Father | Single Mother |
| No Children | 0 (0.0%) | 0 (0.0%) |
| 1 or 2 Children | 0 (0.0%) | 0 (0.0%) |
| 3 or 4 Children | 0 (0.0%) | 0 (0.0%) |
| 5 or more Children | 0 (0.0%) | 0 (0.0%) |
| Total | 0 (0.0%) | 0 (0.0%) |
Income Below Poverty Among Married-Couple vs Single-Parent Households in Stapleton
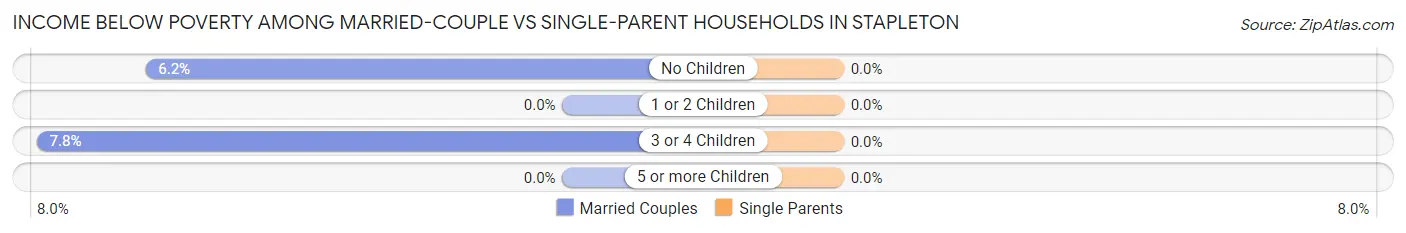
| Children | Married-Couple Families | Single-Parent Households |
| No Children | 15 (6.2%) | 0 (0.0%) |
| 1 or 2 Children | 0 (0.0%) | 0 (0.0%) |
| 3 or 4 Children | 14 (7.8%) | 0 (0.0%) |
| 5 or more Children | 0 (0.0%) | 0 (0.0%) |
| Total | 29 (6.1%) | 0 (0.0%) |
Race in Stapleton
The most populous races in Stapleton are White / Caucasian (2,202 | 92.1%), Two or more Races (171 | 7.1%), and Hispanic or Latino (123 | 5.1%).
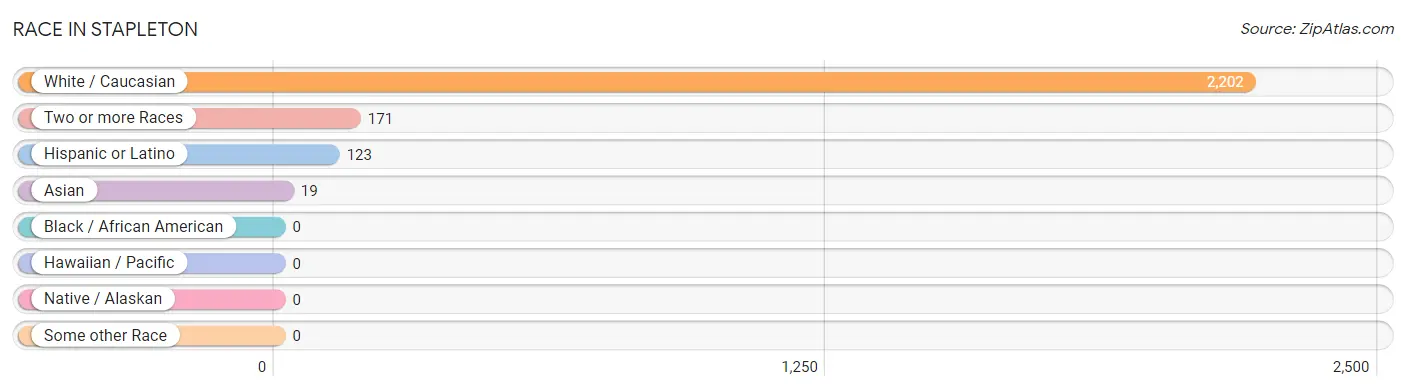
| Race | # Population | % Population |
| Asian | 19 | 0.8% |
| Black / African American | 0 | 0.0% |
| Hawaiian / Pacific | 0 | 0.0% |
| Hispanic or Latino | 123 | 5.1% |
| Native / Alaskan | 0 | 0.0% |
| White / Caucasian | 2,202 | 92.1% |
| Two or more Races | 171 | 7.1% |
| Some other Race | 0 | 0.0% |
| Total | 2,392 | 100.0% |
Ancestry in Stapleton
The most populous ancestries reported in Stapleton are European (210 | 8.8%), American (180 | 7.5%), Irish (130 | 5.4%), Mexican (123 | 5.1%), and French (110 | 4.6%), together accounting for 31.5% of all Stapleton residents.
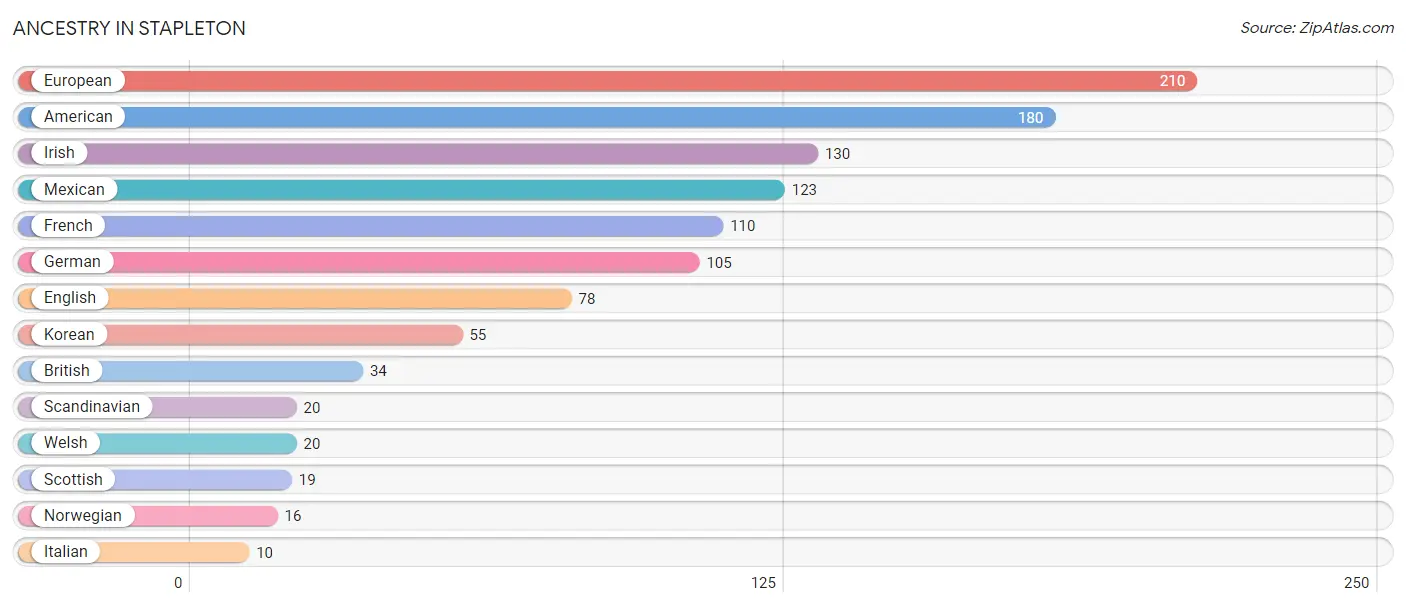
| Ancestry | # Population | % Population |
| American | 180 | 7.5% |
| British | 34 | 1.4% |
| English | 78 | 3.3% |
| European | 210 | 8.8% |
| French | 110 | 4.6% |
| German | 105 | 4.4% |
| Irish | 130 | 5.4% |
| Italian | 10 | 0.4% |
| Korean | 55 | 2.3% |
| Mexican | 123 | 5.1% |
| Norwegian | 16 | 0.7% |
| Scandinavian | 20 | 0.8% |
| Scottish | 19 | 0.8% |
| Welsh | 20 | 0.8% | View All 14 Rows |
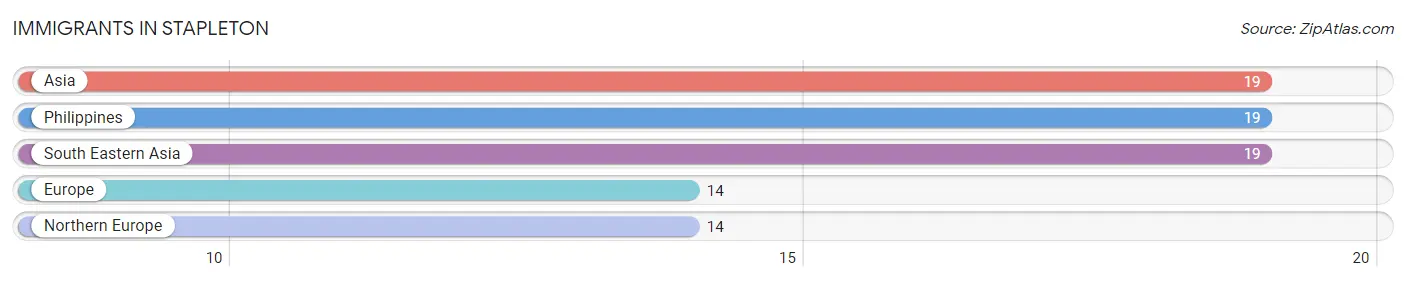
Immigrants in Stapleton
The most numerous immigrant groups reported in Stapleton came from Asia (19 | 0.8%), Philippines (19 | 0.8%), South Eastern Asia (19 | 0.8%), Europe (14 | 0.6%), and Northern Europe (14 | 0.6%), together accounting for 3.6% of all Stapleton residents.
| Immigration Origin | # Population | % Population |
| Asia | 19 | 0.8% |
| Europe | 14 | 0.6% |
| Northern Europe | 14 | 0.6% |
| Philippines | 19 | 0.8% |
| South Eastern Asia | 19 | 0.8% | View All 5 Rows |
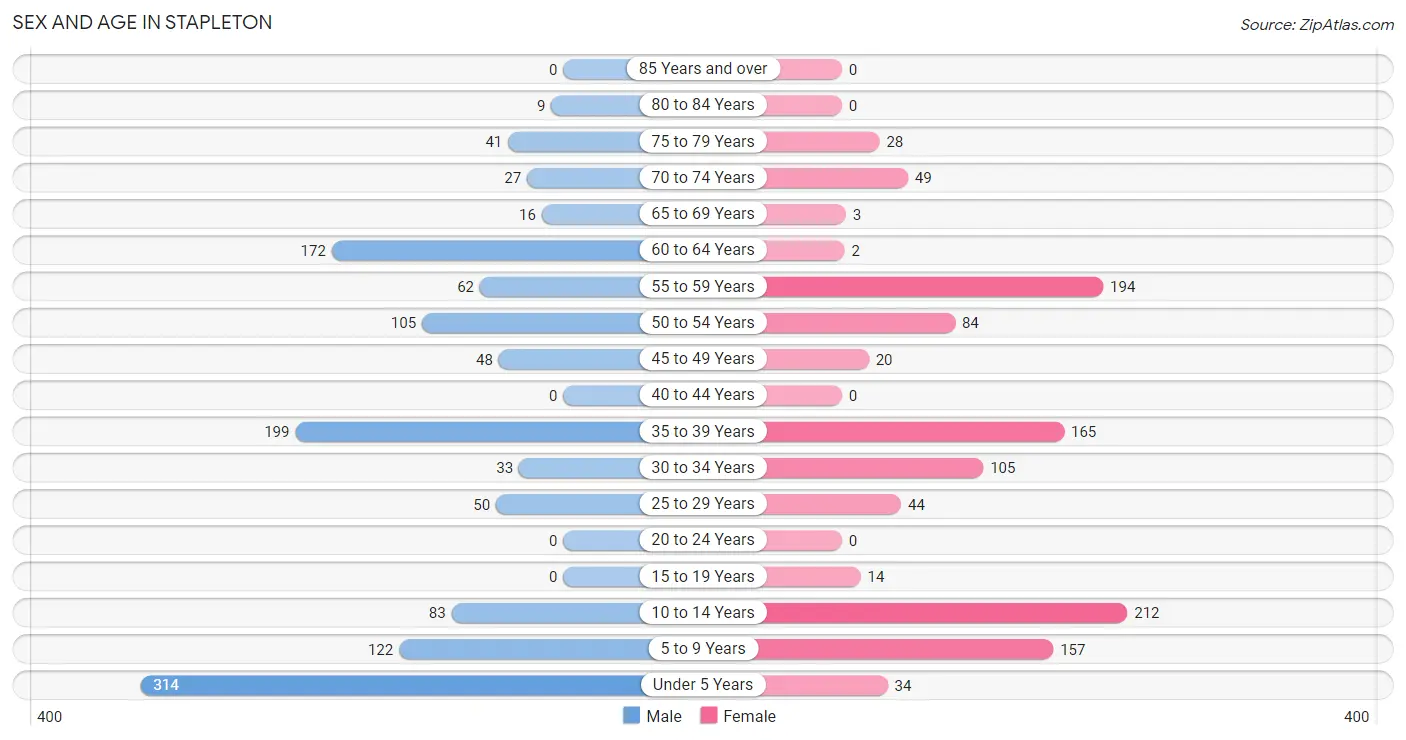
Sex and Age in Stapleton
Sex and Age in Stapleton
The most populous age groups in Stapleton are Under 5 Years (314 | 24.5%) for men and 10 to 14 Years (212 | 19.1%) for women.
| Age Bracket | Male | Female |
| Under 5 Years | 314 (24.5%) | 34 (3.1%) |
| 5 to 9 Years | 122 (9.5%) | 157 (14.1%) |
| 10 to 14 Years | 83 (6.5%) | 212 (19.1%) |
| 15 to 19 Years | 0 (0.0%) | 14 (1.3%) |
| 20 to 24 Years | 0 (0.0%) | 0 (0.0%) |
| 25 to 29 Years | 50 (3.9%) | 44 (4.0%) |
| 30 to 34 Years | 33 (2.6%) | 105 (9.5%) |
| 35 to 39 Years | 199 (15.5%) | 165 (14.8%) |
| 40 to 44 Years | 0 (0.0%) | 0 (0.0%) |
| 45 to 49 Years | 48 (3.7%) | 20 (1.8%) |
| 50 to 54 Years | 105 (8.2%) | 84 (7.6%) |
| 55 to 59 Years | 62 (4.8%) | 194 (17.5%) |
| 60 to 64 Years | 172 (13.4%) | 2 (0.2%) |
| 65 to 69 Years | 16 (1.3%) | 3 (0.3%) |
| 70 to 74 Years | 27 (2.1%) | 49 (4.4%) |
| 75 to 79 Years | 41 (3.2%) | 28 (2.5%) |
| 80 to 84 Years | 9 (0.7%) | 0 (0.0%) |
| 85 Years and over | 0 (0.0%) | 0 (0.0%) |
| Total | 1,281 (100.0%) | 1,111 (100.0%) |
Families and Households in Stapleton
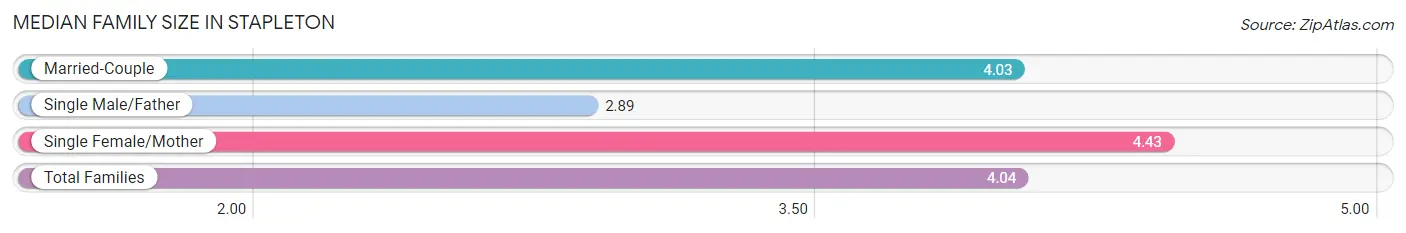
Median Family Size in Stapleton
The median family size in Stapleton is 4.04 persons per family, with single female/mother families (46 | 8.7%) accounting for the largest median family size of 4.43 persons per family. On the other hand, single male/father families (9 | 1.7%) represent the smallest median family size with 2.89 persons per family.
| Family Type | # Families | Family Size |
| Married-Couple | 472 (89.6%) | 4.03 |
| Single Male/Father | 9 (1.7%) | 2.89 |
| Single Female/Mother | 46 (8.7%) | 4.43 |
| Total Families | 527 (100.0%) | 4.04 |
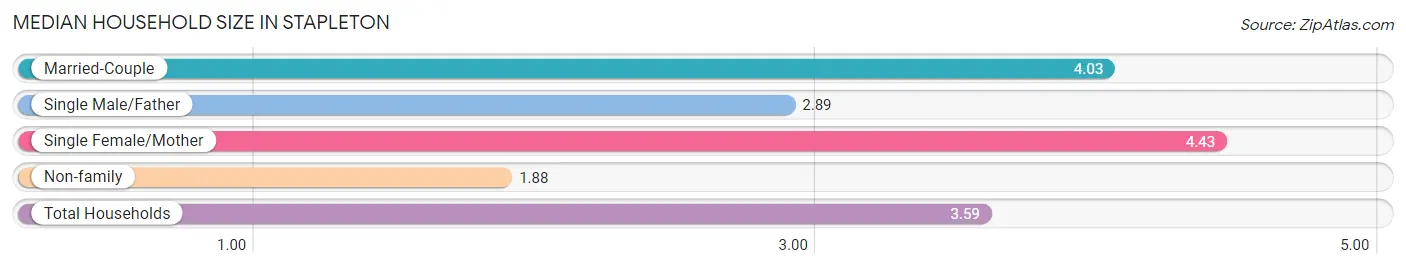
Median Household Size in Stapleton
The median household size in Stapleton is 3.59 persons per household, with single female/mother households (46 | 6.9%) accounting for the largest median household size of 4.43 persons per household. non-family households (139 | 20.9%) represent the smallest median household size with 1.88 persons per household.
| Household Type | # Households | Household Size |
| Married-Couple | 472 (70.9%) | 4.03 |
| Single Male/Father | 9 (1.3%) | 2.89 |
| Single Female/Mother | 46 (6.9%) | 4.43 |
| Non-family | 139 (20.9%) | 1.88 |
| Total Households | 666 (100.0%) | 3.59 |
Household Size by Marriage Status in Stapleton
Out of a total of 666 households in Stapleton, 527 (79.1%) are family households, while 139 (20.9%) are nonfamily households. The most numerous type of family households are 2-person households, comprising 247, and the most common type of nonfamily households are 2-person households, comprising 110.
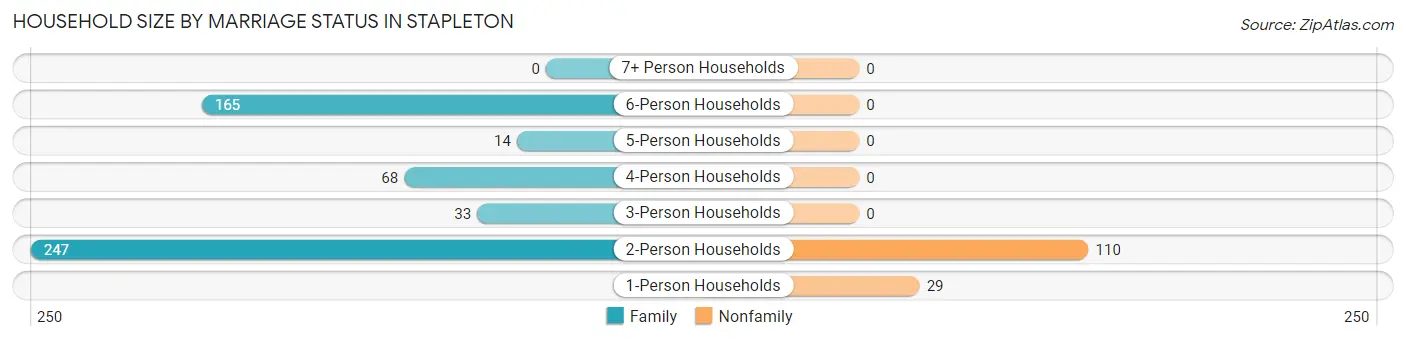
| Household Size | Family Households | Nonfamily Households |
| 1-Person Households | - | 29 (4.3%) |
| 2-Person Households | 247 (37.1%) | 110 (16.5%) |
| 3-Person Households | 33 (5.0%) | 0 (0.0%) |
| 4-Person Households | 68 (10.2%) | 0 (0.0%) |
| 5-Person Households | 14 (2.1%) | 0 (0.0%) |
| 6-Person Households | 165 (24.8%) | 0 (0.0%) |
| 7+ Person Households | 0 (0.0%) | 0 (0.0%) |
| Total | 527 (79.1%) | 139 (20.9%) |
Female Fertility in Stapleton
Fertility by Age in Stapleton
Average fertility rate in Stapleton is 91.0 births per 1,000 women. Women in the age bracket of 20 to 34 years have the highest fertility rate with 221.0 births per 1,000 women. Women in the age bracket of 20 to 34 years acount for 100.0% of all women with births.
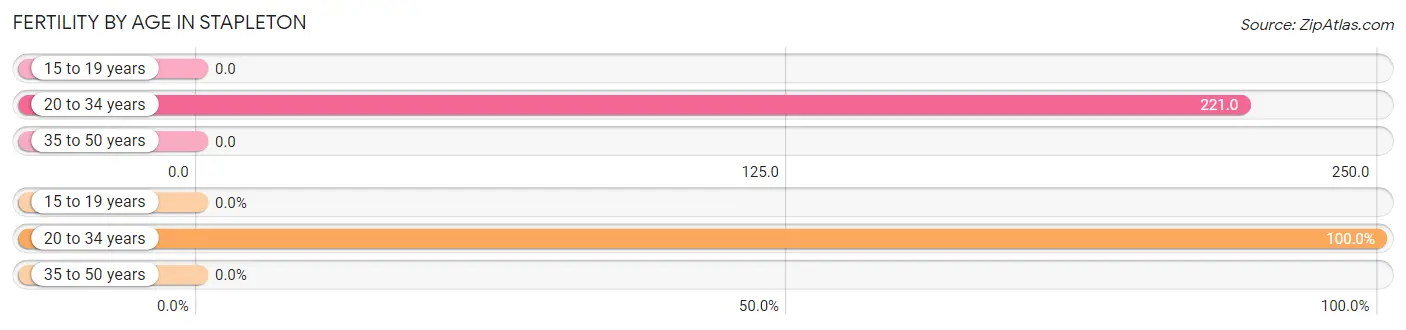
| Age Bracket | Women with Births | Births / 1,000 Women |
| 15 to 19 years | 0 (0.0%) | 0.0 |
| 20 to 34 years | 33 (100.0%) | 221.0 |
| 35 to 50 years | 0 (0.0%) | 0.0 |
| Total | 33 (100.0%) | 91.0 |
Fertility by Age by Marriage Status in Stapleton
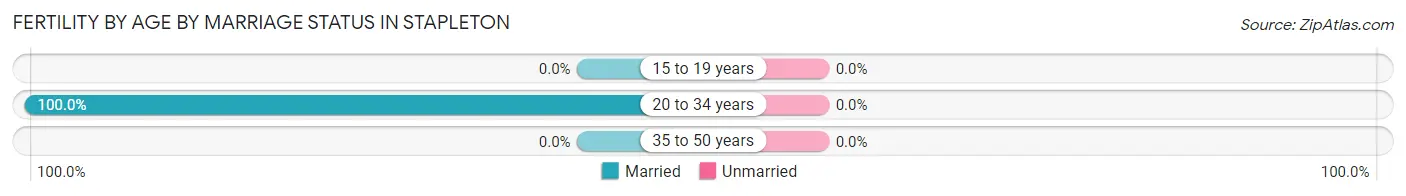
| Age Bracket | Married | Unmarried |
| 15 to 19 years | 0 (0.0%) | 0 (0.0%) |
| 20 to 34 years | 33 (100.0%) | 0 (0.0%) |
| 35 to 50 years | 0 (0.0%) | 0 (0.0%) |
| Total | 33 (100.0%) | 0 (0.0%) |
Fertility by Education in Stapleton
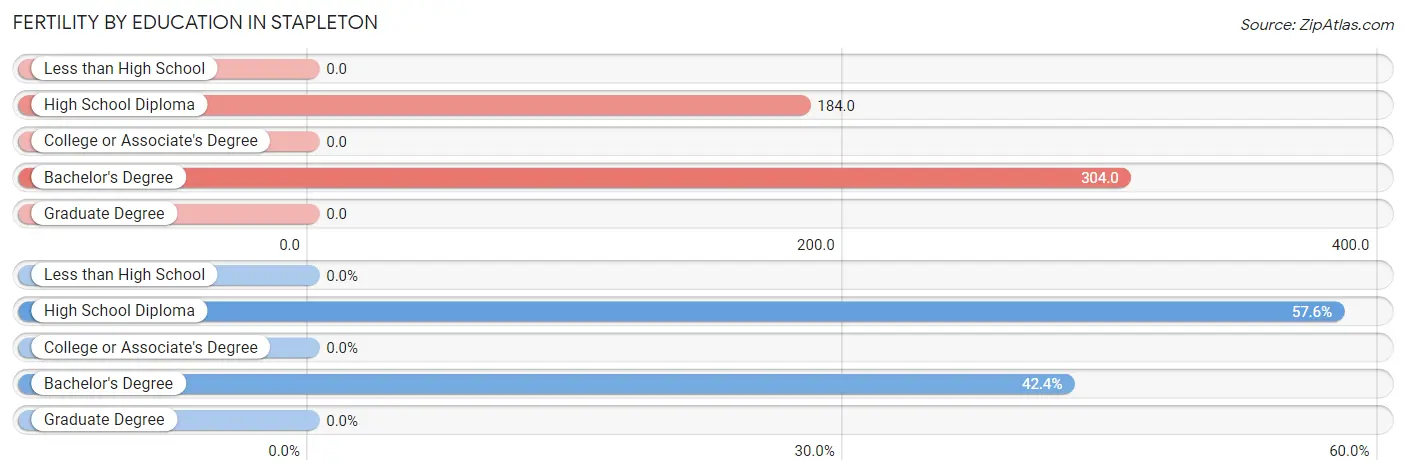
| Educational Attainment | Women with Births | Births / 1,000 Women |
| Less than High School | 0 (0.0%) | 0.0 |
| High School Diploma | 19 (57.6%) | 184.0 |
| College or Associate's Degree | 0 (0.0%) | 0.0 |
| Bachelor's Degree | 14 (42.4%) | 304.0 |
| Graduate Degree | 0 (0.0%) | 0.0 |
| Total | 33 (100.0%) | 91.0 |
Fertility by Education by Marriage Status in Stapleton
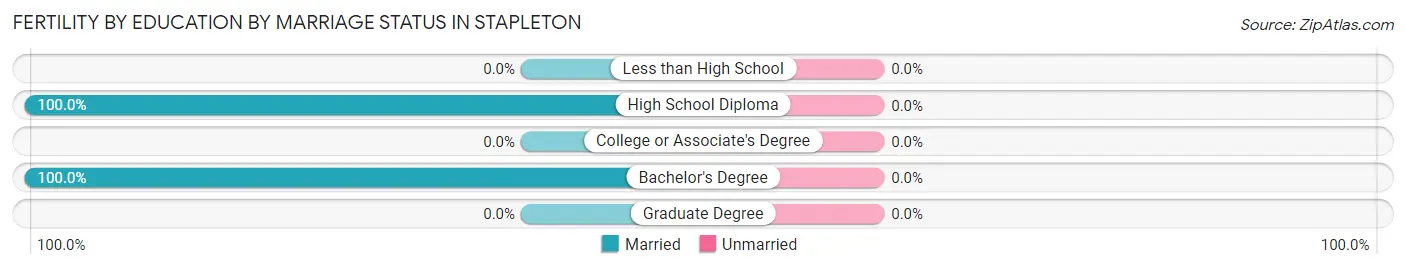
| Educational Attainment | Married | Unmarried |
| Less than High School | 0 (0.0%) | 0 (0.0%) |
| High School Diploma | 19 (100.0%) | 0 (0.0%) |
| College or Associate's Degree | 0 (0.0%) | 0 (0.0%) |
| Bachelor's Degree | 14 (100.0%) | 0 (0.0%) |
| Graduate Degree | 0 (0.0%) | 0 (0.0%) |
| Total | 33 (100.0%) | 0 (0.0%) |
Employment Characteristics in Stapleton
Employment by Class of Employer in Stapleton
Among the 1,089 employed individuals in Stapleton, private company employees (908 | 83.4%), self-employed (not incorporated) (73 | 6.7%), and self-employed (incorporated) (44 | 4.0%) make up the most common classes of employment.
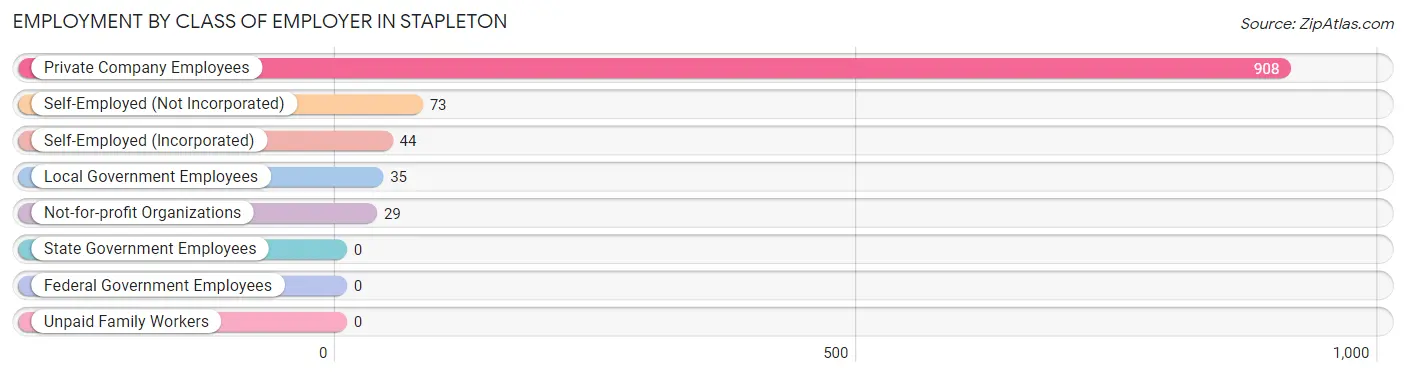
| Employer Class | # Employees | % Employees |
| Private Company Employees | 908 | 83.4% |
| Self-Employed (Incorporated) | 44 | 4.0% |
| Self-Employed (Not Incorporated) | 73 | 6.7% |
| Not-for-profit Organizations | 29 | 2.7% |
| Local Government Employees | 35 | 3.2% |
| State Government Employees | 0 | 0.0% |
| Federal Government Employees | 0 | 0.0% |
| Unpaid Family Workers | 0 | 0.0% |
| Total | 1,089 | 100.0% |
Employment Status by Age in Stapleton
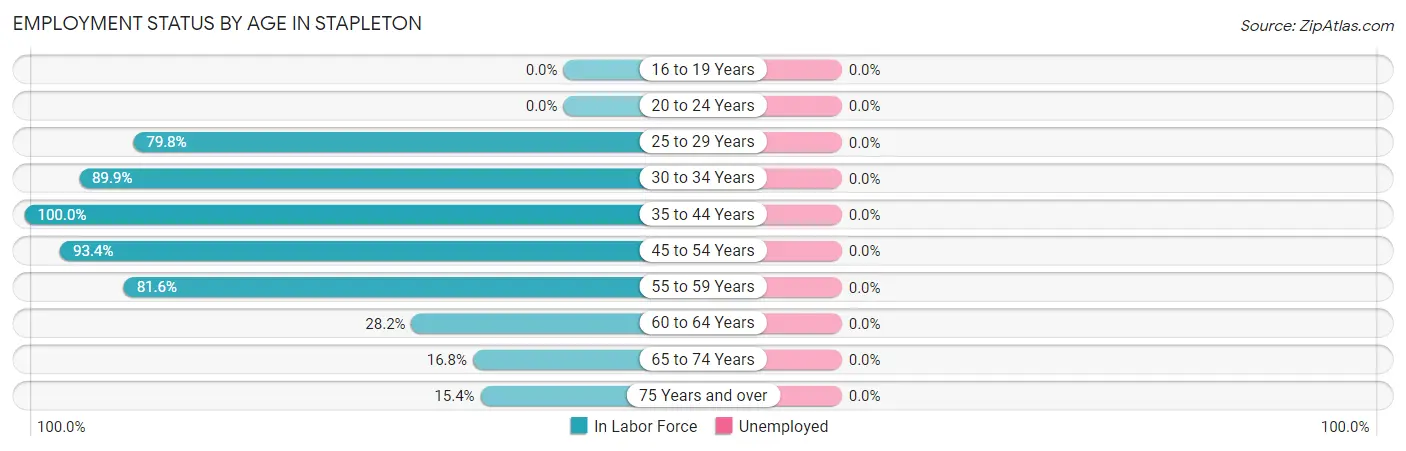
| Age Bracket | In Labor Force | Unemployed |
| 16 to 19 Years | 0 (0.0%) | 0 (0.0%) |
| 20 to 24 Years | 0 (0.0%) | 0 (0.0%) |
| 25 to 29 Years | 75 (79.8%) | 0 (0.0%) |
| 30 to 34 Years | 124 (89.9%) | 0 (0.0%) |
| 35 to 44 Years | 364 (100.0%) | 0 (0.0%) |
| 45 to 54 Years | 240 (93.4%) | 0 (0.0%) |
| 55 to 59 Years | 209 (81.6%) | 0 (0.0%) |
| 60 to 64 Years | 49 (28.2%) | 0 (0.0%) |
| 65 to 74 Years | 16 (16.8%) | 0 (0.0%) |
| 75 Years and over | 12 (15.4%) | 0 (0.0%) |
| Total | 1,089 (74.8%) | 0 (0.0%) |
Employment Status by Educational Attainment in Stapleton
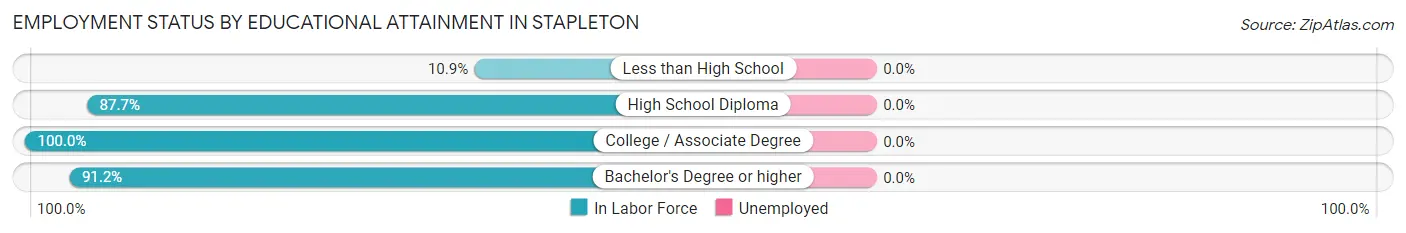
| Educational Attainment | In Labor Force | Unemployed |
| Less than High School | 15 (10.9%) | 0 (0.0%) |
| High School Diploma | 486 (87.7%) | 0 (0.0%) |
| College / Associate Degree | 238 (100.0%) | 0 (0.0%) |
| Bachelor's Degree or higher | 322 (91.2%) | 0 (0.0%) |
| Total | 1,061 (82.7%) | 0 (0.0%) |
Employment Occupations by Sex in Stapleton
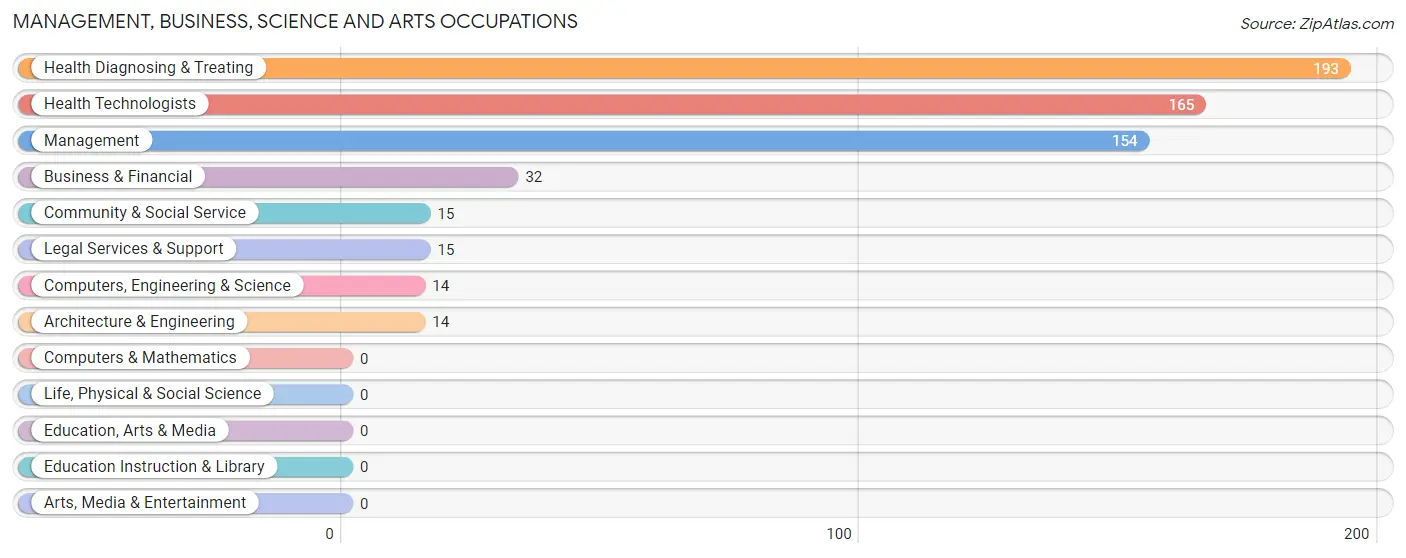
Management, Business, Science and Arts Occupations
The most common Management, Business, Science and Arts occupations in Stapleton are Health Diagnosing & Treating (193 | 17.7%), Health Technologists (165 | 15.1%), Management (154 | 14.1%), Business & Financial (32 | 2.9%), and Community & Social Service (15 | 1.4%).
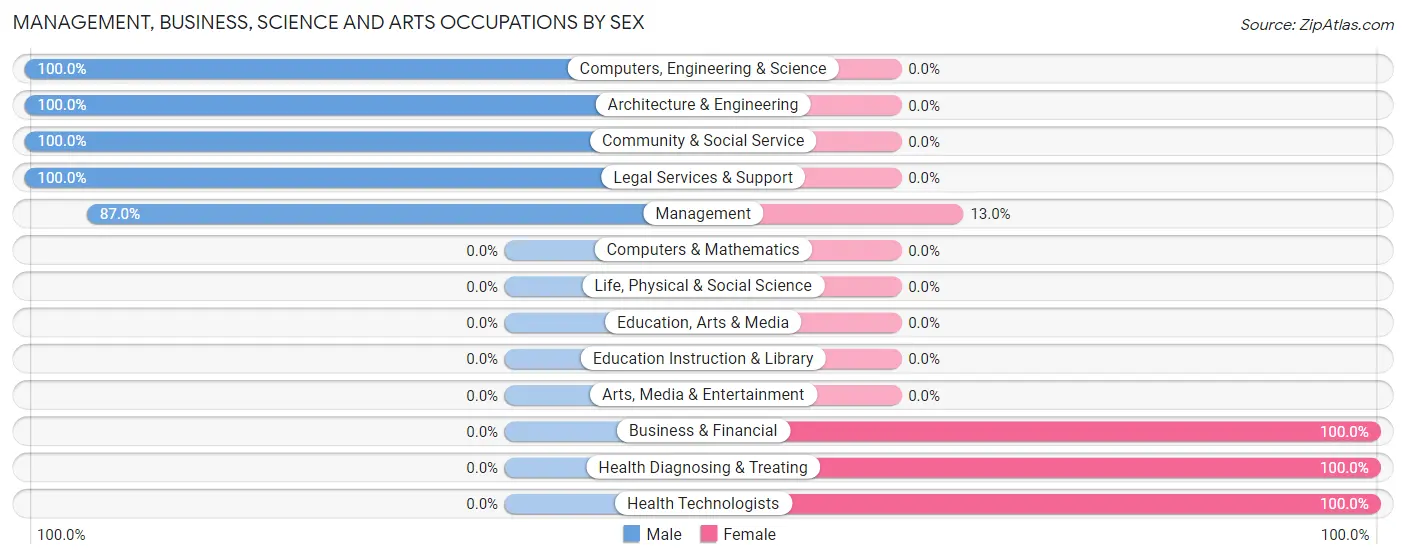
Management, Business, Science and Arts Occupations by Sex
Within the Management, Business, Science and Arts occupations in Stapleton, the most male-oriented occupations are Computers, Engineering & Science (100.0%), Architecture & Engineering (100.0%), and Community & Social Service (100.0%), while the most female-oriented occupations are Business & Financial (100.0%), Health Diagnosing & Treating (100.0%), and Health Technologists (100.0%).
| Occupation | Male | Female |
| Management | 134 (87.0%) | 20 (13.0%) |
| Business & Financial | 0 (0.0%) | 32 (100.0%) |
| Computers, Engineering & Science | 14 (100.0%) | 0 (0.0%) |
| Computers & Mathematics | 0 (0.0%) | 0 (0.0%) |
| Architecture & Engineering | 14 (100.0%) | 0 (0.0%) |
| Life, Physical & Social Science | 0 (0.0%) | 0 (0.0%) |
| Community & Social Service | 15 (100.0%) | 0 (0.0%) |
| Education, Arts & Media | 0 (0.0%) | 0 (0.0%) |
| Legal Services & Support | 15 (100.0%) | 0 (0.0%) |
| Education Instruction & Library | 0 (0.0%) | 0 (0.0%) |
| Arts, Media & Entertainment | 0 (0.0%) | 0 (0.0%) |
| Health Diagnosing & Treating | 0 (0.0%) | 193 (100.0%) |
| Health Technologists | 0 (0.0%) | 165 (100.0%) |
| Total (Category) | 163 (40.0%) | 245 (60.1%) |
| Total (Overall) | 499 (45.8%) | 590 (54.2%) |
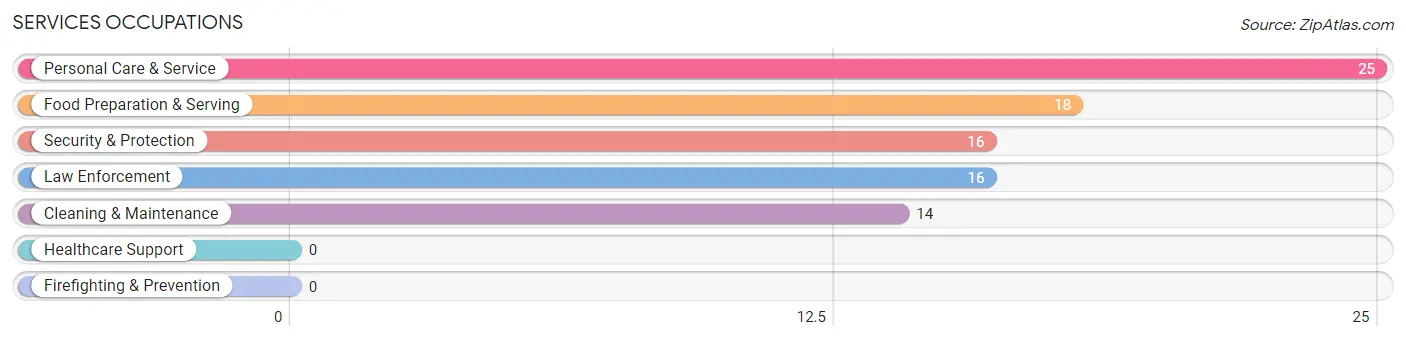
Services Occupations
The most common Services occupations in Stapleton are Personal Care & Service (25 | 2.3%), Food Preparation & Serving (18 | 1.7%), Security & Protection (16 | 1.5%), Law Enforcement (16 | 1.5%), and Cleaning & Maintenance (14 | 1.3%).
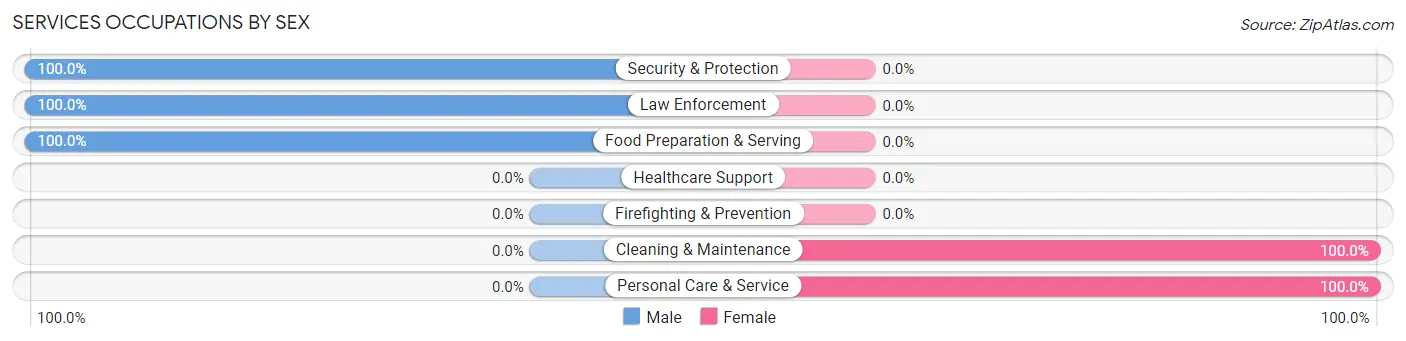
Services Occupations by Sex
Within the Services occupations in Stapleton, the most male-oriented occupations are Security & Protection (100.0%), Law Enforcement (100.0%), and Food Preparation & Serving (100.0%), while the most female-oriented occupations are Cleaning & Maintenance (100.0%), and Personal Care & Service (100.0%).
| Occupation | Male | Female |
| Healthcare Support | 0 (0.0%) | 0 (0.0%) |
| Security & Protection | 16 (100.0%) | 0 (0.0%) |
| Firefighting & Prevention | 0 (0.0%) | 0 (0.0%) |
| Law Enforcement | 16 (100.0%) | 0 (0.0%) |
| Food Preparation & Serving | 18 (100.0%) | 0 (0.0%) |
| Cleaning & Maintenance | 0 (0.0%) | 14 (100.0%) |
| Personal Care & Service | 0 (0.0%) | 25 (100.0%) |
| Total (Category) | 34 (46.6%) | 39 (53.4%) |
| Total (Overall) | 499 (45.8%) | 590 (54.2%) |
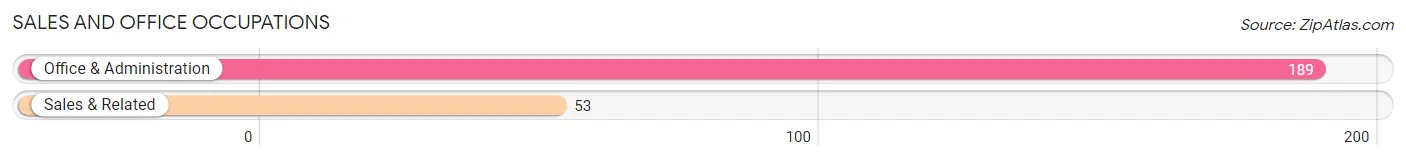
Sales and Office Occupations
The most common Sales and Office occupations in Stapleton are Office & Administration (189 | 17.4%), and Sales & Related (53 | 4.9%).
Sales and Office Occupations by Sex
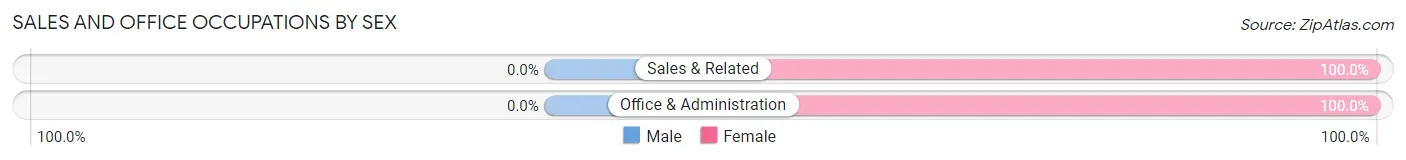
| Occupation | Male | Female |
| Sales & Related | 0 (0.0%) | 53 (100.0%) |
| Office & Administration | 0 (0.0%) | 189 (100.0%) |
| Total (Category) | 0 (0.0%) | 242 (100.0%) |
| Total (Overall) | 499 (45.8%) | 590 (54.2%) |
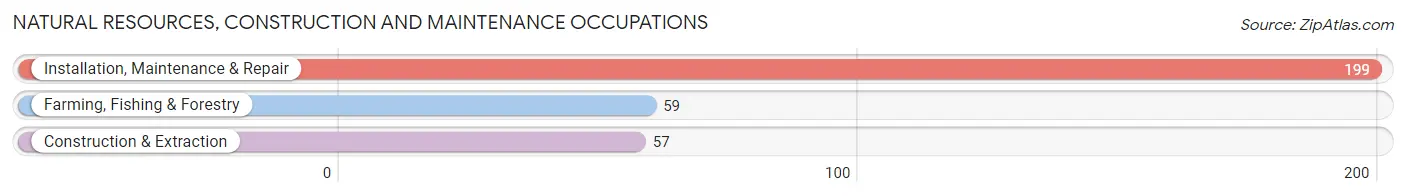
Natural Resources, Construction and Maintenance Occupations
The most common Natural Resources, Construction and Maintenance occupations in Stapleton are Installation, Maintenance & Repair (199 | 18.3%), Farming, Fishing & Forestry (59 | 5.4%), and Construction & Extraction (57 | 5.2%).
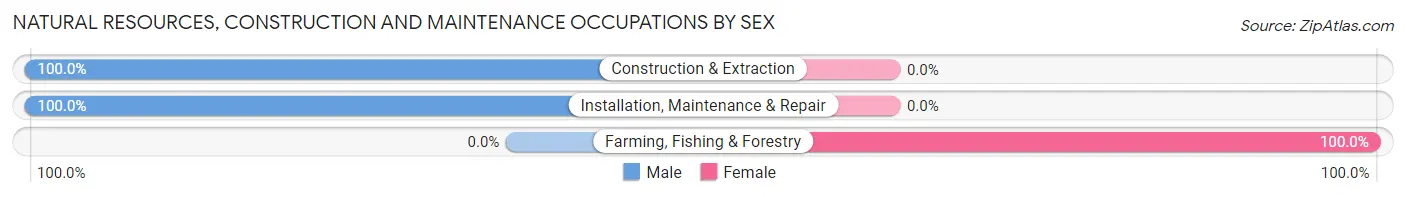
Natural Resources, Construction and Maintenance Occupations by Sex
| Occupation | Male | Female |
| Farming, Fishing & Forestry | 0 (0.0%) | 59 (100.0%) |
| Construction & Extraction | 57 (100.0%) | 0 (0.0%) |
| Installation, Maintenance & Repair | 199 (100.0%) | 0 (0.0%) |
| Total (Category) | 256 (81.3%) | 59 (18.7%) |
| Total (Overall) | 499 (45.8%) | 590 (54.2%) |
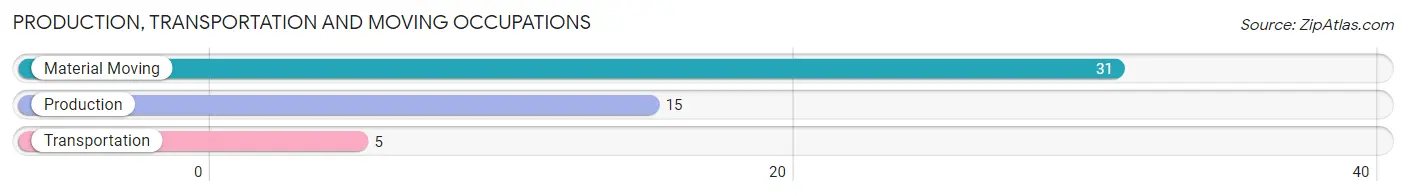
Production, Transportation and Moving Occupations
The most common Production, Transportation and Moving occupations in Stapleton are Material Moving (31 | 2.9%), Production (15 | 1.4%), and Transportation (5 | 0.5%).
Production, Transportation and Moving Occupations by Sex
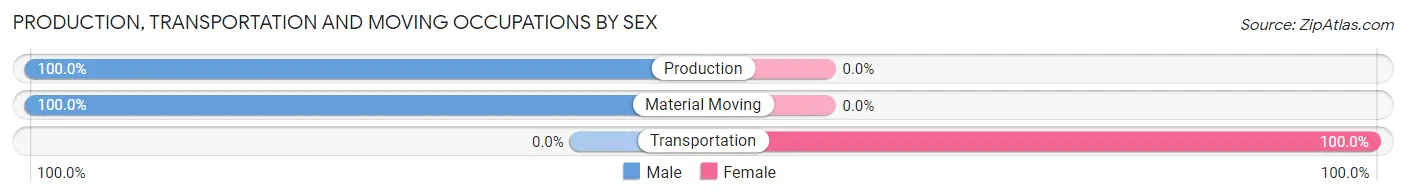
| Occupation | Male | Female |
| Production | 15 (100.0%) | 0 (0.0%) |
| Transportation | 0 (0.0%) | 5 (100.0%) |
| Material Moving | 31 (100.0%) | 0 (0.0%) |
| Total (Category) | 46 (90.2%) | 5 (9.8%) |
| Total (Overall) | 499 (45.8%) | 590 (54.2%) |
Employment Industries by Sex in Stapleton
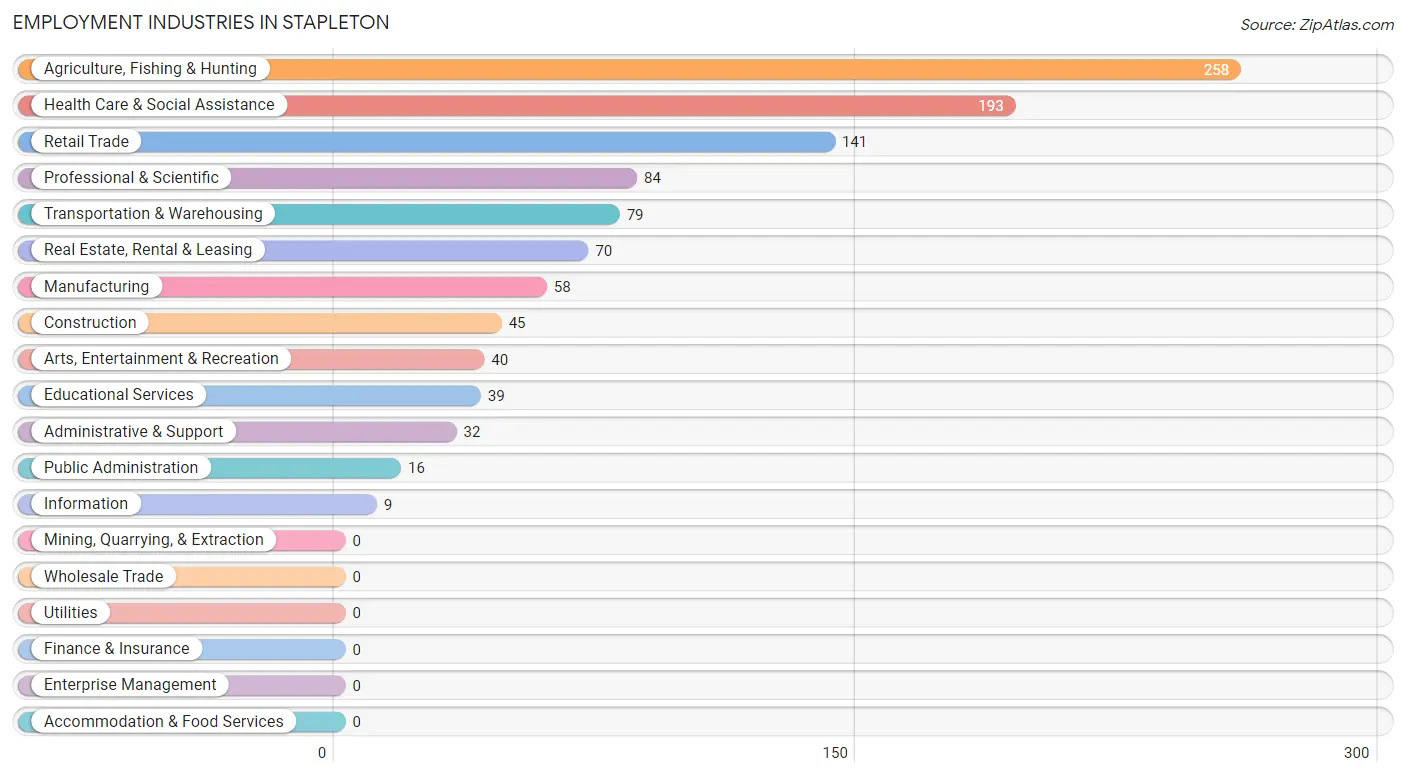
Employment Industries in Stapleton
The major employment industries in Stapleton include Agriculture, Fishing & Hunting (258 | 23.7%), Health Care & Social Assistance (193 | 17.7%), Retail Trade (141 | 13.0%), Professional & Scientific (84 | 7.7%), and Transportation & Warehousing (79 | 7.2%).
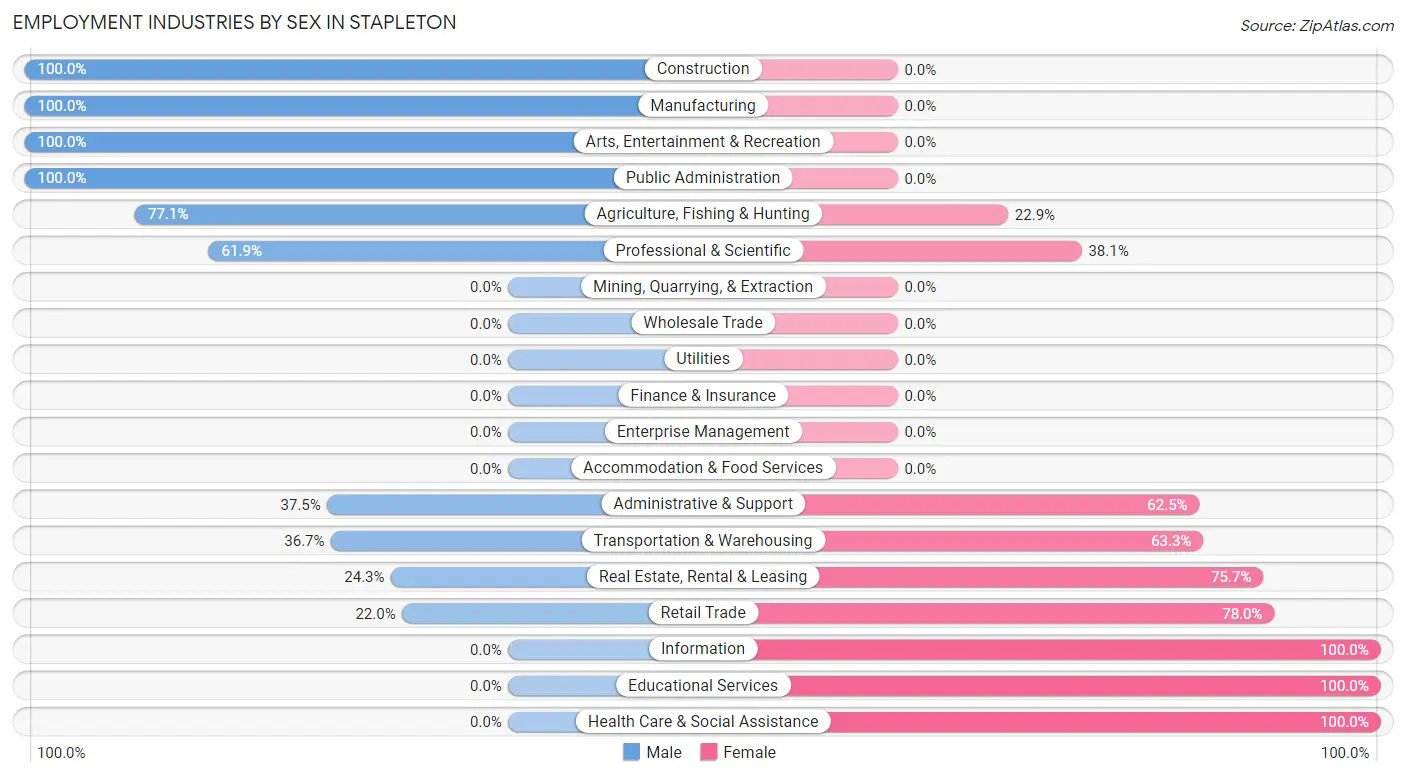
Employment Industries by Sex in Stapleton
The Stapleton industries that see more men than women are Construction (100.0%), Manufacturing (100.0%), and Arts, Entertainment & Recreation (100.0%), whereas the industries that tend to have a higher number of women are Information (100.0%), Educational Services (100.0%), and Health Care & Social Assistance (100.0%).
| Industry | Male | Female |
| Agriculture, Fishing & Hunting | 199 (77.1%) | 59 (22.9%) |
| Mining, Quarrying, & Extraction | 0 (0.0%) | 0 (0.0%) |
| Construction | 45 (100.0%) | 0 (0.0%) |
| Manufacturing | 58 (100.0%) | 0 (0.0%) |
| Wholesale Trade | 0 (0.0%) | 0 (0.0%) |
| Retail Trade | 31 (22.0%) | 110 (78.0%) |
| Transportation & Warehousing | 29 (36.7%) | 50 (63.3%) |
| Utilities | 0 (0.0%) | 0 (0.0%) |
| Information | 0 (0.0%) | 9 (100.0%) |
| Finance & Insurance | 0 (0.0%) | 0 (0.0%) |
| Real Estate, Rental & Leasing | 17 (24.3%) | 53 (75.7%) |
| Professional & Scientific | 52 (61.9%) | 32 (38.1%) |
| Enterprise Management | 0 (0.0%) | 0 (0.0%) |
| Administrative & Support | 12 (37.5%) | 20 (62.5%) |
| Educational Services | 0 (0.0%) | 39 (100.0%) |
| Health Care & Social Assistance | 0 (0.0%) | 193 (100.0%) |
| Arts, Entertainment & Recreation | 40 (100.0%) | 0 (0.0%) |
| Accommodation & Food Services | 0 (0.0%) | 0 (0.0%) |
| Public Administration | 16 (100.0%) | 0 (0.0%) |
| Total | 499 (45.8%) | 590 (54.2%) |
Education in Stapleton
School Enrollment in Stapleton
The most common levels of schooling among the 902 students in Stapleton are elementary school (458 | 50.8%), nursery / preschool (296 | 32.8%), and middle school (103 | 11.4%).
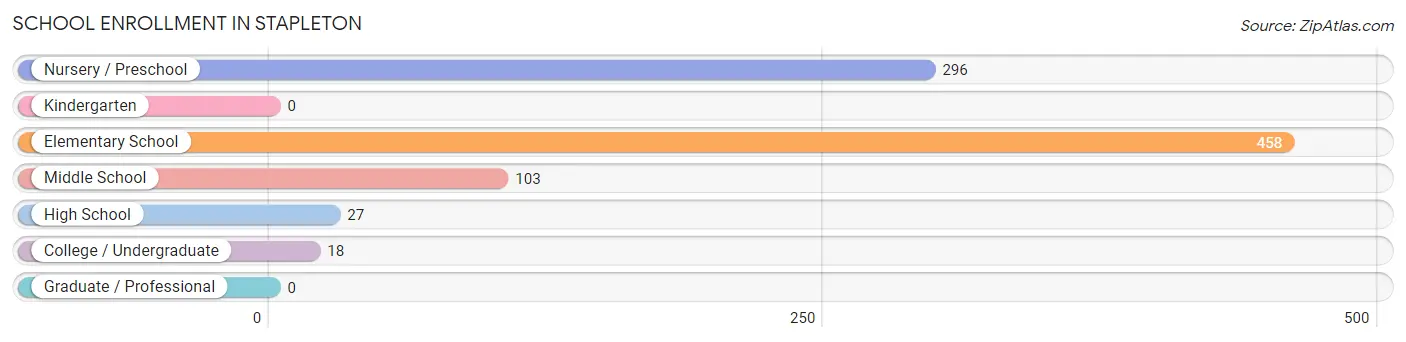
| School Level | # Students | % Students |
| Nursery / Preschool | 296 | 32.8% |
| Kindergarten | 0 | 0.0% |
| Elementary School | 458 | 50.8% |
| Middle School | 103 | 11.4% |
| High School | 27 | 3.0% |
| College / Undergraduate | 18 | 2.0% |
| Graduate / Professional | 0 | 0.0% |
| Total | 902 | 100.0% |
School Enrollment by Age by Funding Source in Stapleton
Out of a total of 902 students who are enrolled in schools in Stapleton, 122 (13.5%) attend a private institution, while the remaining 780 (86.5%) are enrolled in public schools. The age group of 5 to 9 year old has the highest likelihood of being enrolled in private schools, with 122 (43.7% in the age bracket) enrolled. Conversely, the age group of 3 to 4 year olds has the lowest likelihood of being enrolled in a private school, with 296 (100.0% in the age bracket) attending a public institution.
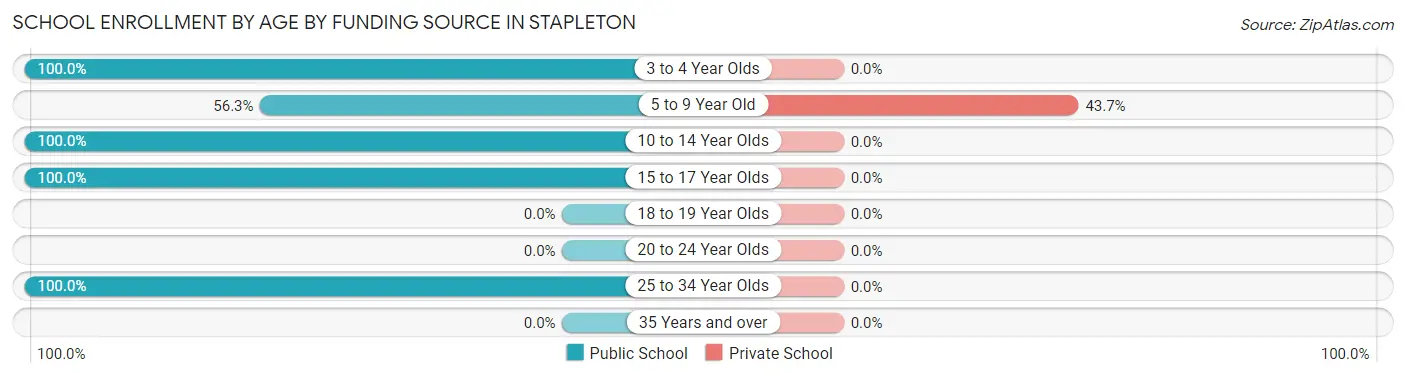
| Age Bracket | Public School | Private School |
| 3 to 4 Year Olds | 296 (100.0%) | 0 (0.0%) |
| 5 to 9 Year Old | 157 (56.3%) | 122 (43.7%) |
| 10 to 14 Year Olds | 295 (100.0%) | 0 (0.0%) |
| 15 to 17 Year Olds | 14 (100.0%) | 0 (0.0%) |
| 18 to 19 Year Olds | 0 (0.0%) | 0 (0.0%) |
| 20 to 24 Year Olds | 0 (0.0%) | 0 (0.0%) |
| 25 to 34 Year Olds | 18 (100.0%) | 0 (0.0%) |
| 35 Years and over | 0 (0.0%) | 0 (0.0%) |
| Total | 780 (86.5%) | 122 (13.5%) |
Educational Attainment by Field of Study in Stapleton
Business (269 | 60.5%), science & technology (57 | 12.8%), engineering (43 | 9.7%), arts & humanities (41 | 9.2%), and literature & languages (20 | 4.5%) are the most common fields of study among 445 individuals in Stapleton who have obtained a bachelor's degree or higher.
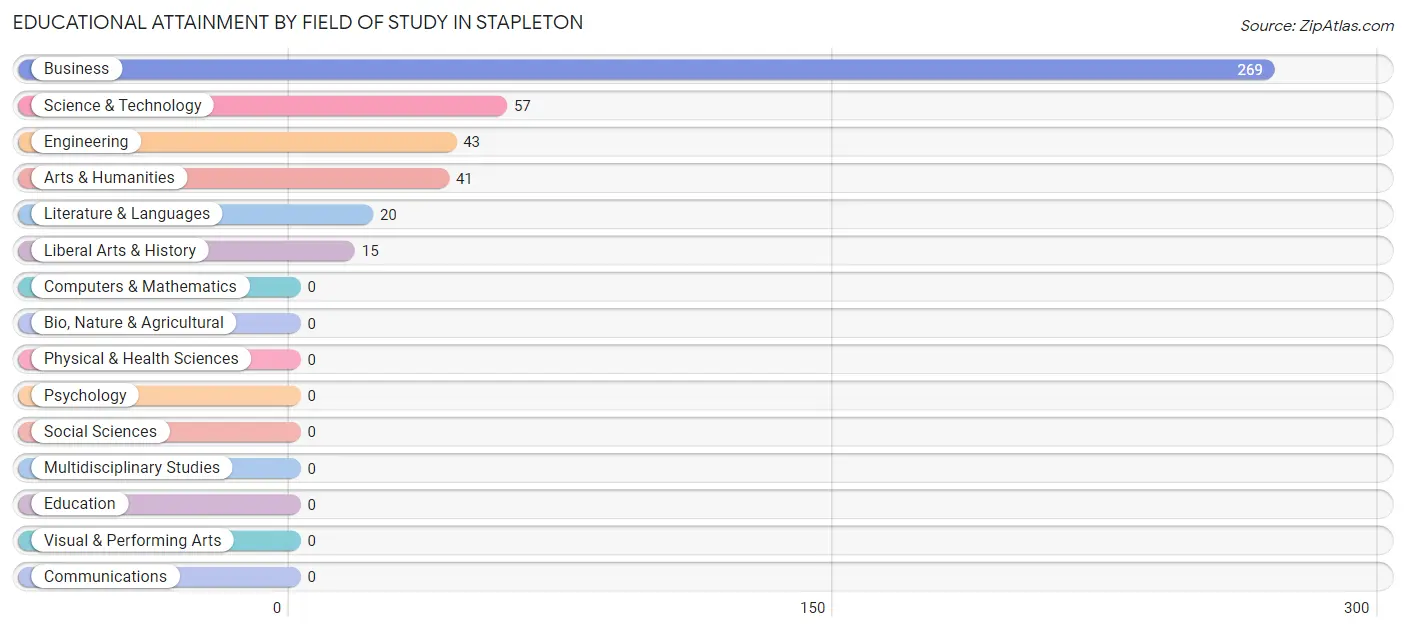
| Field of Study | # Graduates | % Graduates |
| Computers & Mathematics | 0 | 0.0% |
| Bio, Nature & Agricultural | 0 | 0.0% |
| Physical & Health Sciences | 0 | 0.0% |
| Psychology | 0 | 0.0% |
| Social Sciences | 0 | 0.0% |
| Engineering | 43 | 9.7% |
| Multidisciplinary Studies | 0 | 0.0% |
| Science & Technology | 57 | 12.8% |
| Business | 269 | 60.5% |
| Education | 0 | 0.0% |
| Literature & Languages | 20 | 4.5% |
| Liberal Arts & History | 15 | 3.4% |
| Visual & Performing Arts | 0 | 0.0% |
| Communications | 0 | 0.0% |
| Arts & Humanities | 41 | 9.2% |
| Total | 445 | 100.0% |
Transportation & Commute in Stapleton
Vehicle Availability by Sex in Stapleton
The most prevalent vehicle ownership categories in Stapleton are males with 2 vehicles (340, accounting for 68.1%) and females with 2 vehicles (494, making up 57.6%).
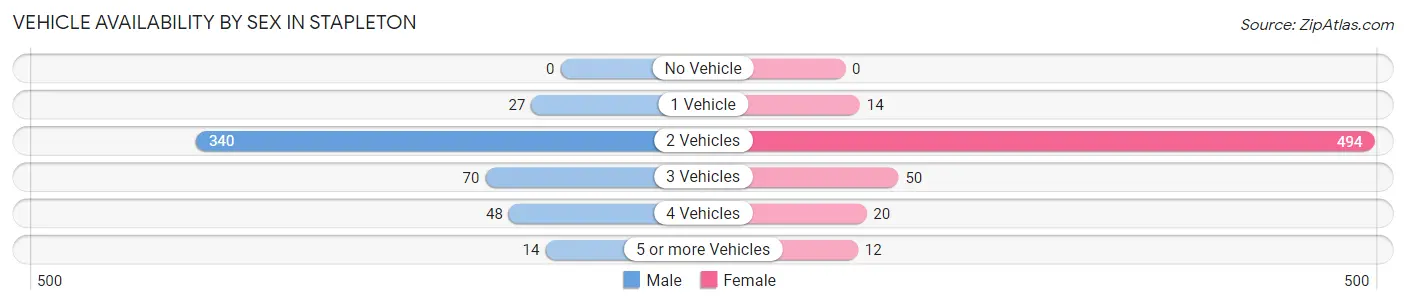
| Vehicles Available | Male | Female |
| No Vehicle | 0 (0.0%) | 0 (0.0%) |
| 1 Vehicle | 27 (5.4%) | 14 (2.4%) |
| 2 Vehicles | 340 (68.1%) | 494 (83.7%) |
| 3 Vehicles | 70 (14.0%) | 50 (8.5%) |
| 4 Vehicles | 48 (9.6%) | 20 (3.4%) |
| 5 or more Vehicles | 14 (2.8%) | 12 (2.0%) |
| Total | 499 (100.0%) | 590 (100.0%) |
Commute Time in Stapleton
The most frequently occuring commute durations in Stapleton are 25 to 29 minutes (217 commuters, 21.8%), 60 to 89 minutes (190 commuters, 19.1%), and 10 to 14 minutes (169 commuters, 17.0%).
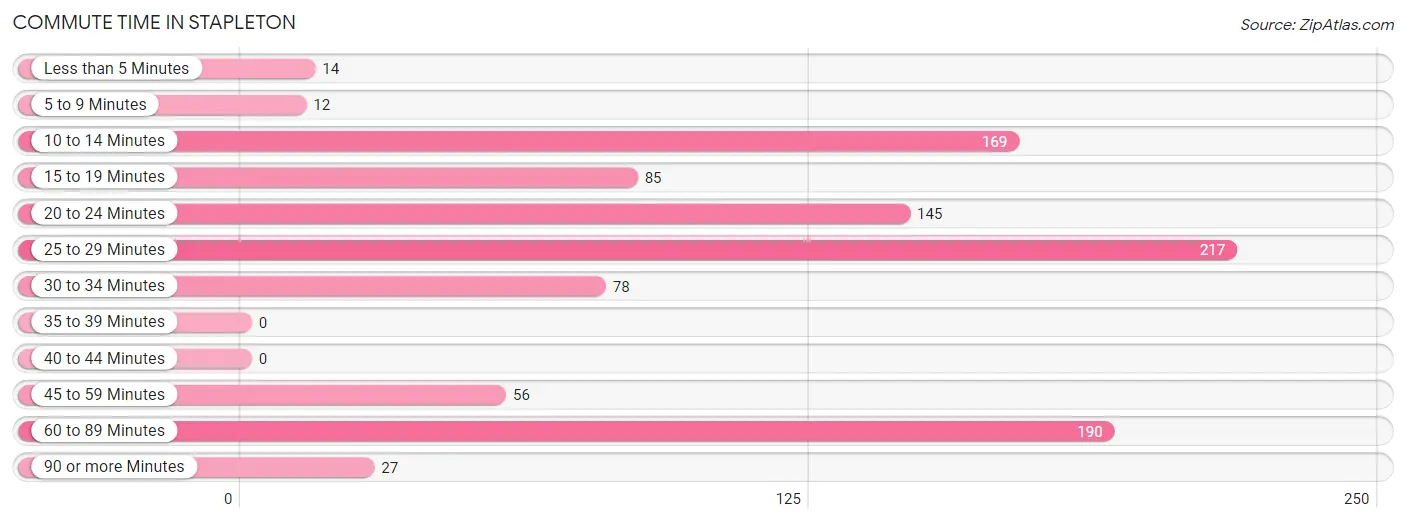
| Commute Time | # Commuters | % Commuters |
| Less than 5 Minutes | 14 | 1.4% |
| 5 to 9 Minutes | 12 | 1.2% |
| 10 to 14 Minutes | 169 | 17.0% |
| 15 to 19 Minutes | 85 | 8.6% |
| 20 to 24 Minutes | 145 | 14.6% |
| 25 to 29 Minutes | 217 | 21.8% |
| 30 to 34 Minutes | 78 | 7.9% |
| 35 to 39 Minutes | 0 | 0.0% |
| 40 to 44 Minutes | 0 | 0.0% |
| 45 to 59 Minutes | 56 | 5.6% |
| 60 to 89 Minutes | 190 | 19.1% |
| 90 or more Minutes | 27 | 2.7% |
Commute Time by Sex in Stapleton
The most common commute times in Stapleton are 25 to 29 minutes (217 commuters, 47.0%) for males and 10 to 14 minutes (169 commuters, 31.8%) for females.
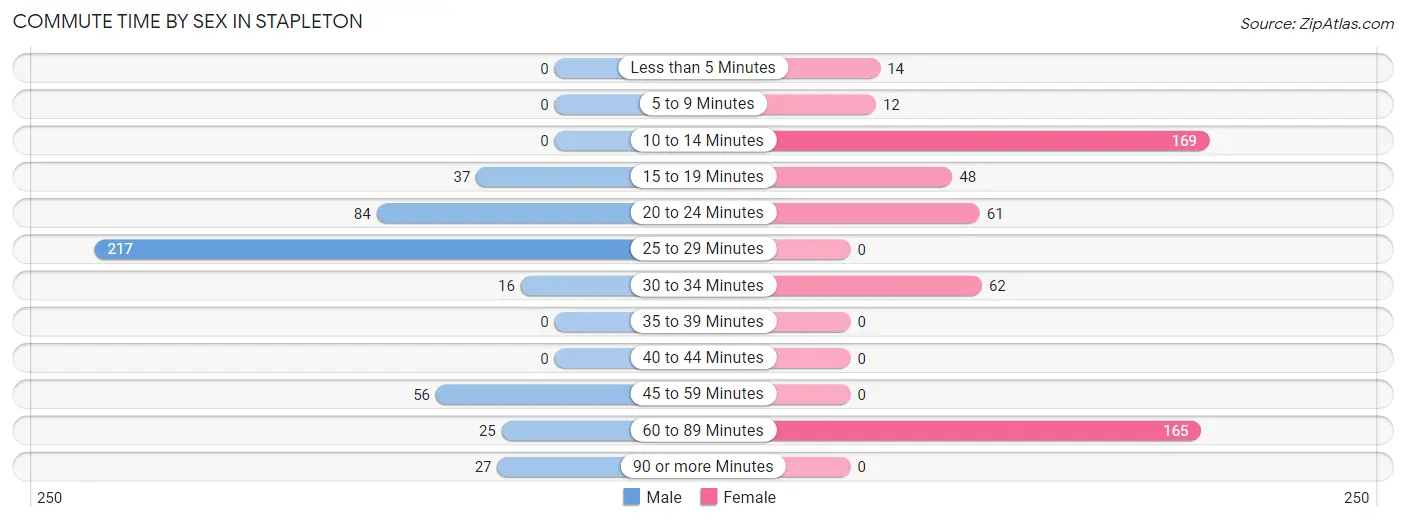
| Commute Time | Male | Female |
| Less than 5 Minutes | 0 (0.0%) | 14 (2.6%) |
| 5 to 9 Minutes | 0 (0.0%) | 12 (2.3%) |
| 10 to 14 Minutes | 0 (0.0%) | 169 (31.8%) |
| 15 to 19 Minutes | 37 (8.0%) | 48 (9.0%) |
| 20 to 24 Minutes | 84 (18.2%) | 61 (11.5%) |
| 25 to 29 Minutes | 217 (47.0%) | 0 (0.0%) |
| 30 to 34 Minutes | 16 (3.5%) | 62 (11.7%) |
| 35 to 39 Minutes | 0 (0.0%) | 0 (0.0%) |
| 40 to 44 Minutes | 0 (0.0%) | 0 (0.0%) |
| 45 to 59 Minutes | 56 (12.1%) | 0 (0.0%) |
| 60 to 89 Minutes | 25 (5.4%) | 165 (31.1%) |
| 90 or more Minutes | 27 (5.8%) | 0 (0.0%) |
Time of Departure to Work by Sex in Stapleton
The most frequent times of departure to work in Stapleton are 7:00 AM to 7:29 AM (228, 49.3%) for males and 7:00 AM to 7:29 AM (211, 39.7%) for females.
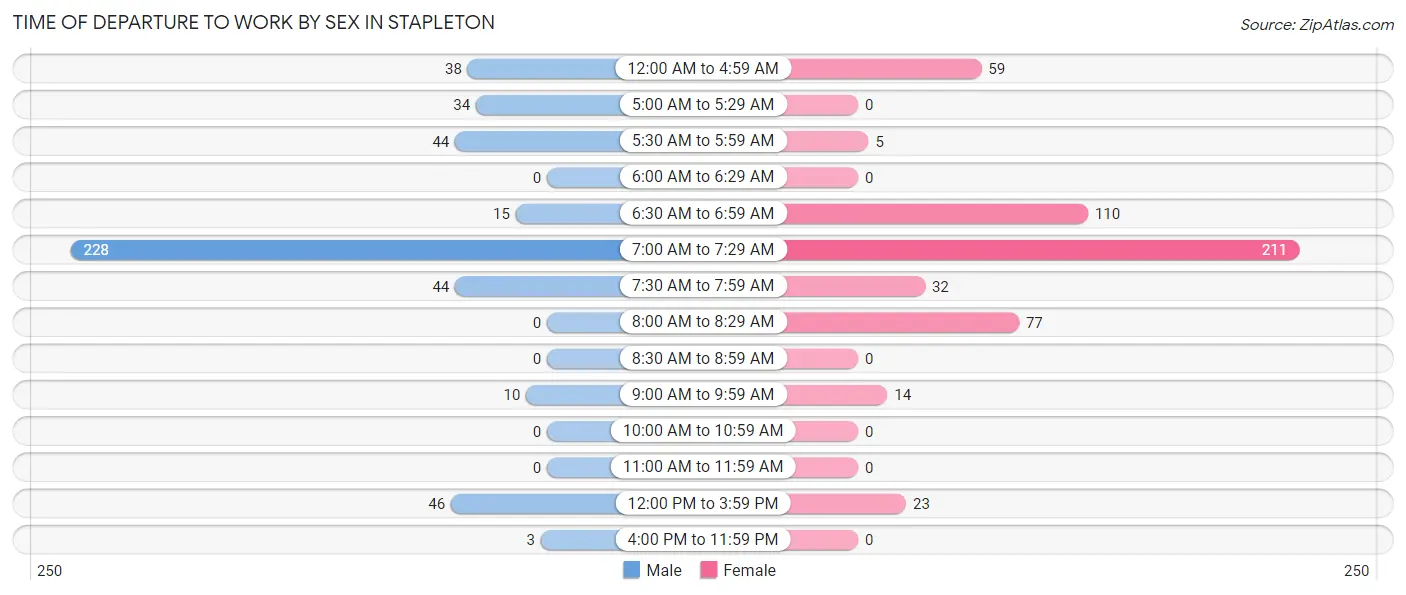
| Time of Departure | Male | Female |
| 12:00 AM to 4:59 AM | 38 (8.2%) | 59 (11.1%) |
| 5:00 AM to 5:29 AM | 34 (7.4%) | 0 (0.0%) |
| 5:30 AM to 5:59 AM | 44 (9.5%) | 5 (0.9%) |
| 6:00 AM to 6:29 AM | 0 (0.0%) | 0 (0.0%) |
| 6:30 AM to 6:59 AM | 15 (3.3%) | 110 (20.7%) |
| 7:00 AM to 7:29 AM | 228 (49.3%) | 211 (39.7%) |
| 7:30 AM to 7:59 AM | 44 (9.5%) | 32 (6.0%) |
| 8:00 AM to 8:29 AM | 0 (0.0%) | 77 (14.5%) |
| 8:30 AM to 8:59 AM | 0 (0.0%) | 0 (0.0%) |
| 9:00 AM to 9:59 AM | 10 (2.2%) | 14 (2.6%) |
| 10:00 AM to 10:59 AM | 0 (0.0%) | 0 (0.0%) |
| 11:00 AM to 11:59 AM | 0 (0.0%) | 0 (0.0%) |
| 12:00 PM to 3:59 PM | 46 (10.0%) | 23 (4.3%) |
| 4:00 PM to 11:59 PM | 3 (0.6%) | 0 (0.0%) |
| Total | 462 (100.0%) | 531 (100.0%) |
Housing Occupancy in Stapleton
Occupancy by Ownership in Stapleton
Of the total 666 dwellings in Stapleton, owner-occupied units account for 666 (100.0%), while renter-occupied units make up 0 (0.0%).
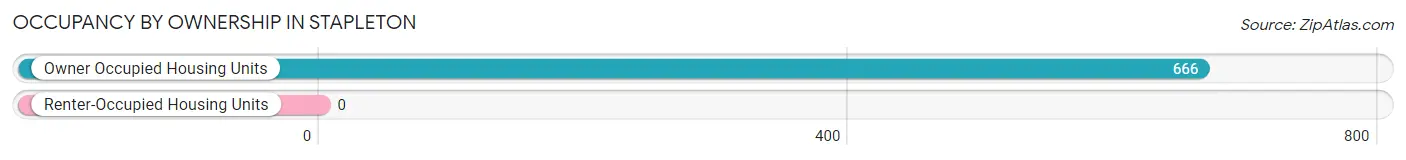
| Occupancy | # Housing Units | % Housing Units |
| Owner Occupied Housing Units | 666 | 100.0% |
| Renter-Occupied Housing Units | 0 | 0.0% |
| Total Occupied Housing Units | 666 | 100.0% |
Occupancy by Household Size in Stapleton
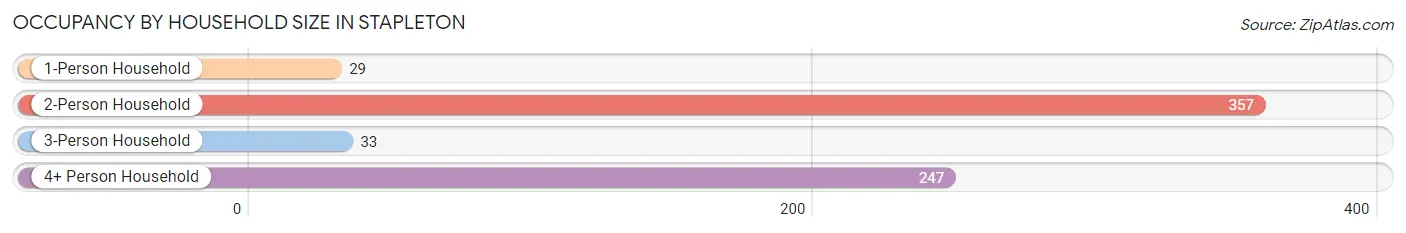
| Household Size | # Housing Units | % Housing Units |
| 1-Person Household | 29 | 4.3% |
| 2-Person Household | 357 | 53.6% |
| 3-Person Household | 33 | 5.0% |
| 4+ Person Household | 247 | 37.1% |
| Total Housing Units | 666 | 100.0% |
Occupancy by Ownership by Household Size in Stapleton
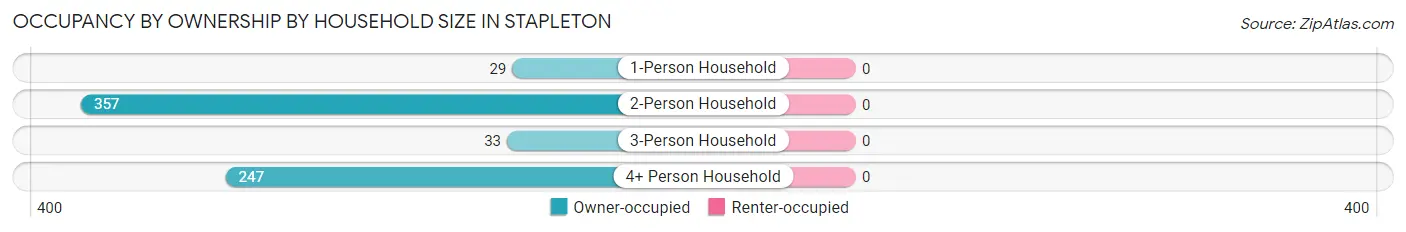
| Household Size | Owner-occupied | Renter-occupied |
| 1-Person Household | 29 (100.0%) | 0 (0.0%) |
| 2-Person Household | 357 (100.0%) | 0 (0.0%) |
| 3-Person Household | 33 (100.0%) | 0 (0.0%) |
| 4+ Person Household | 247 (100.0%) | 0 (0.0%) |
| Total Housing Units | 666 (100.0%) | 0 (0.0%) |
Occupancy by Educational Attainment in Stapleton
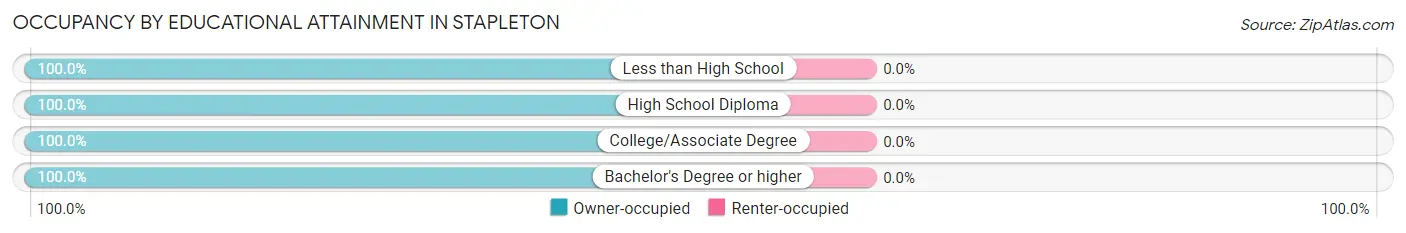
| Household Size | Owner-occupied | Renter-occupied |
| Less than High School | 7 (100.0%) | 0 (0.0%) |
| High School Diploma | 222 (100.0%) | 0 (0.0%) |
| College/Associate Degree | 107 (100.0%) | 0 (0.0%) |
| Bachelor's Degree or higher | 330 (100.0%) | 0 (0.0%) |
Occupancy by Age of Householder in Stapleton
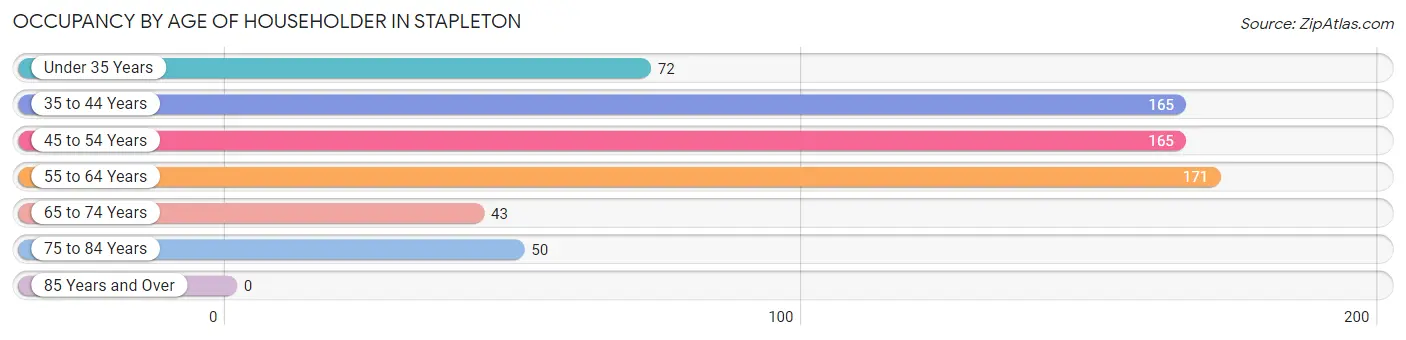
| Age Bracket | # Households | % Households |
| Under 35 Years | 72 | 10.8% |
| 35 to 44 Years | 165 | 24.8% |
| 45 to 54 Years | 165 | 24.8% |
| 55 to 64 Years | 171 | 25.7% |
| 65 to 74 Years | 43 | 6.5% |
| 75 to 84 Years | 50 | 7.5% |
| 85 Years and Over | 0 | 0.0% |
| Total | 666 | 100.0% |
Housing Finances in Stapleton
Median Income by Occupancy in Stapleton
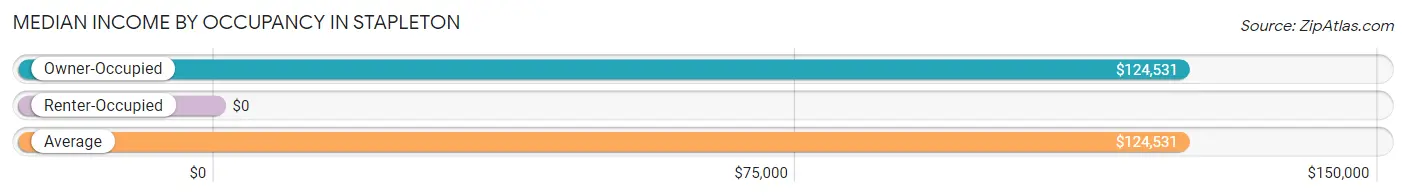
| Occupancy Type | # Households | Median Income |
| Owner-Occupied | 666 (100.0%) | $124,531 |
| Renter-Occupied | 0 (0.0%) | $0 |
| Average | 666 (100.0%) | $124,531 |
Occupancy by Householder Income Bracket in Stapleton
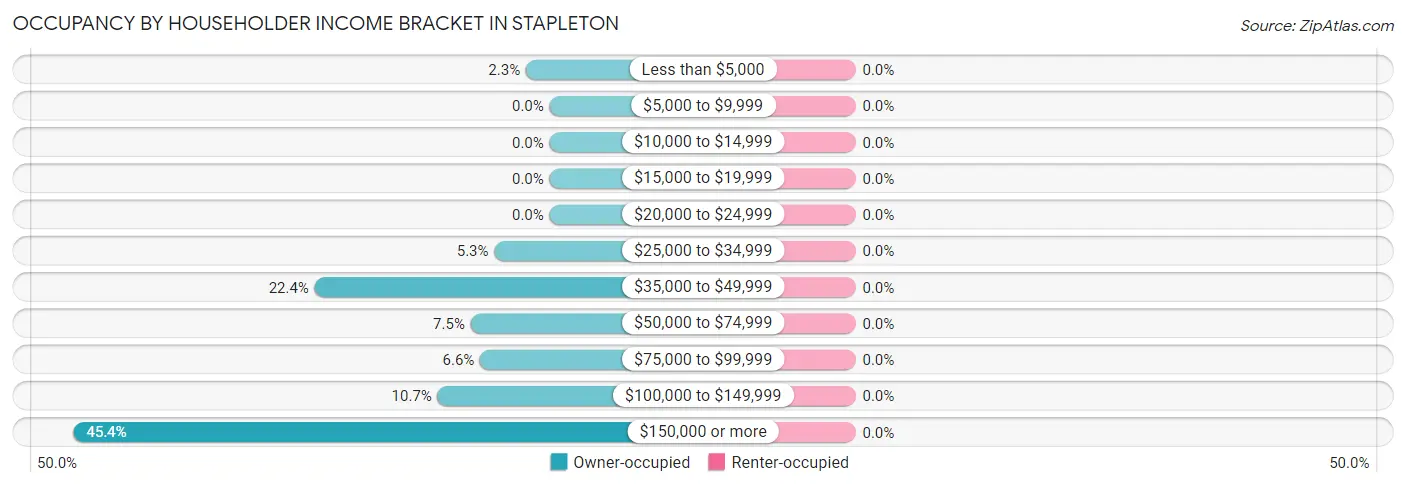
| Income Bracket | Owner-occupied | Renter-occupied |
| Less than $5,000 | 15 (2.2%) | 0 (0.0%) |
| $5,000 to $9,999 | 0 (0.0%) | 0 (0.0%) |
| $10,000 to $14,999 | 0 (0.0%) | 0 (0.0%) |
| $15,000 to $19,999 | 0 (0.0%) | 0 (0.0%) |
| $20,000 to $24,999 | 0 (0.0%) | 0 (0.0%) |
| $25,000 to $34,999 | 35 (5.3%) | 0 (0.0%) |
| $35,000 to $49,999 | 149 (22.4%) | 0 (0.0%) |
| $50,000 to $74,999 | 50 (7.5%) | 0 (0.0%) |
| $75,000 to $99,999 | 44 (6.6%) | 0 (0.0%) |
| $100,000 to $149,999 | 71 (10.7%) | 0 (0.0%) |
| $150,000 or more | 302 (45.4%) | 0 (0.0%) |
| Total | 666 (100.0%) | 0 (0.0%) |
Monthly Housing Cost Tiers in Stapleton
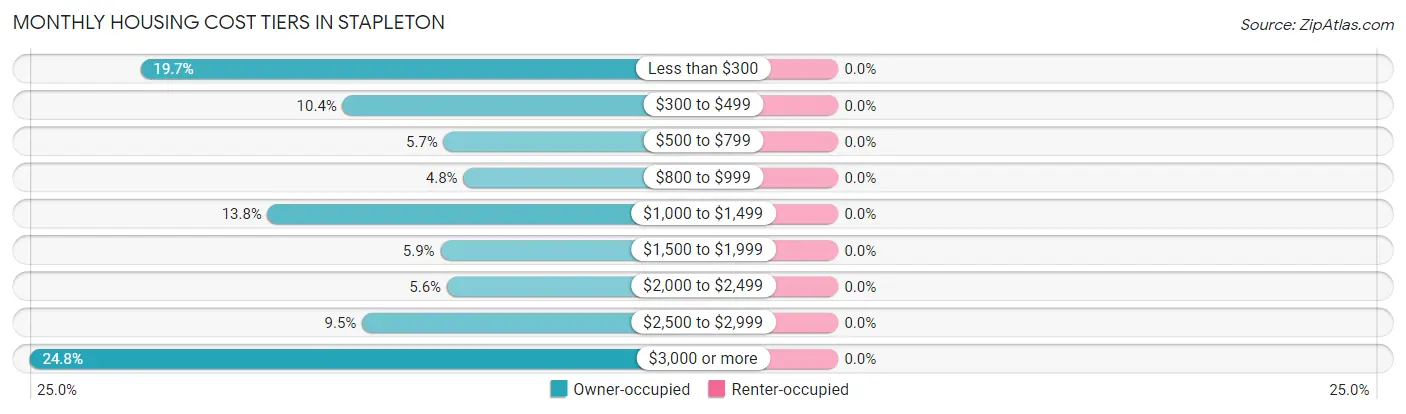
| Monthly Cost | Owner-occupied | Renter-occupied |
| Less than $300 | 131 (19.7%) | 0 (0.0%) |
| $300 to $499 | 69 (10.4%) | 0 (0.0%) |
| $500 to $799 | 38 (5.7%) | 0 (0.0%) |
| $800 to $999 | 32 (4.8%) | 0 (0.0%) |
| $1,000 to $1,499 | 92 (13.8%) | 0 (0.0%) |
| $1,500 to $1,999 | 39 (5.9%) | 0 (0.0%) |
| $2,000 to $2,499 | 37 (5.6%) | 0 (0.0%) |
| $2,500 to $2,999 | 63 (9.5%) | 0 (0.0%) |
| $3,000 or more | 165 (24.8%) | 0 (0.0%) |
| Total | 666 (100.0%) | 0 (0.0%) |
Physical Housing Characteristics in Stapleton
Housing Structures in Stapleton
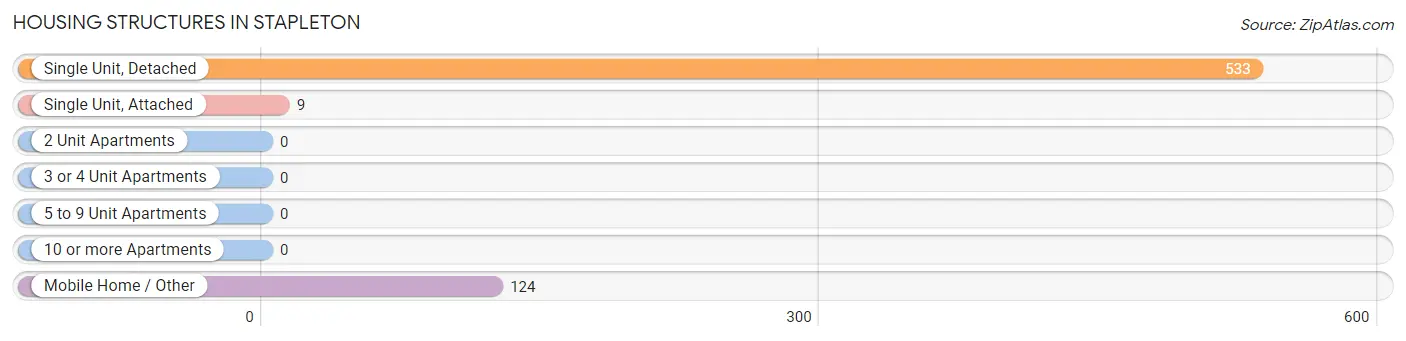
| Structure Type | # Housing Units | % Housing Units |
| Single Unit, Detached | 533 | 80.0% |
| Single Unit, Attached | 9 | 1.3% |
| 2 Unit Apartments | 0 | 0.0% |
| 3 or 4 Unit Apartments | 0 | 0.0% |
| 5 to 9 Unit Apartments | 0 | 0.0% |
| 10 or more Apartments | 0 | 0.0% |
| Mobile Home / Other | 124 | 18.6% |
| Total | 666 | 100.0% |
Housing Structures by Occupancy in Stapleton
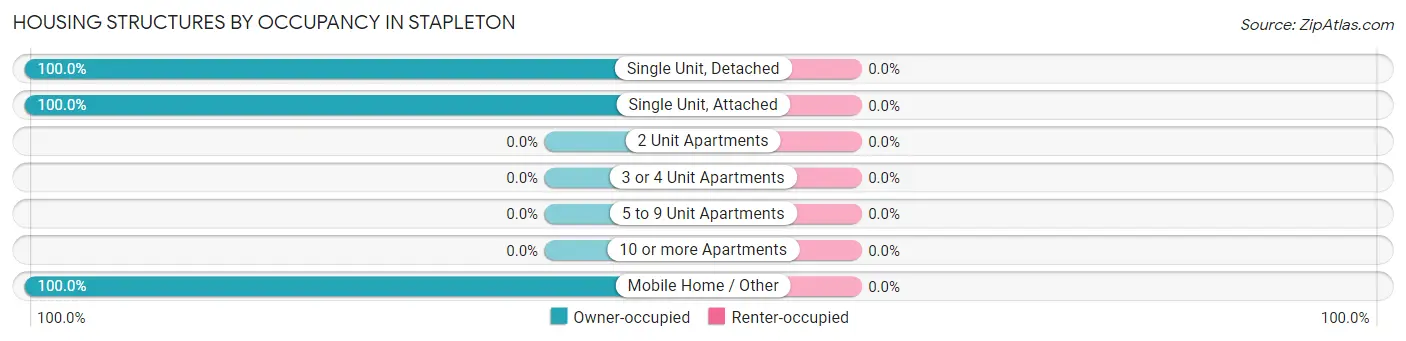
| Structure Type | Owner-occupied | Renter-occupied |
| Single Unit, Detached | 533 (100.0%) | 0 (0.0%) |
| Single Unit, Attached | 9 (100.0%) | 0 (0.0%) |
| 2 Unit Apartments | 0 (0.0%) | 0 (0.0%) |
| 3 or 4 Unit Apartments | 0 (0.0%) | 0 (0.0%) |
| 5 to 9 Unit Apartments | 0 (0.0%) | 0 (0.0%) |
| 10 or more Apartments | 0 (0.0%) | 0 (0.0%) |
| Mobile Home / Other | 124 (100.0%) | 0 (0.0%) |
| Total | 666 (100.0%) | 0 (0.0%) |
Housing Structures by Number of Rooms in Stapleton
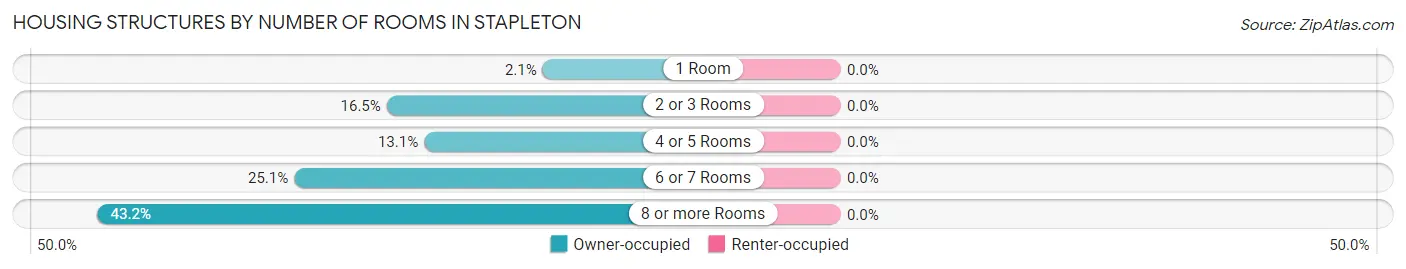
| Number of Rooms | Owner-occupied | Renter-occupied |
| 1 Room | 14 (2.1%) | 0 (0.0%) |
| 2 or 3 Rooms | 110 (16.5%) | 0 (0.0%) |
| 4 or 5 Rooms | 87 (13.1%) | 0 (0.0%) |
| 6 or 7 Rooms | 167 (25.1%) | 0 (0.0%) |
| 8 or more Rooms | 288 (43.2%) | 0 (0.0%) |
| Total | 666 (100.0%) | 0 (0.0%) |
Housing Structure by Heating Type in Stapleton
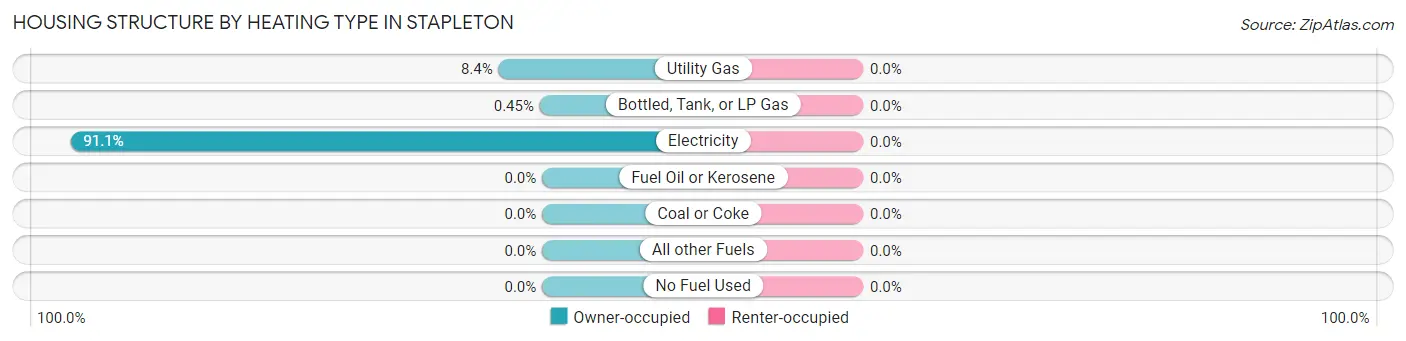
| Heating Type | Owner-occupied | Renter-occupied |
| Utility Gas | 56 (8.4%) | 0 (0.0%) |
| Bottled, Tank, or LP Gas | 3 (0.4%) | 0 (0.0%) |
| Electricity | 607 (91.1%) | 0 (0.0%) |
| Fuel Oil or Kerosene | 0 (0.0%) | 0 (0.0%) |
| Coal or Coke | 0 (0.0%) | 0 (0.0%) |
| All other Fuels | 0 (0.0%) | 0 (0.0%) |
| No Fuel Used | 0 (0.0%) | 0 (0.0%) |
| Total | 666 (100.0%) | 0 (0.0%) |
Household Vehicle Usage in Stapleton
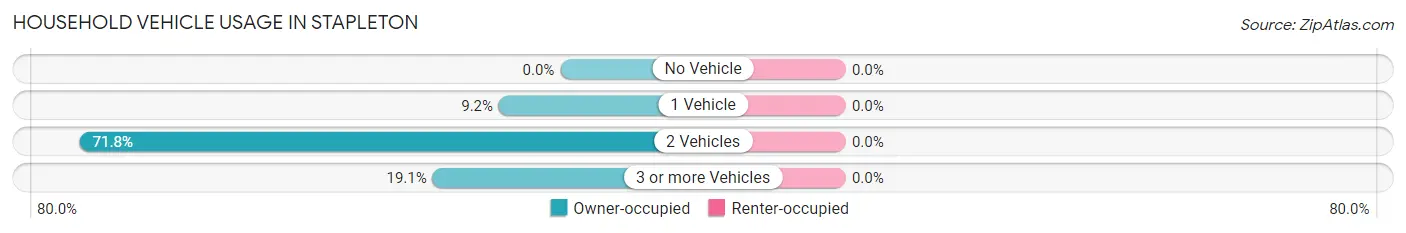
| Vehicles per Household | Owner-occupied | Renter-occupied |
| No Vehicle | 0 (0.0%) | 0 (0.0%) |
| 1 Vehicle | 61 (9.2%) | 0 (0.0%) |
| 2 Vehicles | 478 (71.8%) | 0 (0.0%) |
| 3 or more Vehicles | 127 (19.1%) | 0 (0.0%) |
| Total | 666 (100.0%) | 0 (0.0%) |
Real Estate & Mortgages in Stapleton
Real Estate and Mortgage Overview in Stapleton
| Characteristic | Without Mortgage | With Mortgage |
| Housing Units | 200 | 466 |
| Median Property Value | $9,999 | $576,500 |
| Median Household Income | $43,850 | $290 |
| Monthly Housing Costs | - | - |
| Real Estate Taxes | $528 | $18 |
Property Value by Mortgage Status in Stapleton
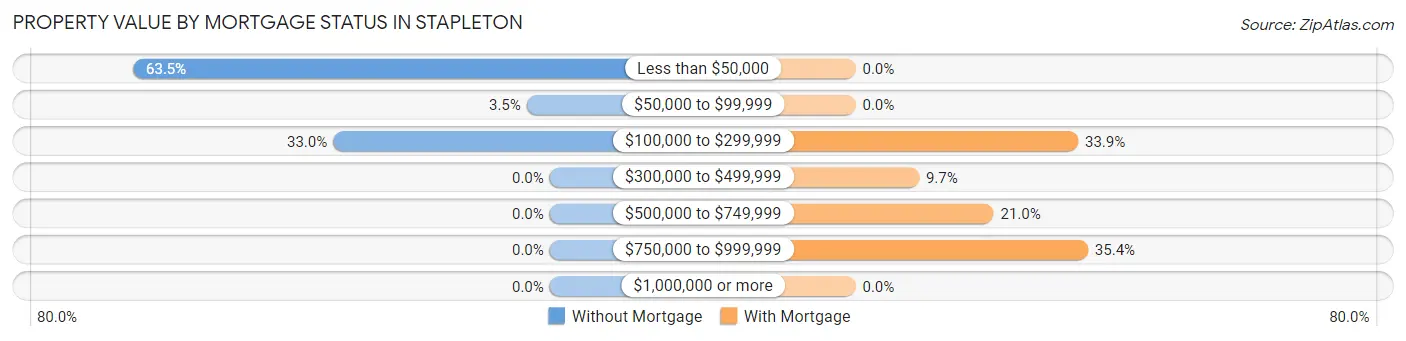
| Property Value | Without Mortgage | With Mortgage |
| Less than $50,000 | 127 (63.5%) | 0 (0.0%) |
| $50,000 to $99,999 | 7 (3.5%) | 0 (0.0%) |
| $100,000 to $299,999 | 66 (33.0%) | 158 (33.9%) |
| $300,000 to $499,999 | 0 (0.0%) | 45 (9.7%) |
| $500,000 to $749,999 | 0 (0.0%) | 98 (21.0%) |
| $750,000 to $999,999 | 0 (0.0%) | 165 (35.4%) |
| $1,000,000 or more | 0 (0.0%) | 0 (0.0%) |
| Total | 200 (100.0%) | 466 (100.0%) |
Household Income by Mortgage Status in Stapleton
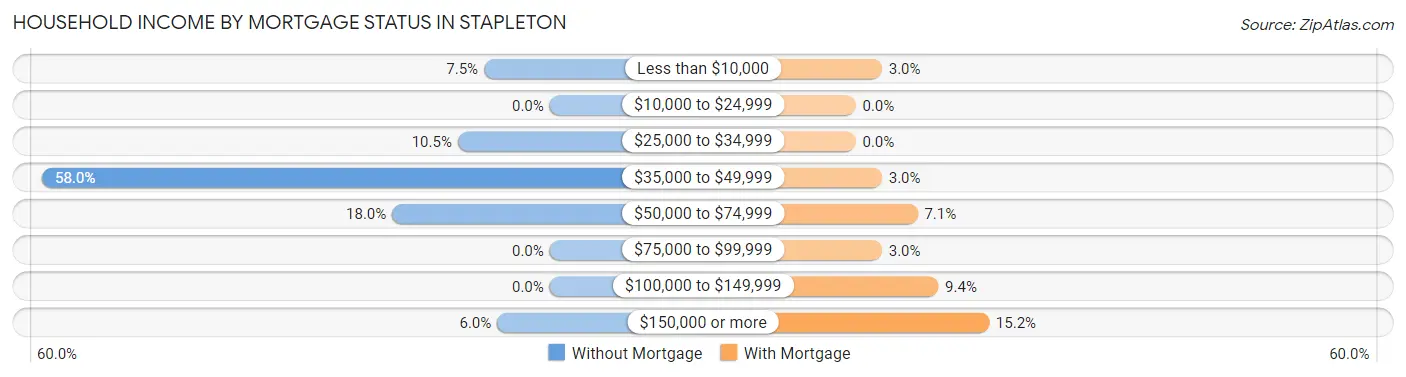
| Household Income | Without Mortgage | With Mortgage |
| Less than $10,000 | 15 (7.5%) | 14 (3.0%) |
| $10,000 to $24,999 | 0 (0.0%) | 0 (0.0%) |
| $25,000 to $34,999 | 21 (10.5%) | 0 (0.0%) |
| $35,000 to $49,999 | 116 (58.0%) | 14 (3.0%) |
| $50,000 to $74,999 | 36 (18.0%) | 33 (7.1%) |
| $75,000 to $99,999 | 0 (0.0%) | 14 (3.0%) |
| $100,000 to $149,999 | 0 (0.0%) | 44 (9.4%) |
| $150,000 or more | 12 (6.0%) | 71 (15.2%) |
| Total | 200 (100.0%) | 466 (100.0%) |
Property Value to Household Income Ratio in Stapleton
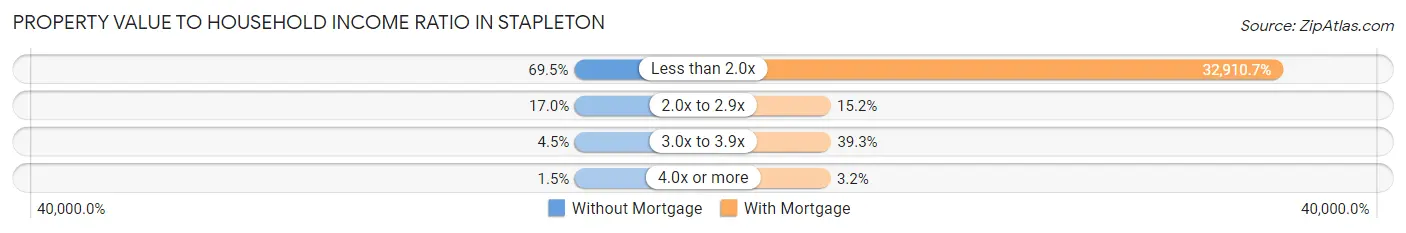
| Value-to-Income Ratio | Without Mortgage | With Mortgage |
| Less than 2.0x | 139 (69.5%) | 153,364 (32,910.7%) |
| 2.0x to 2.9x | 34 (17.0%) | 71 (15.2%) |
| 3.0x to 3.9x | 9 (4.5%) | 183 (39.3%) |
| 4.0x or more | 3 (1.5%) | 15 (3.2%) |
| Total | 200 (100.0%) | 466 (100.0%) |
Real Estate Taxes by Mortgage Status in Stapleton
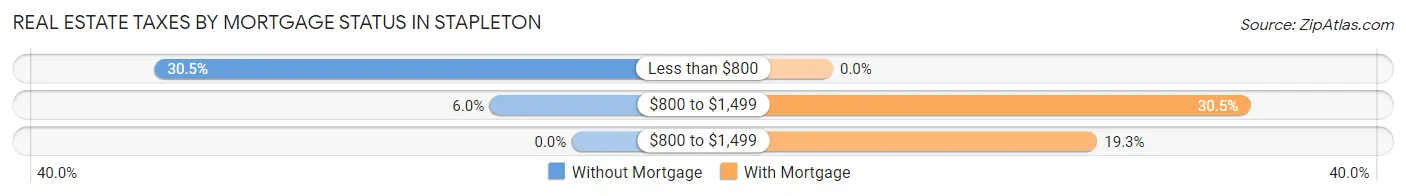
| Property Taxes | Without Mortgage | With Mortgage |
| Less than $800 | 61 (30.5%) | 0 (0.0%) |
| $800 to $1,499 | 12 (6.0%) | 142 (30.5%) |
| $800 to $1,499 | 0 (0.0%) | 90 (19.3%) |
| Total | 200 (100.0%) | 466 (100.0%) |
Health & Disability in Stapleton
Health Insurance Coverage by Age in Stapleton
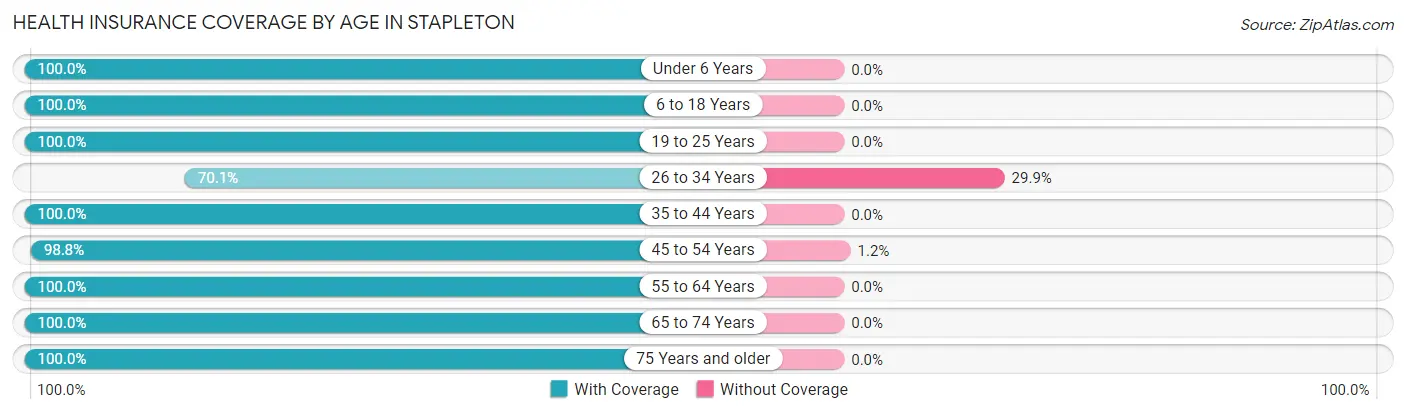
| Age Bracket | With Coverage | Without Coverage |
| Under 6 Years | 348 (100.0%) | 0 (0.0%) |
| 6 to 18 Years | 588 (100.0%) | 0 (0.0%) |
| 19 to 25 Years | 28 (100.0%) | 0 (0.0%) |
| 26 to 34 Years | 143 (70.1%) | 61 (29.9%) |
| 35 to 44 Years | 364 (100.0%) | 0 (0.0%) |
| 45 to 54 Years | 254 (98.8%) | 3 (1.2%) |
| 55 to 64 Years | 430 (100.0%) | 0 (0.0%) |
| 65 to 74 Years | 95 (100.0%) | 0 (0.0%) |
| 75 Years and older | 78 (100.0%) | 0 (0.0%) |
| Total | 2,328 (97.3%) | 64 (2.7%) |
Health Insurance Coverage by Citizenship Status in Stapleton
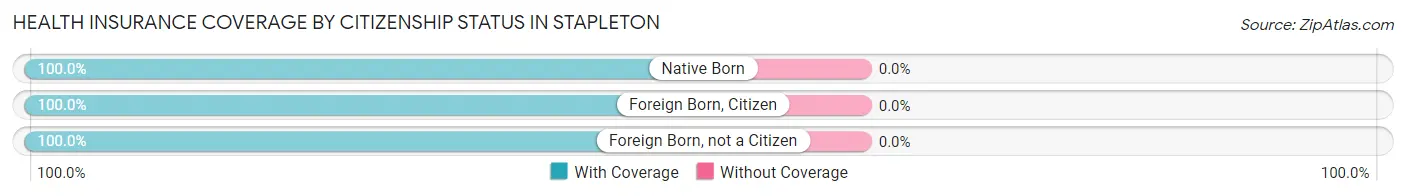
| Citizenship Status | With Coverage | Without Coverage |
| Native Born | 348 (100.0%) | 0 (0.0%) |
| Foreign Born, Citizen | 588 (100.0%) | 0 (0.0%) |
| Foreign Born, not a Citizen | 28 (100.0%) | 0 (0.0%) |
Health Insurance Coverage by Household Income in Stapleton
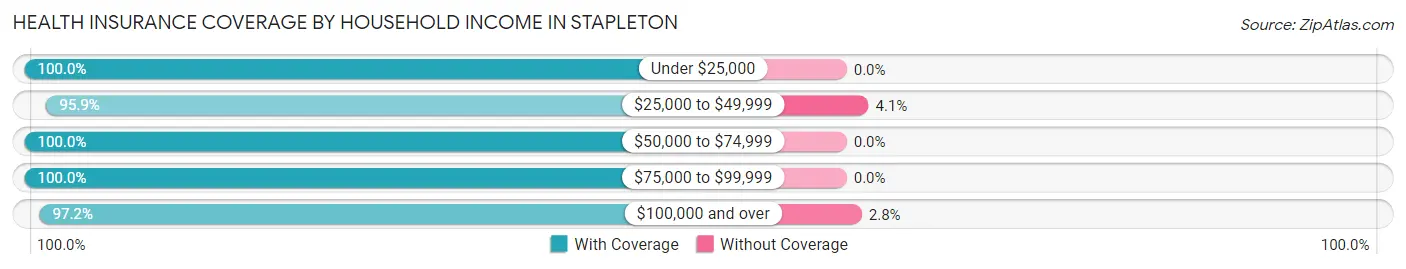
| Household Income | With Coverage | Without Coverage |
| Under $25,000 | 30 (100.0%) | 0 (0.0%) |
| $25,000 to $49,999 | 399 (95.9%) | 17 (4.1%) |
| $50,000 to $74,999 | 156 (100.0%) | 0 (0.0%) |
| $75,000 to $99,999 | 126 (100.0%) | 0 (0.0%) |
| $100,000 and over | 1,617 (97.2%) | 47 (2.8%) |
Public vs Private Health Insurance Coverage by Age in Stapleton
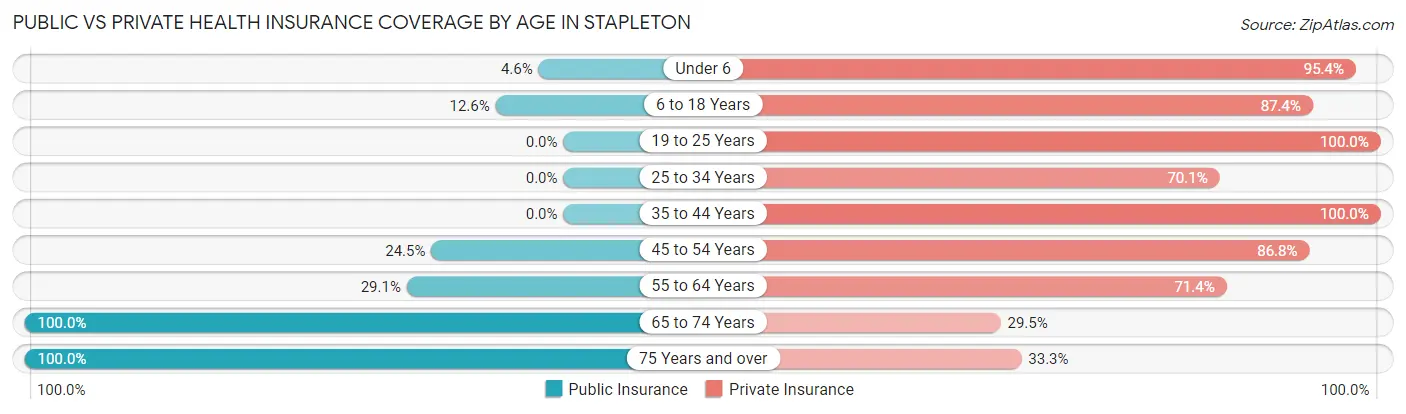
| Age Bracket | Public Insurance | Private Insurance |
| Under 6 | 16 (4.6%) | 332 (95.4%) |
| 6 to 18 Years | 74 (12.6%) | 514 (87.4%) |
| 19 to 25 Years | 0 (0.0%) | 28 (100.0%) |
| 25 to 34 Years | 0 (0.0%) | 143 (70.1%) |
| 35 to 44 Years | 0 (0.0%) | 364 (100.0%) |
| 45 to 54 Years | 63 (24.5%) | 223 (86.8%) |
| 55 to 64 Years | 125 (29.1%) | 307 (71.4%) |
| 65 to 74 Years | 95 (100.0%) | 28 (29.5%) |
| 75 Years and over | 78 (100.0%) | 26 (33.3%) |
| Total | 451 (18.9%) | 1,965 (82.2%) |
Disability Status by Sex by Age in Stapleton
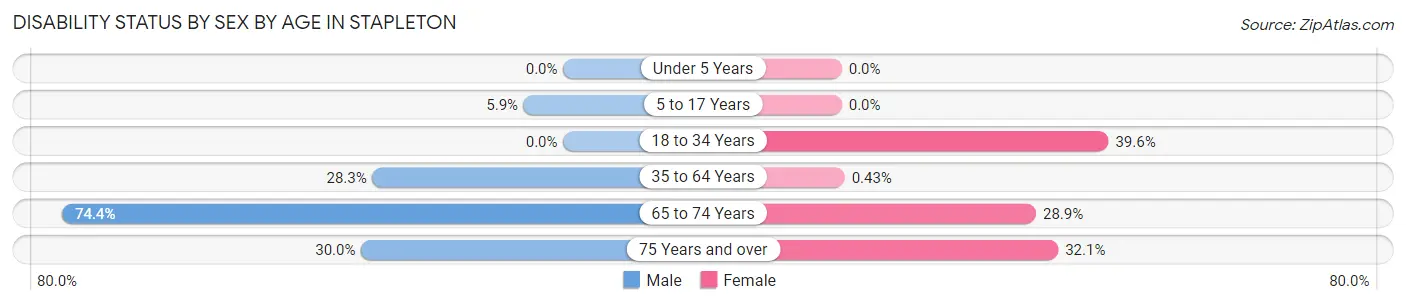
| Age Bracket | Male | Female |
| Under 5 Years | 0 (0.0%) | 0 (0.0%) |
| 5 to 17 Years | 12 (5.9%) | 0 (0.0%) |
| 18 to 34 Years | 0 (0.0%) | 59 (39.6%) |
| 35 to 64 Years | 166 (28.3%) | 2 (0.4%) |
| 65 to 74 Years | 32 (74.4%) | 15 (28.8%) |
| 75 Years and over | 15 (30.0%) | 9 (32.1%) |
Disability Class by Sex by Age in Stapleton
Disability Class: Hearing Difficulty
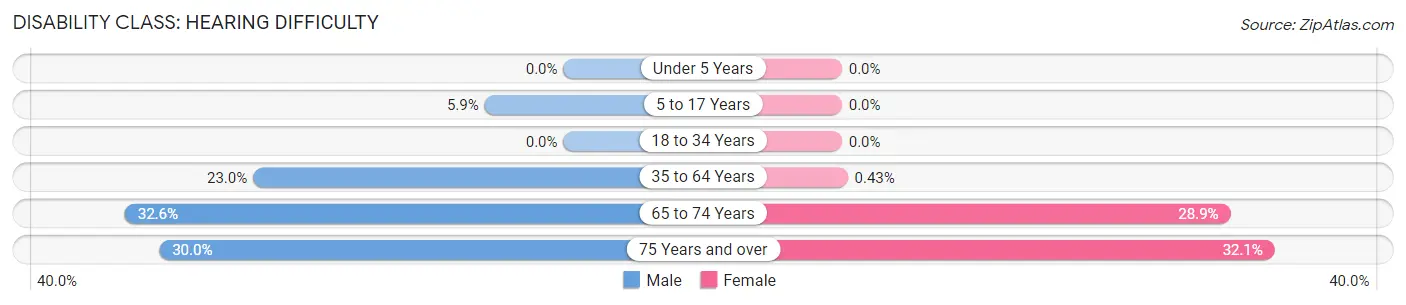
| Age Bracket | Male | Female |
| Under 5 Years | 0 (0.0%) | 0 (0.0%) |
| 5 to 17 Years | 12 (5.9%) | 0 (0.0%) |
| 18 to 34 Years | 0 (0.0%) | 0 (0.0%) |
| 35 to 64 Years | 135 (23.0%) | 2 (0.4%) |
| 65 to 74 Years | 14 (32.6%) | 15 (28.8%) |
| 75 Years and over | 15 (30.0%) | 9 (32.1%) |
Disability Class: Vision Difficulty
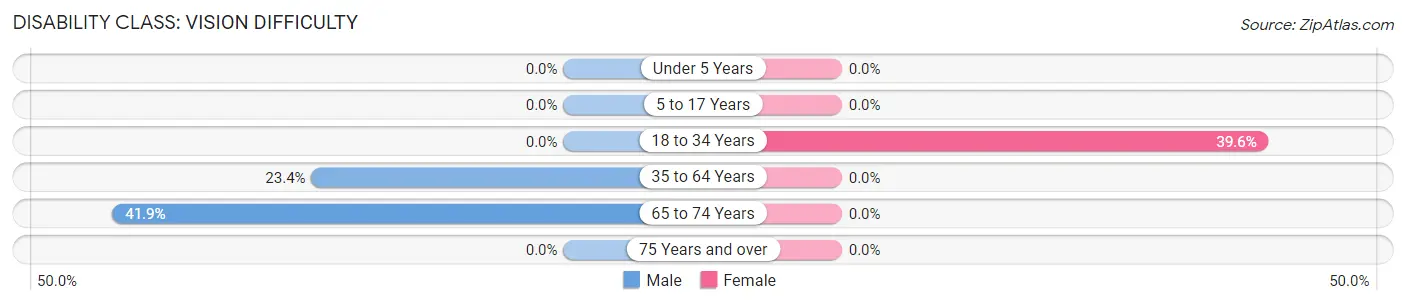
| Age Bracket | Male | Female |
| Under 5 Years | 0 (0.0%) | 0 (0.0%) |
| 5 to 17 Years | 0 (0.0%) | 0 (0.0%) |
| 18 to 34 Years | 0 (0.0%) | 59 (39.6%) |
| 35 to 64 Years | 137 (23.4%) | 0 (0.0%) |
| 65 to 74 Years | 18 (41.9%) | 0 (0.0%) |
| 75 Years and over | 0 (0.0%) | 0 (0.0%) |
Disability Class: Cognitive Difficulty
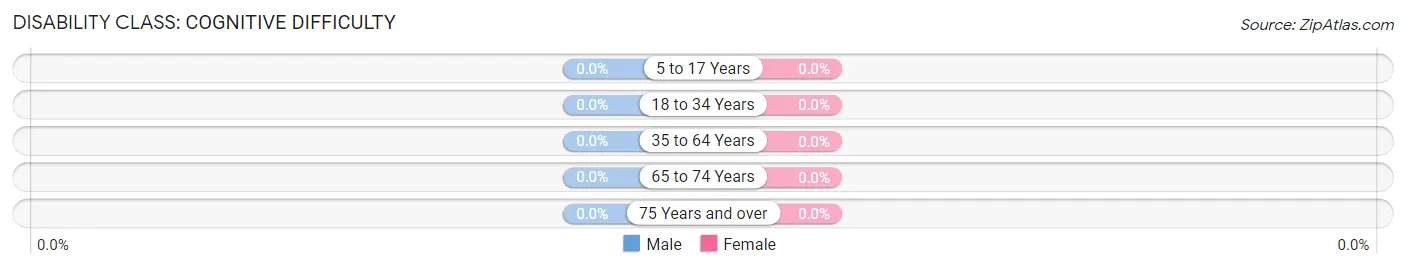
| Age Bracket | Male | Female |
| 5 to 17 Years | 0 (0.0%) | 0 (0.0%) |
| 18 to 34 Years | 0 (0.0%) | 0 (0.0%) |
| 35 to 64 Years | 0 (0.0%) | 0 (0.0%) |
| 65 to 74 Years | 0 (0.0%) | 0 (0.0%) |
| 75 Years and over | 0 (0.0%) | 0 (0.0%) |
Disability Class: Ambulatory Difficulty
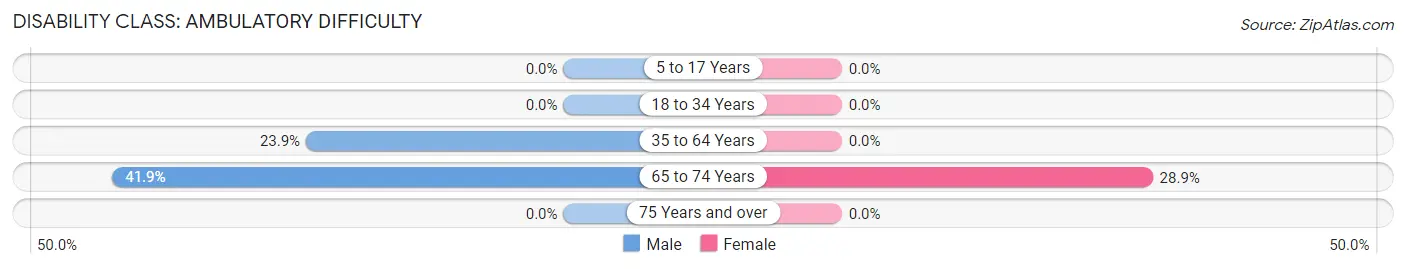
| Age Bracket | Male | Female |
| 5 to 17 Years | 0 (0.0%) | 0 (0.0%) |
| 18 to 34 Years | 0 (0.0%) | 0 (0.0%) |
| 35 to 64 Years | 140 (23.9%) | 0 (0.0%) |
| 65 to 74 Years | 18 (41.9%) | 15 (28.8%) |
| 75 Years and over | 0 (0.0%) | 0 (0.0%) |
Disability Class: Self-Care Difficulty
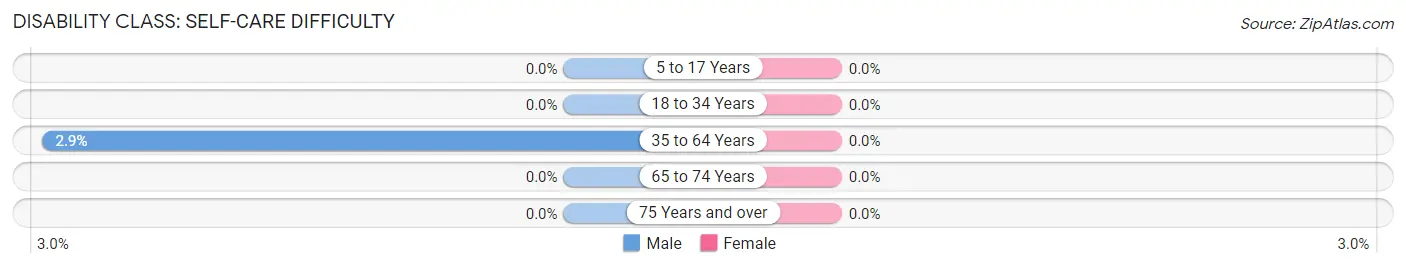
| Age Bracket | Male | Female |
| 5 to 17 Years | 0 (0.0%) | 0 (0.0%) |
| 18 to 34 Years | 0 (0.0%) | 0 (0.0%) |
| 35 to 64 Years | 17 (2.9%) | 0 (0.0%) |
| 65 to 74 Years | 0 (0.0%) | 0 (0.0%) |
| 75 Years and over | 0 (0.0%) | 0 (0.0%) |
Technology Access in Stapleton
Computing Device Access in Stapleton
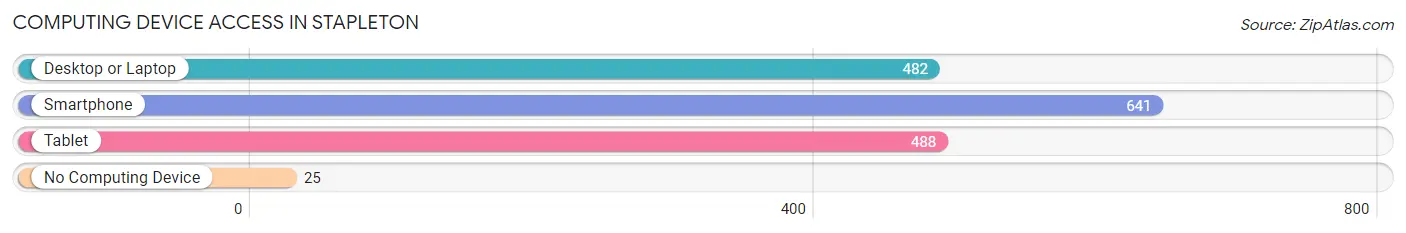
| Device Type | # Households | % Households |
| Desktop or Laptop | 482 | 72.4% |
| Smartphone | 641 | 96.3% |
| Tablet | 488 | 73.3% |
| No Computing Device | 25 | 3.7% |
| Total | 666 | 100.0% |
Internet Access in Stapleton
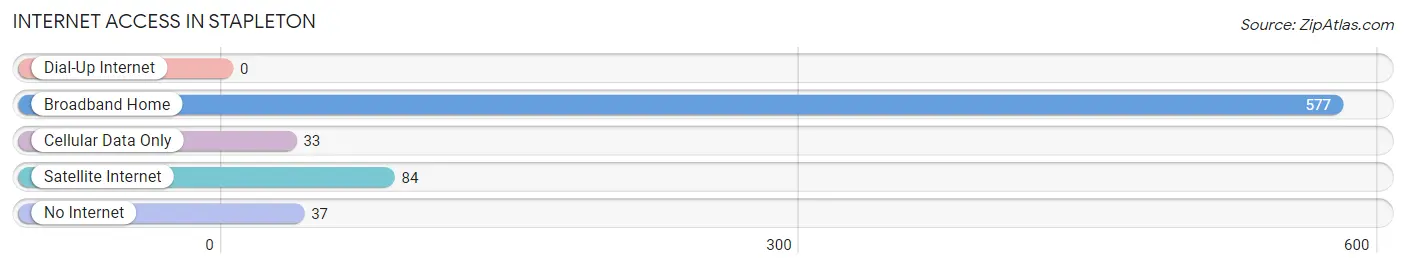
| Internet Type | # Households | % Households |
| Dial-Up Internet | 0 | 0.0% |
| Broadband Home | 577 | 86.6% |
| Cellular Data Only | 33 | 5.0% |
| Satellite Internet | 84 | 12.6% |
| No Internet | 37 | 5.6% |
| Total | 666 | 100.0% |
Stapleton Summary
Stapleton is a small town located in Baldwin County, Alabama. It is situated on the eastern shore of Mobile Bay, approximately 25 miles east of Mobile. The town has a population of approximately 1,000 people and is part of the Daphne-Fairhope-Foley Metropolitan Statistical Area.
History
Stapleton was founded in 1819 by William Stapleton, a former soldier in the War of 1812. He purchased the land from the Creek Indians and established a trading post. The town was originally known as Stapletonville, but the name was changed to Stapleton in 1837.
The town was an important port during the Civil War, and was the site of several battles. After the war, the town experienced a period of growth and prosperity. In the late 19th century, Stapleton was a popular tourist destination, with many visitors coming to enjoy the town's beaches and fishing.
Geography
Stapleton is located on the eastern shore of Mobile Bay, approximately 25 miles east of Mobile. The town is situated on a peninsula, with the bay to the south and the Bon Secour River to the north. The town is surrounded by wetlands and is home to a variety of wildlife, including alligators, turtles, and a variety of birds.
The town has a humid subtropical climate, with hot, humid summers and mild winters. The average annual temperature is around 70 degrees Fahrenheit, and the average annual precipitation is around 60 inches.
Economy
Stapleton's economy is largely based on tourism and fishing. The town is home to several marinas, which attract visitors from all over the country. The town also has a number of restaurants, bars, and shops, which cater to tourists and locals alike.
The town is also home to a number of small businesses, including a boat repair shop, a bait and tackle shop, and a seafood market. The town is also home to a number of seafood processing plants, which employ a number of local residents.
Demographics
As of the 2010 census, Stapleton had a population of 1,000 people. The racial makeup of the town was 97.2% White, 0.7% African American, 0.3% Native American, 0.2% Asian, 0.1% Pacific Islander, and 1.5% from other races. The median household income was $37,500, and the median family income was $45,000.
Stapleton is a small, close-knit community, and the town is home to a number of churches, including Baptist, Methodist, and Catholic. The town also has a number of civic organizations, including the Stapleton Lions Club and the Stapleton Historical Society.
Stapleton is a small town with a rich history and a bright future. The town is home to a number of businesses and attractions, and is a popular destination for tourists and locals alike. The town is also home to a number of churches and civic organizations, which help to make Stapleton a great place to live and work.
Common Questions
What is Per Capita Income in Stapleton?
Per Capita income in Stapleton is $35,066.
What is the Median Family Income in Stapleton?
Median Family Income in Stapleton is $152,902.
What is the Median Household income in Stapleton?
Median Household Income in Stapleton is $124,531.
What is Inequality or Gini Index in Stapleton?
Inequality or Gini Index in Stapleton is 0.34.
What is the Total Population of Stapleton?
Total Population of Stapleton is 2,392.
What is the Total Male Population of Stapleton?
Total Male Population of Stapleton is 1,281.
What is the Total Female Population of Stapleton?
Total Female Population of Stapleton is 1,111.
What is the Ratio of Males per 100 Females in Stapleton?
There are 115.30 Males per 100 Females in Stapleton.
What is the Ratio of Females per 100 Males in Stapleton?
There are 86.73 Females per 100 Males in Stapleton.
What is the Median Population Age in Stapleton?
Median Population Age in Stapleton is 37.2 Years.
What is the Average Family Size in Stapleton
Average Family Size in Stapleton is 4.0 People.
What is the Average Household Size in Stapleton
Average Household Size in Stapleton is 3.6 People.
How Large is the Labor Force in Stapleton?
There are 1,089 People in the Labor Forcein in Stapleton.
What is the Percentage of People in the Labor Force in Stapleton?
74.8% of People are in the Labor Force in Stapleton.