Grant, AL Map & Demographics
Grant Map
Grant Overview
$28,474
PER CAPITA INCOME
$88,875
AVG FAMILY INCOME
$81,875
AVG HOUSEHOLD INCOME
0.39
INEQUALITY / GINI INDEX
1,667
TOTAL POPULATION
800
MALE POPULATION
867
FEMALE POPULATION
92.27
MALES / 100 FEMALES
108.38
FEMALES / 100 MALES
29.0
MEDIAN AGE
3.4
AVG FAMILY SIZE
3.2
AVG HOUSEHOLD SIZE
691
LABOR FORCE [ PEOPLE ]
60.8%
PERCENT IN LABOR FORCE
2.2%
UNEMPLOYMENT RATE
Grant Zip Codes
Grant Area Codes
Income in Grant
Income Overview in Grant
Per Capita Income in Grant is $28,474, while median incomes of families and households are $88,875 and $81,875 respectively.
| Characteristic | Number | Measure |
| Per Capita Income | 1,667 | $28,474 |
| Median Family Income | 433 | $88,875 |
| Mean Family Income | 433 | $97,488 |
| Median Household Income | 517 | $81,875 |
| Mean Household Income | 517 | $89,210 |
| Income Deficit | 433 | $0 |
| Wage / Income Gap (%) | 1,667 | 0.00% |
| Wage / Income Gap ($) | 1,667 | 100.00¢ per $1 |
| Gini / Inequality Index | 1,667 | 0.39 |
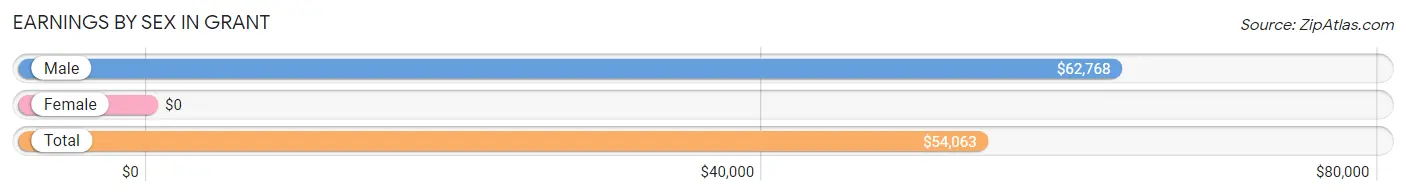
Earnings by Sex in Grant
| Sex | Number | Average Earnings |
| Male | 375 (53.1%) | $62,768 |
| Female | 331 (46.9%) | $0 |
| Total | 706 (100.0%) | $54,063 |
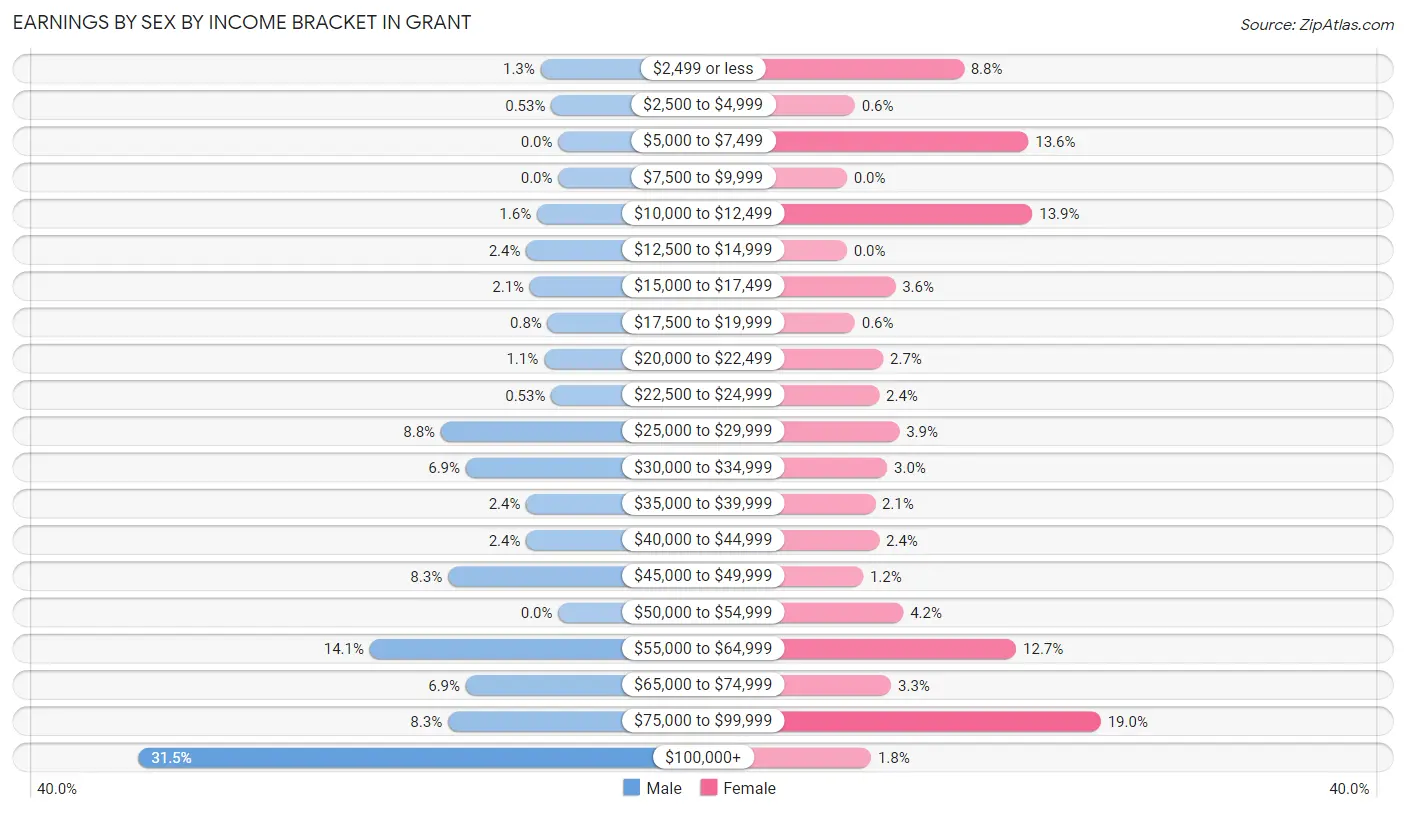
Earnings by Sex by Income Bracket in Grant
The most common earnings brackets in Grant are $100,000+ for men (118 | 31.5%) and $75,000 to $99,999 for women (63 | 19.0%).
| Income | Male | Female |
| $2,499 or less | 5 (1.3%) | 29 (8.8%) |
| $2,500 to $4,999 | 2 (0.5%) | 2 (0.6%) |
| $5,000 to $7,499 | 0 (0.0%) | 45 (13.6%) |
| $7,500 to $9,999 | 0 (0.0%) | 0 (0.0%) |
| $10,000 to $12,499 | 6 (1.6%) | 46 (13.9%) |
| $12,500 to $14,999 | 9 (2.4%) | 0 (0.0%) |
| $15,000 to $17,499 | 8 (2.1%) | 12 (3.6%) |
| $17,500 to $19,999 | 3 (0.8%) | 2 (0.6%) |
| $20,000 to $22,499 | 4 (1.1%) | 9 (2.7%) |
| $22,500 to $24,999 | 2 (0.5%) | 8 (2.4%) |
| $25,000 to $29,999 | 33 (8.8%) | 13 (3.9%) |
| $30,000 to $34,999 | 26 (6.9%) | 10 (3.0%) |
| $35,000 to $39,999 | 9 (2.4%) | 7 (2.1%) |
| $40,000 to $44,999 | 9 (2.4%) | 8 (2.4%) |
| $45,000 to $49,999 | 31 (8.3%) | 4 (1.2%) |
| $50,000 to $54,999 | 0 (0.0%) | 14 (4.2%) |
| $55,000 to $64,999 | 53 (14.1%) | 42 (12.7%) |
| $65,000 to $74,999 | 26 (6.9%) | 11 (3.3%) |
| $75,000 to $99,999 | 31 (8.3%) | 63 (19.0%) |
| $100,000+ | 118 (31.5%) | 6 (1.8%) |
| Total | 375 (100.0%) | 331 (100.0%) |
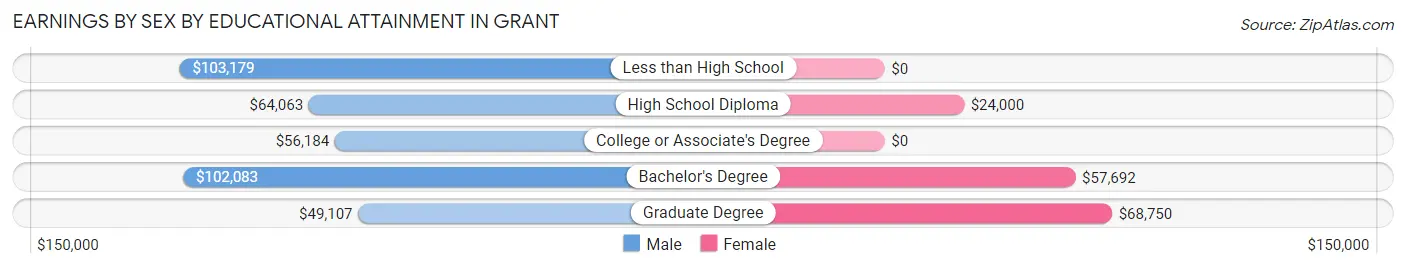
Earnings by Sex by Educational Attainment in Grant
Average earnings in Grant are $64,107 for men and $51,458 for women, a difference of 19.7%. Men with an educational attainment of less than high school enjoy the highest average annual earnings of $103,179, while those with graduate degree education earn the least with $49,107. Women with an educational attainment of graduate degree earn the most with the average annual earnings of $68,750, while those with high school diploma education have the smallest earnings of $24,000.
| Educational Attainment | Male Income | Female Income |
| Less than High School | $103,179 | $0 |
| High School Diploma | $64,063 | $24,000 |
| College or Associate's Degree | $56,184 | $0 |
| Bachelor's Degree | $102,083 | $57,692 |
| Graduate Degree | $49,107 | $68,750 |
| Total | $64,107 | $51,458 |
Family Income in Grant
Family Income Brackets in Grant
According to the Grant family income data, there are 81 families falling into the $150,000 to $199,999 income range, which is the most common income bracket and makes up 18.7% of all families. Conversely, the less than $10,000 income bracket is the least frequent group with only 6 families (1.4%) belonging to this category.
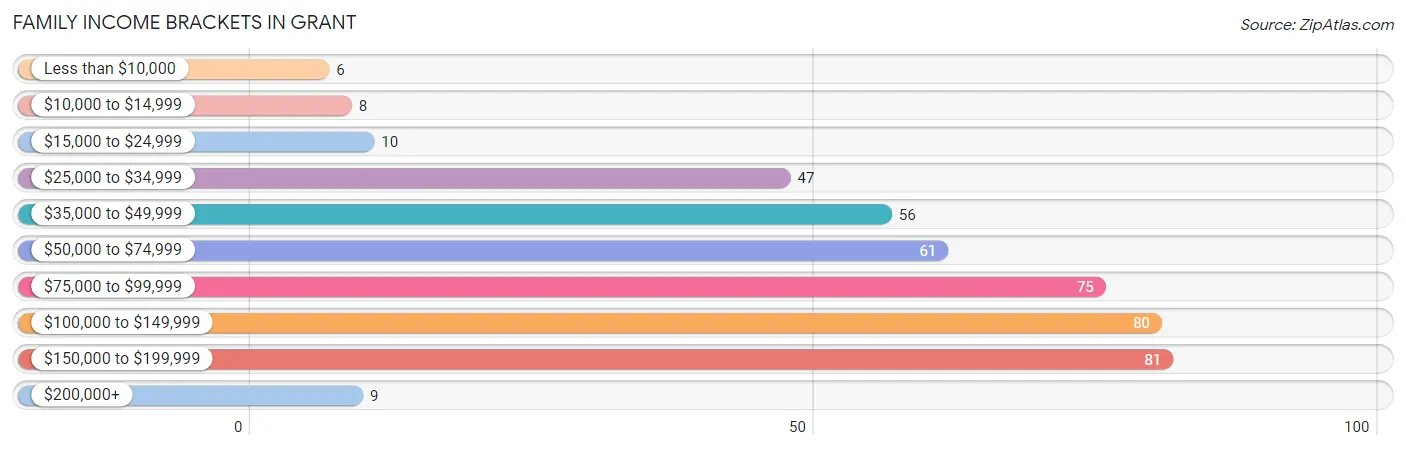
| Income Bracket | # Families | % Families |
| Less than $10,000 | 6 | 1.4% |
| $10,000 to $14,999 | 8 | 1.8% |
| $15,000 to $24,999 | 10 | 2.3% |
| $25,000 to $34,999 | 47 | 10.9% |
| $35,000 to $49,999 | 56 | 12.9% |
| $50,000 to $74,999 | 61 | 14.1% |
| $75,000 to $99,999 | 75 | 17.3% |
| $100,000 to $149,999 | 80 | 18.5% |
| $150,000 to $199,999 | 81 | 18.7% |
| $200,000+ | 9 | 2.1% |
Family Income by Famaliy Size in Grant
4-person families (94 | 21.7%) account for the highest median family income in Grant with $192,552 per family, while 4-person families (94 | 21.7%) have the highest median income of $48,138 per family member.
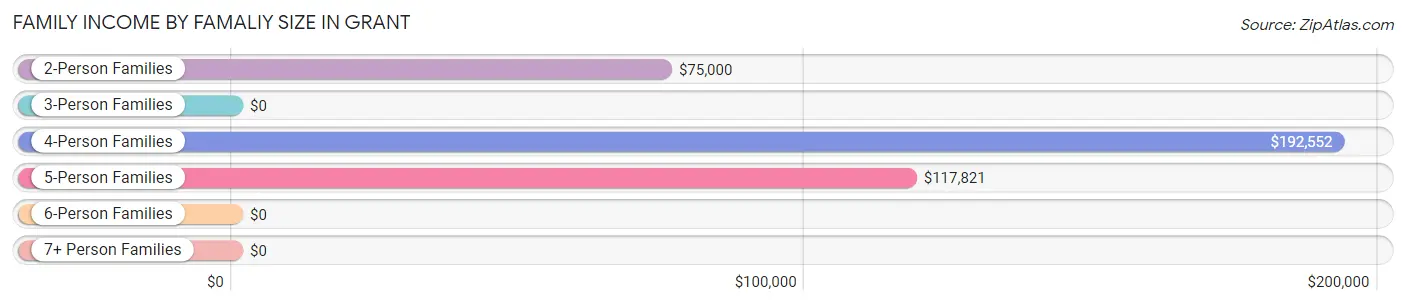
| Income Bracket | # Families | Median Income |
| 2-Person Families | 180 (41.6%) | $75,000 |
| 3-Person Families | 82 (18.9%) | $0 |
| 4-Person Families | 94 (21.7%) | $192,552 |
| 5-Person Families | 75 (17.3%) | $117,821 |
| 6-Person Families | 1 (0.2%) | $0 |
| 7+ Person Families | 1 (0.2%) | $0 |
| Total | 433 (100.0%) | $88,875 |
Family Income by Number of Earners in Grant
The median family income in Grant is $88,875, with families comprising 2 earners (138) having the highest median family income of $173,056, while families with no earners (54) have the lowest median family income of $38,409, accounting for 31.9% and 12.5% of families, respectively.
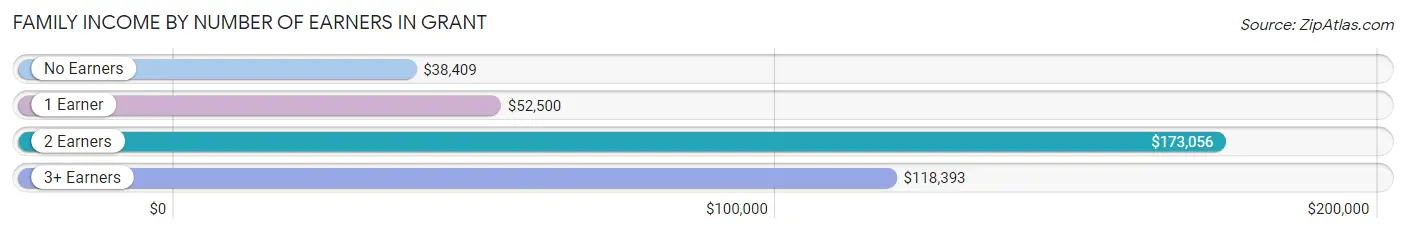
| Number of Earners | # Families | Median Income |
| No Earners | 54 (12.5%) | $38,409 |
| 1 Earner | 184 (42.5%) | $52,500 |
| 2 Earners | 138 (31.9%) | $173,056 |
| 3+ Earners | 57 (13.2%) | $118,393 |
| Total | 433 (100.0%) | $88,875 |
Household Income in Grant
Household Income Brackets in Grant
With 95 households falling in the category, the $100,000 to $149,999 income range is the most frequent in Grant, accounting for 18.4% of all households. In contrast, only 9 households (1.7%) fall into the $200,000+ income bracket, making it the least populous group.
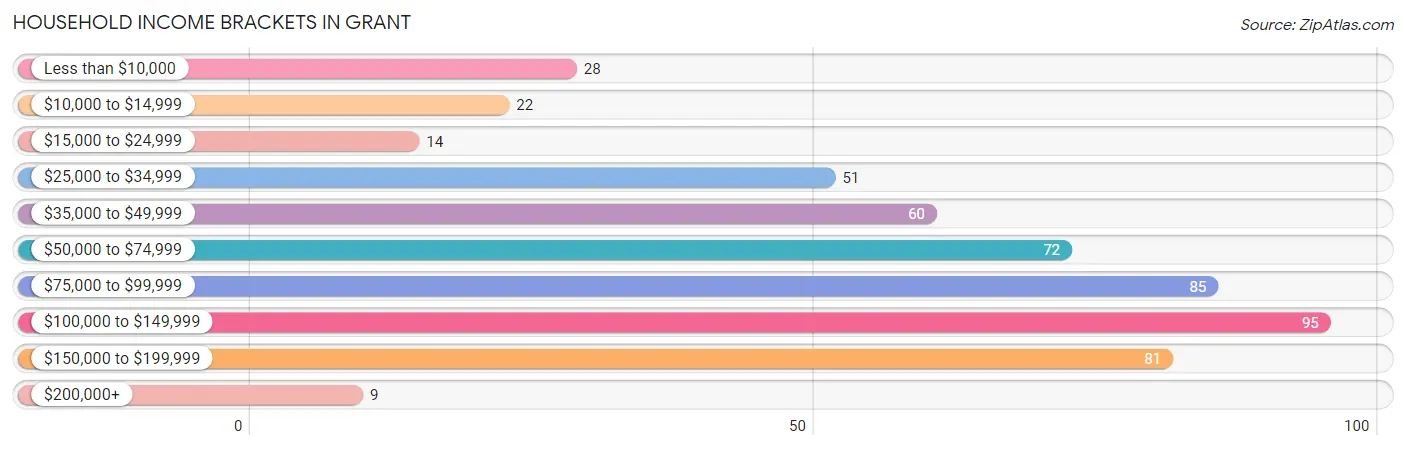
| Income Bracket | # Households | % Households |
| Less than $10,000 | 28 | 5.4% |
| $10,000 to $14,999 | 22 | 4.3% |
| $15,000 to $24,999 | 14 | 2.7% |
| $25,000 to $34,999 | 51 | 9.9% |
| $35,000 to $49,999 | 60 | 11.6% |
| $50,000 to $74,999 | 72 | 13.9% |
| $75,000 to $99,999 | 85 | 16.4% |
| $100,000 to $149,999 | 95 | 18.4% |
| $150,000 to $199,999 | 81 | 15.7% |
| $200,000+ | 9 | 1.7% |
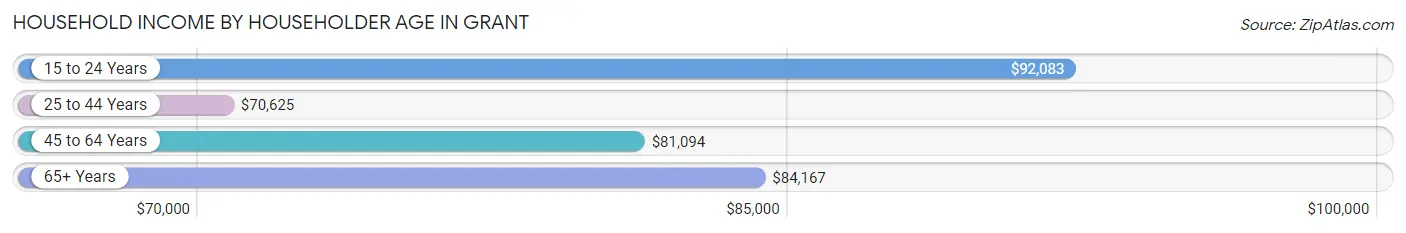
Household Income by Householder Age in Grant
The median household income in Grant is $81,875, with the highest median household income of $92,083 found in the 15 to 24 years age bracket for the primary householder. A total of 7 households (1.3%) fall into this category. Meanwhile, the 25 to 44 years age bracket for the primary householder has the lowest median household income of $70,625, with 255 households (49.3%) in this group.
| Income Bracket | # Households | Median Income |
| 15 to 24 Years | 7 (1.3%) | $92,083 |
| 25 to 44 Years | 255 (49.3%) | $70,625 |
| 45 to 64 Years | 153 (29.6%) | $81,094 |
| 65+ Years | 102 (19.7%) | $84,167 |
| Total | 517 (100.0%) | $81,875 |
Poverty in Grant
Income Below Poverty by Sex and Age in Grant
With 2.9% poverty level for males and 12.7% for females among the residents of Grant, 12 to 14 year old males and 65 to 74 year old females are the most vulnerable to poverty, with 5 males (71.4%) and 37 females (42.5%) in their respective age groups living below the poverty level.
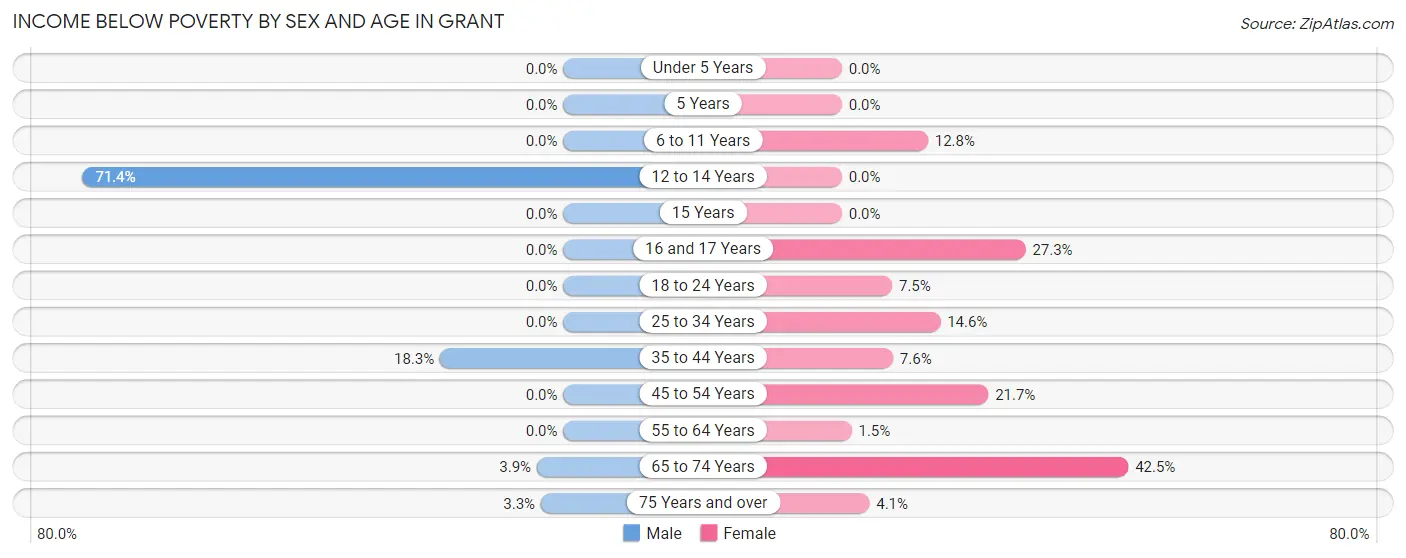
| Age Bracket | Male | Female |
| Under 5 Years | 0 (0.0%) | 0 (0.0%) |
| 5 Years | 0 (0.0%) | 0 (0.0%) |
| 6 to 11 Years | 0 (0.0%) | 6 (12.8%) |
| 12 to 14 Years | 5 (71.4%) | 0 (0.0%) |
| 15 Years | 0 (0.0%) | 0 (0.0%) |
| 16 and 17 Years | 0 (0.0%) | 3 (27.3%) |
| 18 to 24 Years | 0 (0.0%) | 5 (7.5%) |
| 25 to 34 Years | 0 (0.0%) | 32 (14.6%) |
| 35 to 44 Years | 13 (18.3%) | 6 (7.6%) |
| 45 to 54 Years | 0 (0.0%) | 15 (21.7%) |
| 55 to 64 Years | 0 (0.0%) | 1 (1.5%) |
| 65 to 74 Years | 2 (3.9%) | 37 (42.5%) |
| 75 Years and over | 1 (3.3%) | 2 (4.1%) |
| Total | 21 (2.9%) | 107 (12.7%) |
Income Above Poverty by Sex and Age in Grant
According to the poverty statistics in Grant, males aged under 5 years and females aged under 5 years are the age groups that are most secure financially, with 100.0% of males and 100.0% of females in these age groups living above the poverty line.
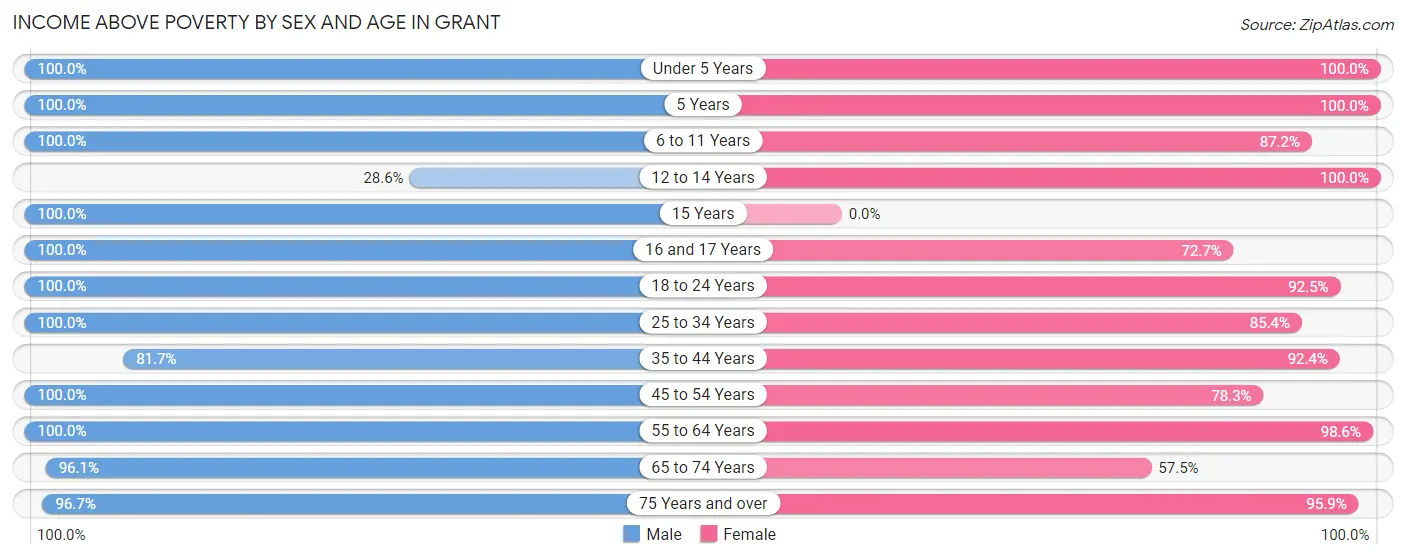
| Age Bracket | Male | Female |
| Under 5 Years | 31 (100.0%) | 130 (100.0%) |
| 5 Years | 108 (100.0%) | 2 (100.0%) |
| 6 to 11 Years | 73 (100.0%) | 41 (87.2%) |
| 12 to 14 Years | 2 (28.6%) | 13 (100.0%) |
| 15 Years | 28 (100.0%) | 0 (0.0%) |
| 16 and 17 Years | 6 (100.0%) | 8 (72.7%) |
| 18 to 24 Years | 19 (100.0%) | 62 (92.5%) |
| 25 to 34 Years | 172 (100.0%) | 187 (85.4%) |
| 35 to 44 Years | 58 (81.7%) | 73 (92.4%) |
| 45 to 54 Years | 71 (100.0%) | 54 (78.3%) |
| 55 to 64 Years | 67 (100.0%) | 68 (98.6%) |
| 65 to 74 Years | 49 (96.1%) | 50 (57.5%) |
| 75 Years and over | 29 (96.7%) | 47 (95.9%) |
| Total | 713 (97.1%) | 735 (87.3%) |
Income Below Poverty Among Married-Couple Families in Grant
The poverty statistics for married-couple families in Grant show that 0.8% or 3 of the total 365 families live below the poverty line. Families with no children have the highest poverty rate of 1.7%, comprising of 3 families. On the other hand, families with 1 or 2 children have the lowest poverty rate of 0.0%, which includes 0 families.
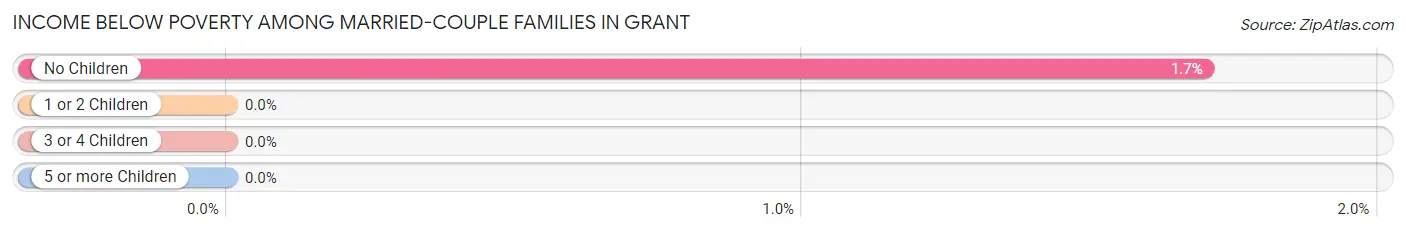
| Children | Above Poverty | Below Poverty |
| No Children | 173 (98.3%) | 3 (1.7%) |
| 1 or 2 Children | 155 (100.0%) | 0 (0.0%) |
| 3 or 4 Children | 33 (100.0%) | 0 (0.0%) |
| 5 or more Children | 1 (100.0%) | 0 (0.0%) |
| Total | 362 (99.2%) | 3 (0.8%) |
Income Below Poverty Among Single-Parent Households in Grant
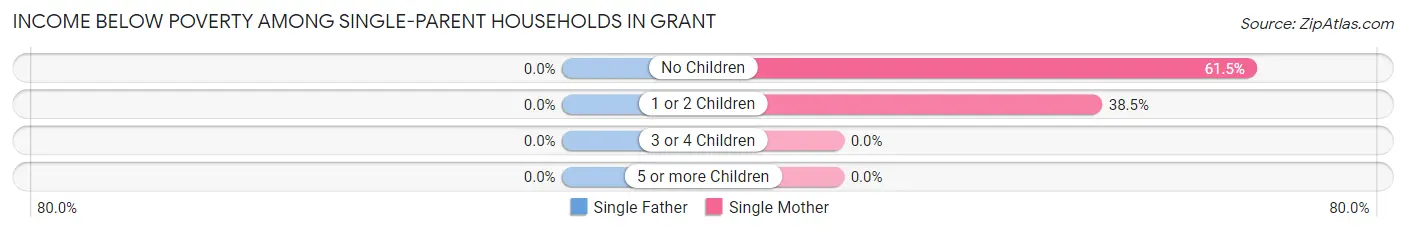
| Children | Single Father | Single Mother |
| No Children | 0 (0.0%) | 8 (61.5%) |
| 1 or 2 Children | 0 (0.0%) | 10 (38.5%) |
| 3 or 4 Children | 0 (0.0%) | 0 (0.0%) |
| 5 or more Children | 0 (0.0%) | 0 (0.0%) |
| Total | 0 (0.0%) | 18 (46.2%) |
Income Below Poverty Among Married-Couple vs Single-Parent Households in Grant
The poverty data for Grant shows that 3 of the married-couple family households (0.8%) and 18 of the single-parent households (26.5%) are living below the poverty level. Within the married-couple family households, those with no children have the highest poverty rate, with 3 households (1.7%) falling below the poverty line. Among the single-parent households, those with no children have the highest poverty rate, with 8 household (38.1%) living below poverty.
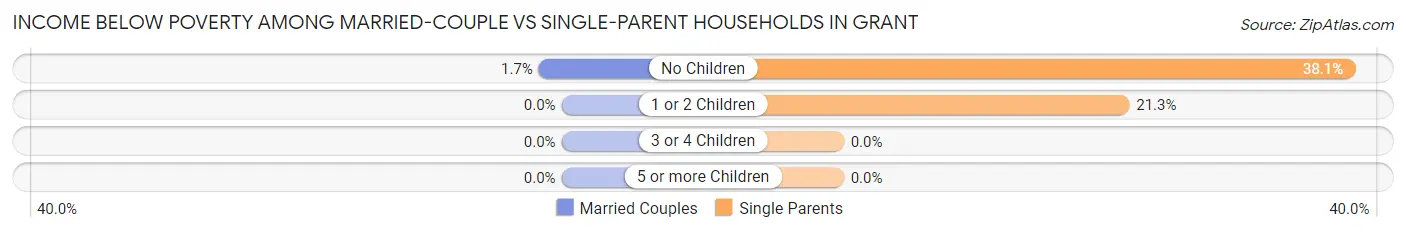
| Children | Married-Couple Families | Single-Parent Households |
| No Children | 3 (1.7%) | 8 (38.1%) |
| 1 or 2 Children | 0 (0.0%) | 10 (21.3%) |
| 3 or 4 Children | 0 (0.0%) | 0 (0.0%) |
| 5 or more Children | 0 (0.0%) | 0 (0.0%) |
| Total | 3 (0.8%) | 18 (26.5%) |
Race in Grant
The most populous races in Grant are White / Caucasian (1,574 | 94.4%), Hispanic or Latino (41 | 2.5%), and Two or more Races (41 | 2.5%).
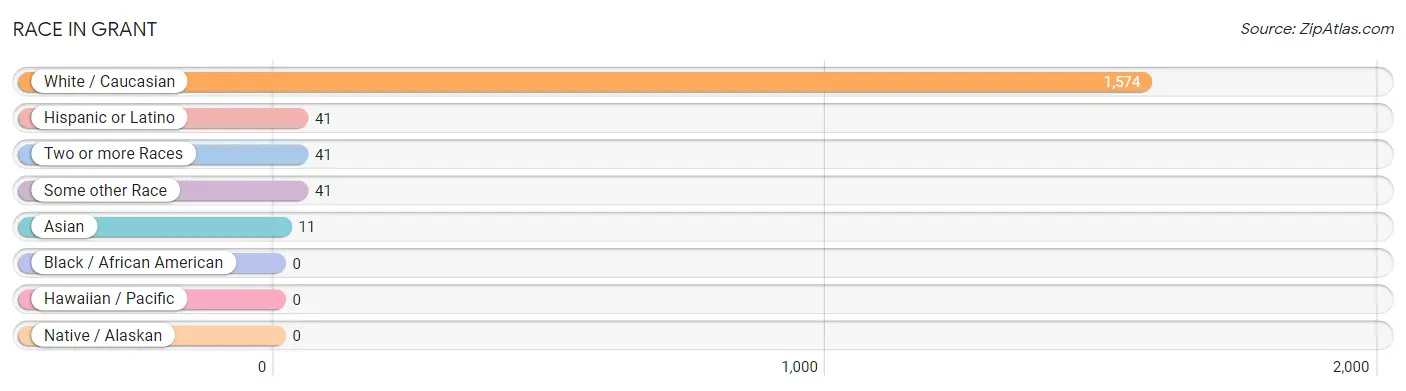
| Race | # Population | % Population |
| Asian | 11 | 0.7% |
| Black / African American | 0 | 0.0% |
| Hawaiian / Pacific | 0 | 0.0% |
| Hispanic or Latino | 41 | 2.5% |
| Native / Alaskan | 0 | 0.0% |
| White / Caucasian | 1,574 | 94.4% |
| Two or more Races | 41 | 2.5% |
| Some other Race | 41 | 2.5% |
| Total | 1,667 | 100.0% |
Ancestry in Grant
The most populous ancestries reported in Grant are American (723 | 43.4%), English (145 | 8.7%), Irish (108 | 6.5%), German (79 | 4.7%), and Scottish (70 | 4.2%), together accounting for 67.5% of all Grant residents.
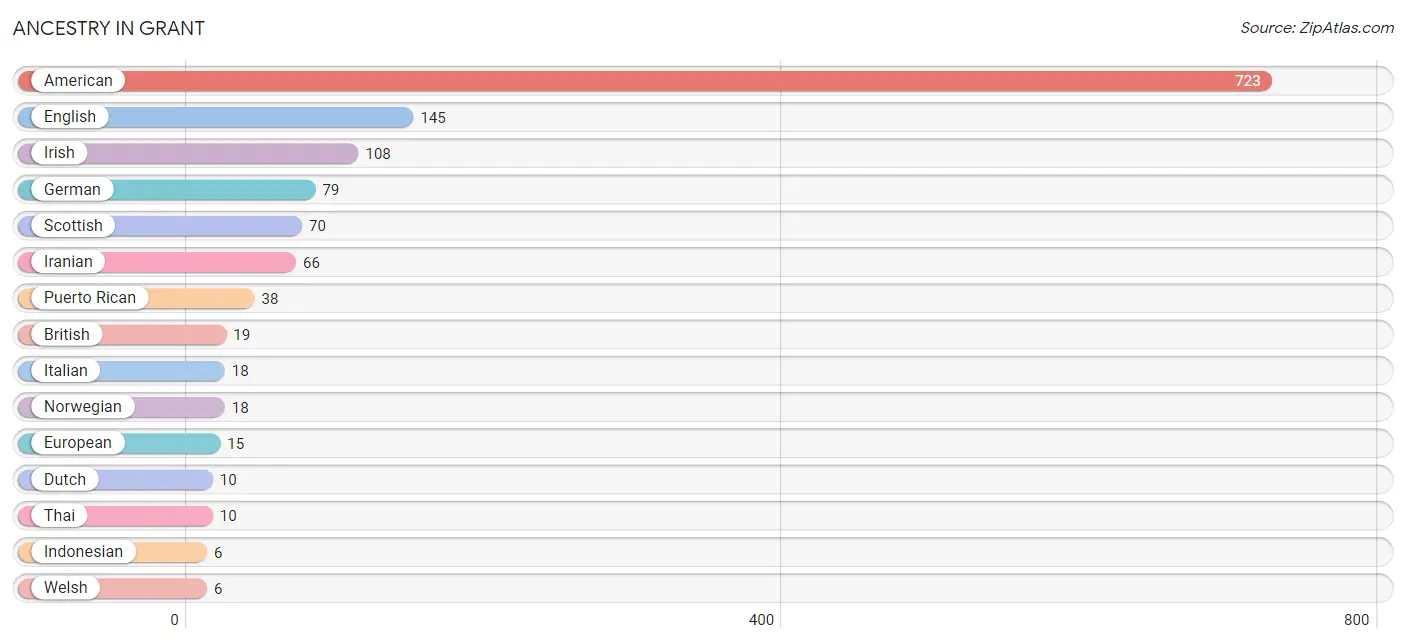
| Ancestry | # Population | % Population |
| African | 3 | 0.2% |
| American | 723 | 43.4% |
| British | 19 | 1.1% |
| Burmese | 4 | 0.2% |
| Dutch | 10 | 0.6% |
| English | 145 | 8.7% |
| European | 15 | 0.9% |
| French | 4 | 0.2% |
| German | 79 | 4.7% |
| Indonesian | 6 | 0.4% |
| Iranian | 66 | 4.0% |
| Irish | 108 | 6.5% |
| Italian | 18 | 1.1% |
| Korean | 4 | 0.2% |
| Mexican | 3 | 0.2% |
| Norwegian | 18 | 1.1% |
| Polish | 3 | 0.2% |
| Puerto Rican | 38 | 2.3% |
| Romanian | 2 | 0.1% |
| Scandinavian | 2 | 0.1% |
| Scotch-Irish | 3 | 0.2% |
| Scottish | 70 | 4.2% |
| Subsaharan African | 3 | 0.2% |
| Thai | 10 | 0.6% |
| Welsh | 6 | 0.4% | View All 25 Rows |
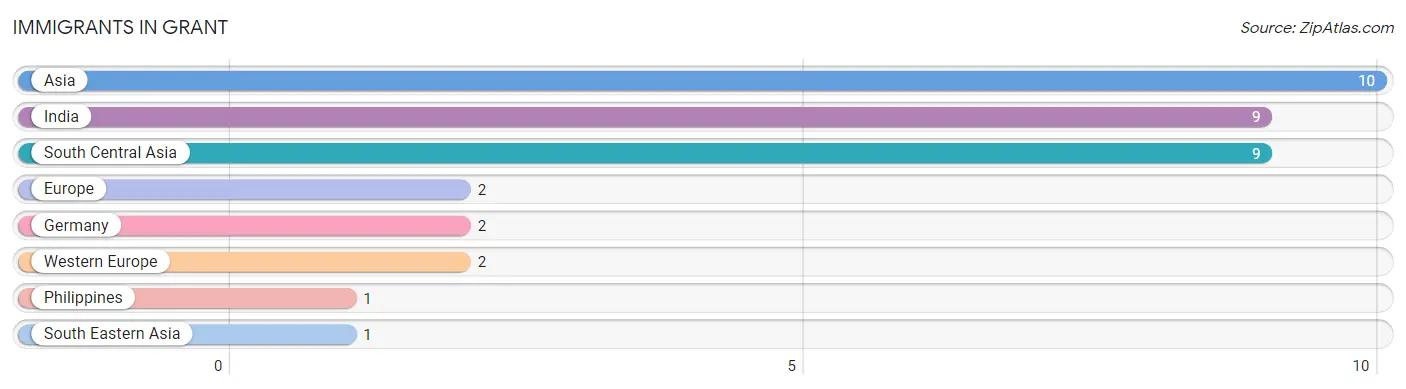
Immigrants in Grant
The most numerous immigrant groups reported in Grant came from Asia (10 | 0.6%), India (9 | 0.5%), South Central Asia (9 | 0.5%), Europe (2 | 0.1%), and Germany (2 | 0.1%), together accounting for 1.9% of all Grant residents.
| Immigration Origin | # Population | % Population |
| Asia | 10 | 0.6% |
| Europe | 2 | 0.1% |
| Germany | 2 | 0.1% |
| India | 9 | 0.5% |
| Philippines | 1 | 0.1% |
| South Central Asia | 9 | 0.5% |
| South Eastern Asia | 1 | 0.1% |
| Western Europe | 2 | 0.1% | View All 8 Rows |
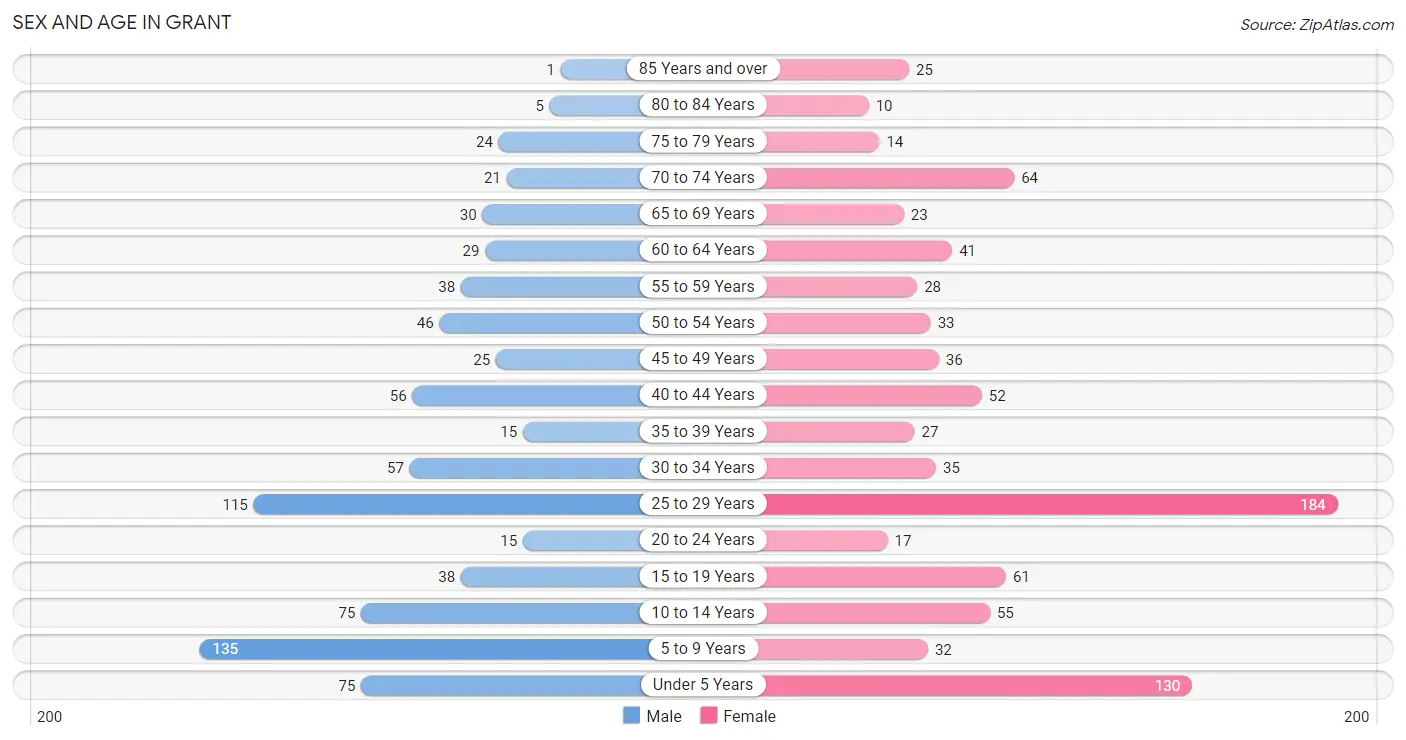
Sex and Age in Grant
Sex and Age in Grant
The most populous age groups in Grant are 5 to 9 Years (135 | 16.9%) for men and 25 to 29 Years (184 | 21.2%) for women.
| Age Bracket | Male | Female |
| Under 5 Years | 75 (9.4%) | 130 (15.0%) |
| 5 to 9 Years | 135 (16.9%) | 32 (3.7%) |
| 10 to 14 Years | 75 (9.4%) | 55 (6.3%) |
| 15 to 19 Years | 38 (4.8%) | 61 (7.0%) |
| 20 to 24 Years | 15 (1.9%) | 17 (2.0%) |
| 25 to 29 Years | 115 (14.4%) | 184 (21.2%) |
| 30 to 34 Years | 57 (7.1%) | 35 (4.0%) |
| 35 to 39 Years | 15 (1.9%) | 27 (3.1%) |
| 40 to 44 Years | 56 (7.0%) | 52 (6.0%) |
| 45 to 49 Years | 25 (3.1%) | 36 (4.2%) |
| 50 to 54 Years | 46 (5.8%) | 33 (3.8%) |
| 55 to 59 Years | 38 (4.8%) | 28 (3.2%) |
| 60 to 64 Years | 29 (3.6%) | 41 (4.7%) |
| 65 to 69 Years | 30 (3.7%) | 23 (2.6%) |
| 70 to 74 Years | 21 (2.6%) | 64 (7.4%) |
| 75 to 79 Years | 24 (3.0%) | 14 (1.6%) |
| 80 to 84 Years | 5 (0.6%) | 10 (1.1%) |
| 85 Years and over | 1 (0.1%) | 25 (2.9%) |
| Total | 800 (100.0%) | 867 (100.0%) |
Families and Households in Grant
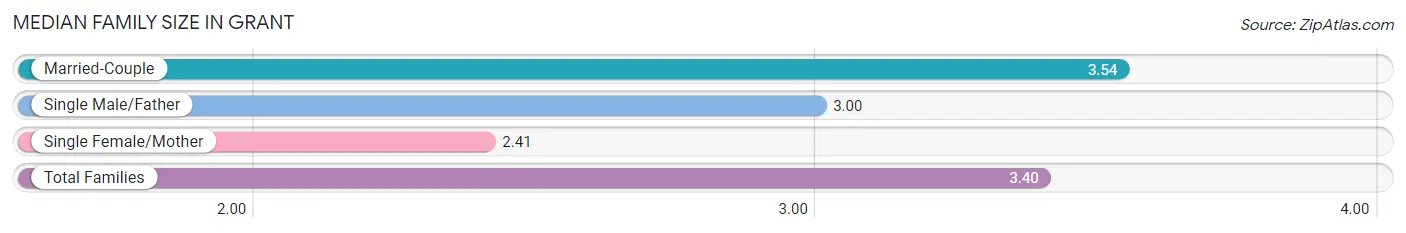
Median Family Size in Grant
The median family size in Grant is 3.40 persons per family, with married-couple families (365 | 84.3%) accounting for the largest median family size of 3.54 persons per family. On the other hand, single female/mother families (39 | 9.0%) represent the smallest median family size with 2.41 persons per family.
| Family Type | # Families | Family Size |
| Married-Couple | 365 (84.3%) | 3.54 |
| Single Male/Father | 29 (6.7%) | 3.00 |
| Single Female/Mother | 39 (9.0%) | 2.41 |
| Total Families | 433 (100.0%) | 3.40 |
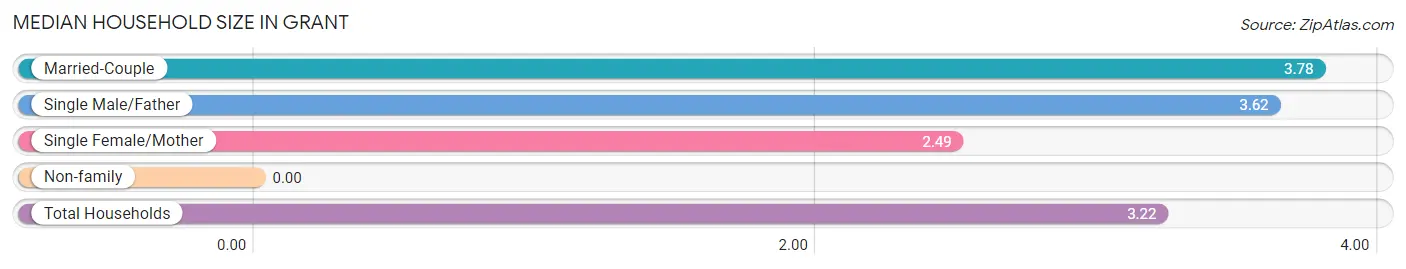
Median Household Size in Grant
| Household Type | # Households | Household Size |
| Married-Couple | 365 (70.6%) | 3.78 |
| Single Male/Father | 29 (5.6%) | 3.62 |
| Single Female/Mother | 39 (7.5%) | 2.49 |
| Non-family | 84 (16.3%) | - |
| Total Households | 517 (100.0%) | 3.22 |
Household Size by Marriage Status in Grant
Out of a total of 517 households in Grant, 433 (83.8%) are family households, while 84 (16.3%) are nonfamily households. The most numerous type of family households are 2-person households, comprising 145, and the most common type of nonfamily households are 1-person households, comprising 84.
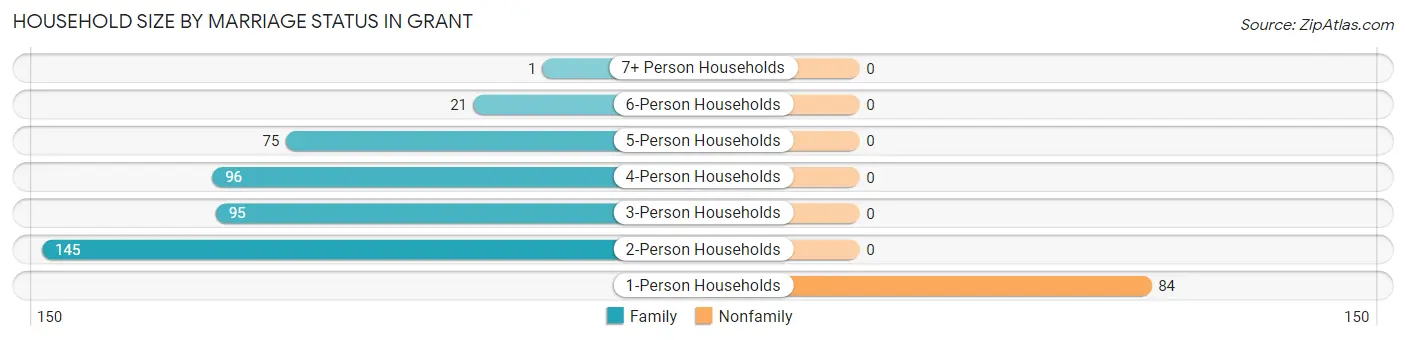
| Household Size | Family Households | Nonfamily Households |
| 1-Person Households | - | 84 (16.3%) |
| 2-Person Households | 145 (28.1%) | 0 (0.0%) |
| 3-Person Households | 95 (18.4%) | 0 (0.0%) |
| 4-Person Households | 96 (18.6%) | 0 (0.0%) |
| 5-Person Households | 75 (14.5%) | 0 (0.0%) |
| 6-Person Households | 21 (4.1%) | 0 (0.0%) |
| 7+ Person Households | 1 (0.2%) | 0 (0.0%) |
| Total | 433 (83.8%) | 84 (16.3%) |
Female Fertility in Grant
Fertility by Age in Grant
Average fertility rate in Grant is 50.0 births per 1,000 women. Women in the age bracket of 20 to 34 years have the highest fertility rate with 89.0 births per 1,000 women. Women in the age bracket of 20 to 34 years acount for 100.0% of all women with births.
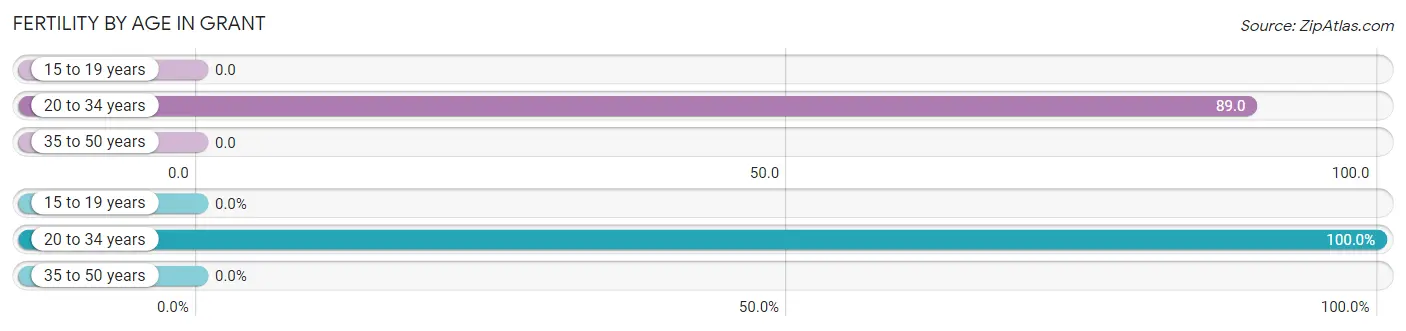
| Age Bracket | Women with Births | Births / 1,000 Women |
| 15 to 19 years | 0 (0.0%) | 0.0 |
| 20 to 34 years | 21 (100.0%) | 89.0 |
| 35 to 50 years | 0 (0.0%) | 0.0 |
| Total | 21 (100.0%) | 50.0 |
Fertility by Age by Marriage Status in Grant
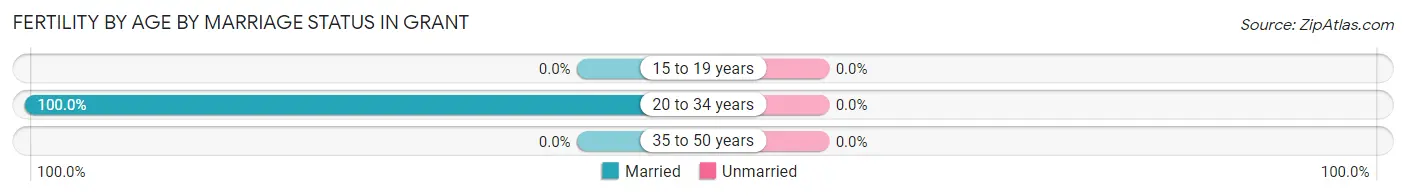
| Age Bracket | Married | Unmarried |
| 15 to 19 years | 0 (0.0%) | 0 (0.0%) |
| 20 to 34 years | 21 (100.0%) | 0 (0.0%) |
| 35 to 50 years | 0 (0.0%) | 0 (0.0%) |
| Total | 21 (100.0%) | 0 (0.0%) |
Fertility by Education in Grant
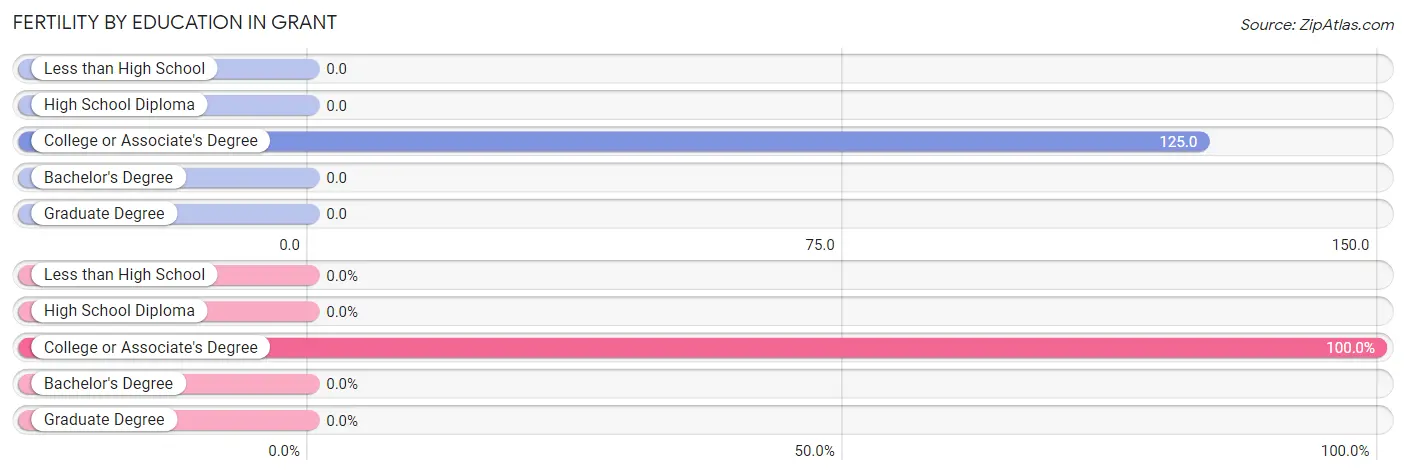
| Educational Attainment | Women with Births | Births / 1,000 Women |
| Less than High School | 0 (0.0%) | 0.0 |
| High School Diploma | 0 (0.0%) | 0.0 |
| College or Associate's Degree | 21 (100.0%) | 125.0 |
| Bachelor's Degree | 0 (0.0%) | 0.0 |
| Graduate Degree | 0 (0.0%) | 0.0 |
| Total | 21 (100.0%) | 50.0 |
Fertility by Education by Marriage Status in Grant
| Educational Attainment | Married | Unmarried |
| Less than High School | 0 (0.0%) | 0 (0.0%) |
| High School Diploma | 0 (0.0%) | 0 (0.0%) |
| College or Associate's Degree | 21 (100.0%) | 0 (0.0%) |
| Bachelor's Degree | 0 (0.0%) | 0 (0.0%) |
| Graduate Degree | 0 (0.0%) | 0 (0.0%) |
| Total | 21 (100.0%) | 0 (0.0%) |
Employment Characteristics in Grant
Employment by Class of Employer in Grant
Among the 671 employed individuals in Grant, private company employees (493 | 73.5%), not-for-profit organizations (60 | 8.9%), and state government employees (40 | 6.0%) make up the most common classes of employment.
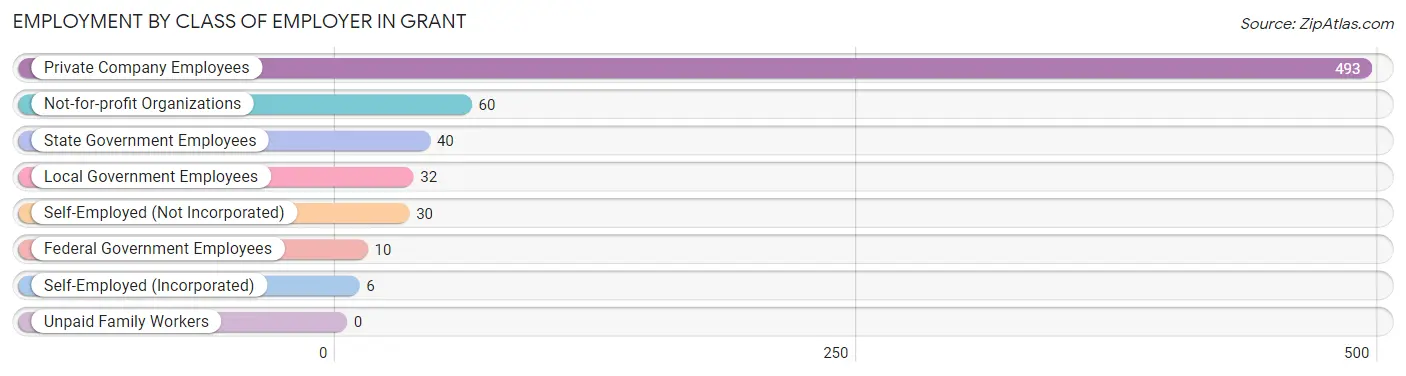
| Employer Class | # Employees | % Employees |
| Private Company Employees | 493 | 73.5% |
| Self-Employed (Incorporated) | 6 | 0.9% |
| Self-Employed (Not Incorporated) | 30 | 4.5% |
| Not-for-profit Organizations | 60 | 8.9% |
| Local Government Employees | 32 | 4.8% |
| State Government Employees | 40 | 6.0% |
| Federal Government Employees | 10 | 1.5% |
| Unpaid Family Workers | 0 | 0.0% |
| Total | 671 | 100.0% |
Employment Status by Age in Grant
According to the labor force statistics for Grant, out of the total population over 16 years of age (1,137), 60.8% or 691 individuals are in the labor force, with 2.2% or 15 of them unemployed. The age group with the highest labor force participation rate is 35 to 44 years, with 91.3% or 137 individuals in the labor force. Within the labor force, the 16 to 19 years age range has the highest percentage of unemployed individuals, with 16.4% or 10 of them being unemployed.
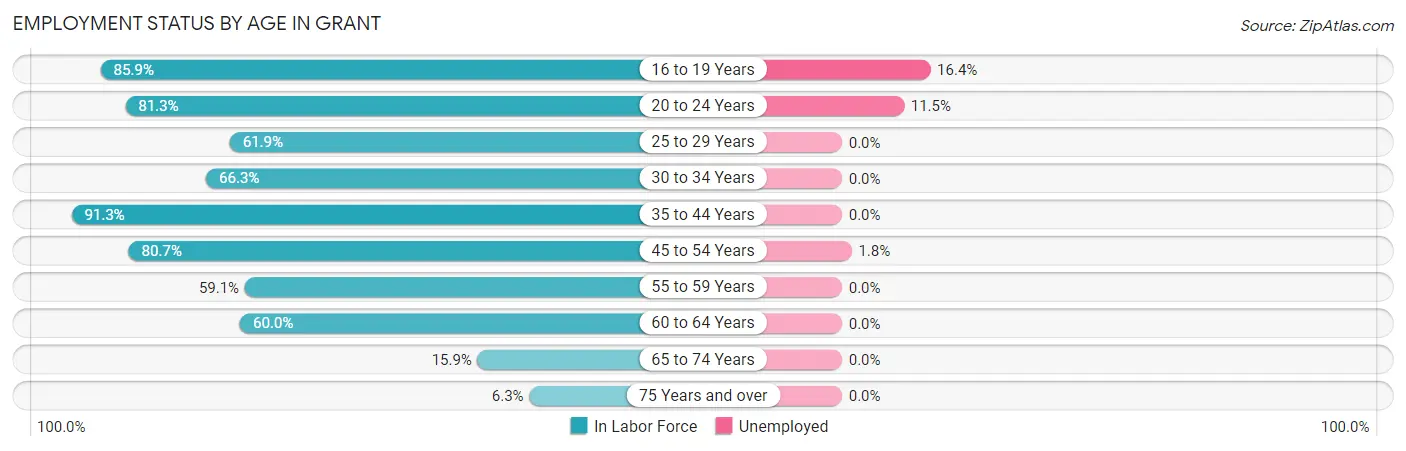
| Age Bracket | In Labor Force | Unemployed |
| 16 to 19 Years | 61 (85.9%) | 10 (16.4%) |
| 20 to 24 Years | 26 (81.3%) | 3 (11.5%) |
| 25 to 29 Years | 185 (61.9%) | 0 (0.0%) |
| 30 to 34 Years | 61 (66.3%) | 0 (0.0%) |
| 35 to 44 Years | 137 (91.3%) | 0 (0.0%) |
| 45 to 54 Years | 113 (80.7%) | 2 (1.8%) |
| 55 to 59 Years | 39 (59.1%) | 0 (0.0%) |
| 60 to 64 Years | 42 (60.0%) | 0 (0.0%) |
| 65 to 74 Years | 22 (15.9%) | 0 (0.0%) |
| 75 Years and over | 5 (6.3%) | 0 (0.0%) |
| Total | 691 (60.8%) | 15 (2.2%) |
Employment Status by Educational Attainment in Grant
According to labor force statistics for Grant, 70.6% of individuals (577) out of the total population between 25 and 64 years of age (817) are in the labor force, with 0.3% or 2 of them being unemployed. The group with the highest labor force participation rate are those with the educational attainment of bachelor's degree or higher, with 87.0% or 207 individuals in the labor force. Within the labor force, individuals with college / associate degree education have the highest percentage of unemployment, with 0.9% or 2 of them being unemployed.
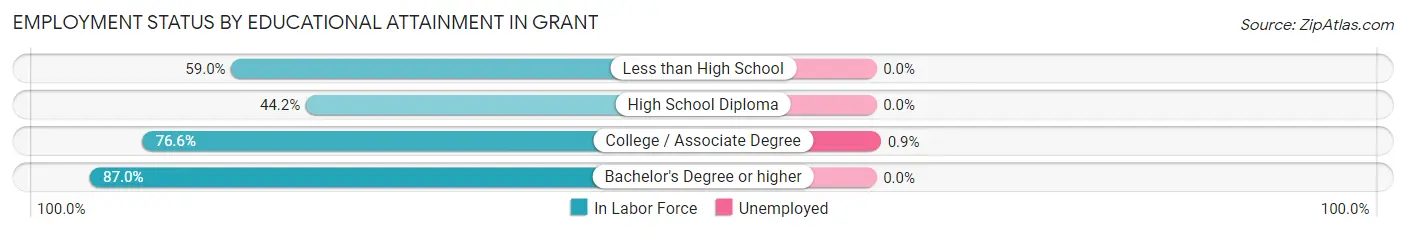
| Educational Attainment | In Labor Force | Unemployed |
| Less than High School | 69 (59.0%) | 0 (0.0%) |
| High School Diploma | 72 (44.2%) | 0 (0.0%) |
| College / Associate Degree | 229 (76.6%) | 3 (0.9%) |
| Bachelor's Degree or higher | 207 (87.0%) | 0 (0.0%) |
| Total | 577 (70.6%) | 2 (0.3%) |
Employment Occupations by Sex in Grant
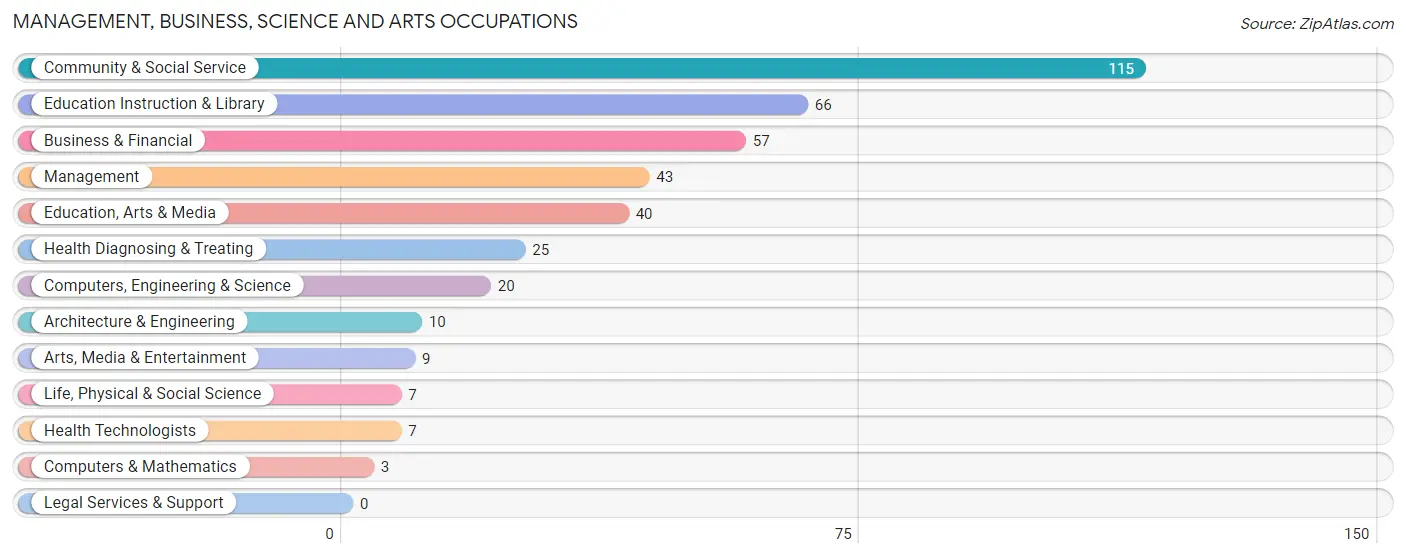
Management, Business, Science and Arts Occupations
The most common Management, Business, Science and Arts occupations in Grant are Community & Social Service (115 | 17.0%), Education Instruction & Library (66 | 9.8%), Business & Financial (57 | 8.4%), Management (43 | 6.4%), and Education, Arts & Media (40 | 5.9%).
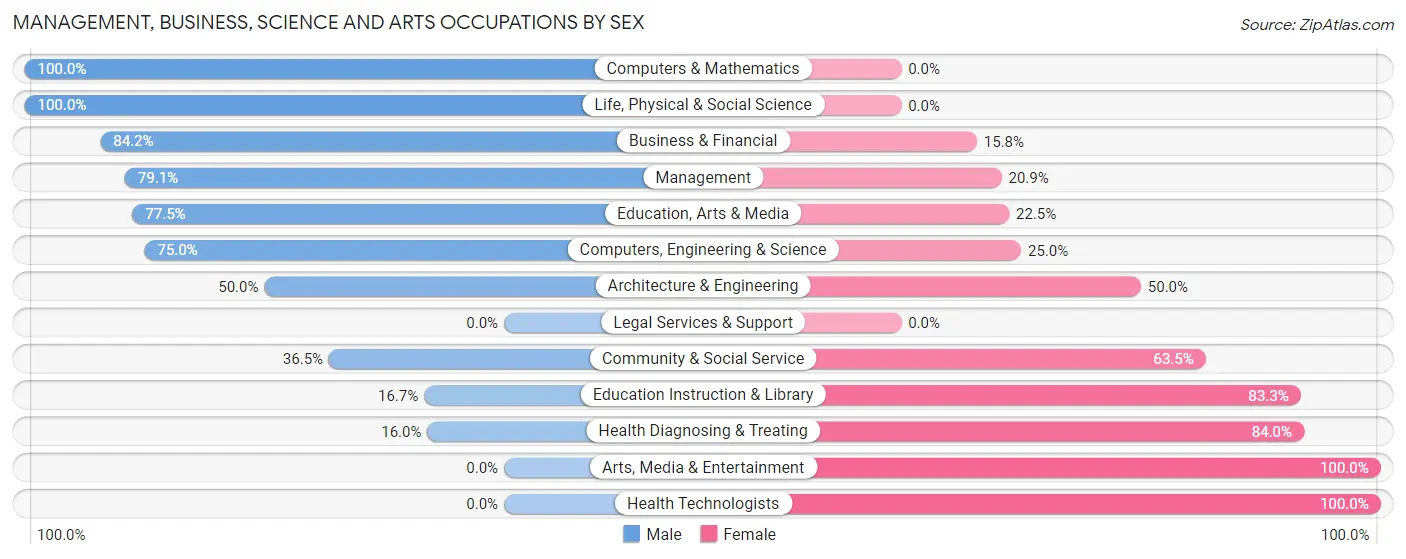
Management, Business, Science and Arts Occupations by Sex
Within the Management, Business, Science and Arts occupations in Grant, the most male-oriented occupations are Computers & Mathematics (100.0%), Life, Physical & Social Science (100.0%), and Business & Financial (84.2%), while the most female-oriented occupations are Arts, Media & Entertainment (100.0%), Health Technologists (100.0%), and Health Diagnosing & Treating (84.0%).
| Occupation | Male | Female |
| Management | 34 (79.1%) | 9 (20.9%) |
| Business & Financial | 48 (84.2%) | 9 (15.8%) |
| Computers, Engineering & Science | 15 (75.0%) | 5 (25.0%) |
| Computers & Mathematics | 3 (100.0%) | 0 (0.0%) |
| Architecture & Engineering | 5 (50.0%) | 5 (50.0%) |
| Life, Physical & Social Science | 7 (100.0%) | 0 (0.0%) |
| Community & Social Service | 42 (36.5%) | 73 (63.5%) |
| Education, Arts & Media | 31 (77.5%) | 9 (22.5%) |
| Legal Services & Support | 0 (0.0%) | 0 (0.0%) |
| Education Instruction & Library | 11 (16.7%) | 55 (83.3%) |
| Arts, Media & Entertainment | 0 (0.0%) | 9 (100.0%) |
| Health Diagnosing & Treating | 4 (16.0%) | 21 (84.0%) |
| Health Technologists | 0 (0.0%) | 7 (100.0%) |
| Total (Category) | 143 (55.0%) | 117 (45.0%) |
| Total (Overall) | 364 (53.8%) | 312 (46.2%) |
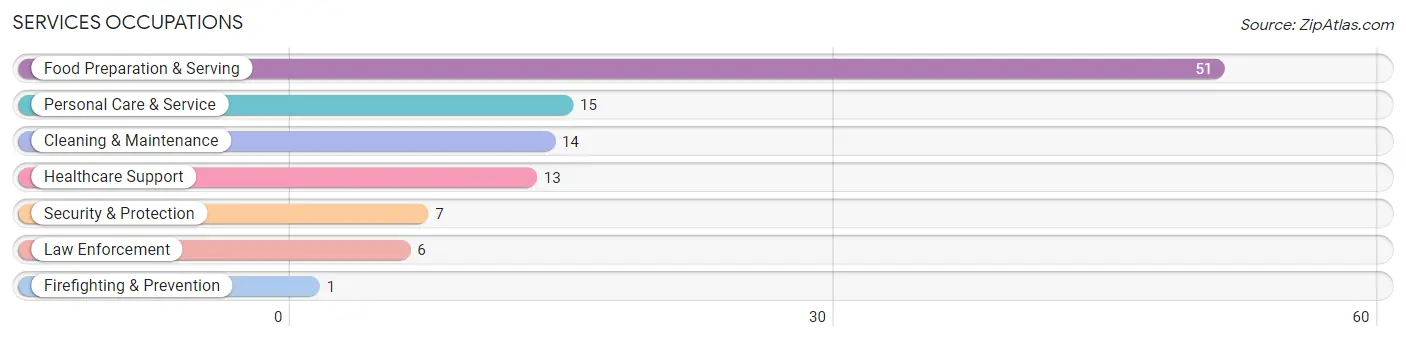
Services Occupations
The most common Services occupations in Grant are Food Preparation & Serving (51 | 7.5%), Personal Care & Service (15 | 2.2%), Cleaning & Maintenance (14 | 2.1%), Healthcare Support (13 | 1.9%), and Security & Protection (7 | 1.0%).
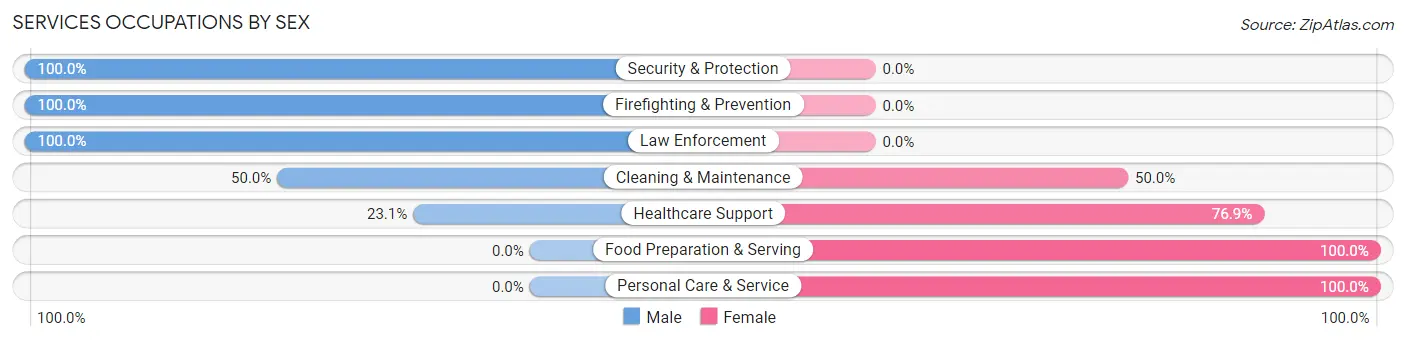
Services Occupations by Sex
Within the Services occupations in Grant, the most male-oriented occupations are Security & Protection (100.0%), Firefighting & Prevention (100.0%), and Law Enforcement (100.0%), while the most female-oriented occupations are Food Preparation & Serving (100.0%), Personal Care & Service (100.0%), and Healthcare Support (76.9%).
| Occupation | Male | Female |
| Healthcare Support | 3 (23.1%) | 10 (76.9%) |
| Security & Protection | 7 (100.0%) | 0 (0.0%) |
| Firefighting & Prevention | 1 (100.0%) | 0 (0.0%) |
| Law Enforcement | 6 (100.0%) | 0 (0.0%) |
| Food Preparation & Serving | 0 (0.0%) | 51 (100.0%) |
| Cleaning & Maintenance | 7 (50.0%) | 7 (50.0%) |
| Personal Care & Service | 0 (0.0%) | 15 (100.0%) |
| Total (Category) | 17 (17.0%) | 83 (83.0%) |
| Total (Overall) | 364 (53.8%) | 312 (46.2%) |
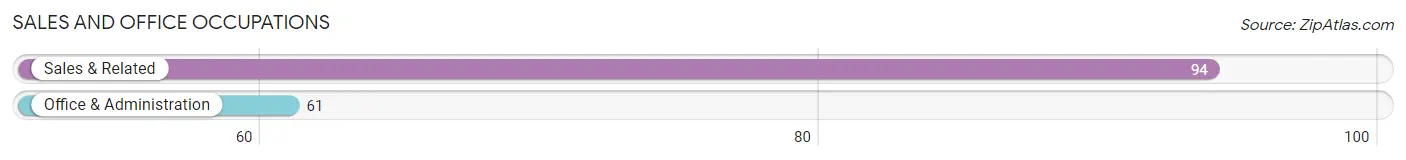
Sales and Office Occupations
The most common Sales and Office occupations in Grant are Sales & Related (94 | 13.9%), and Office & Administration (61 | 9.0%).
Sales and Office Occupations by Sex
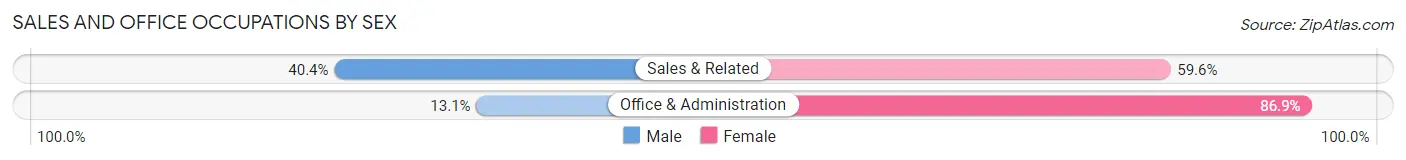
| Occupation | Male | Female |
| Sales & Related | 38 (40.4%) | 56 (59.6%) |
| Office & Administration | 8 (13.1%) | 53 (86.9%) |
| Total (Category) | 46 (29.7%) | 109 (70.3%) |
| Total (Overall) | 364 (53.8%) | 312 (46.2%) |
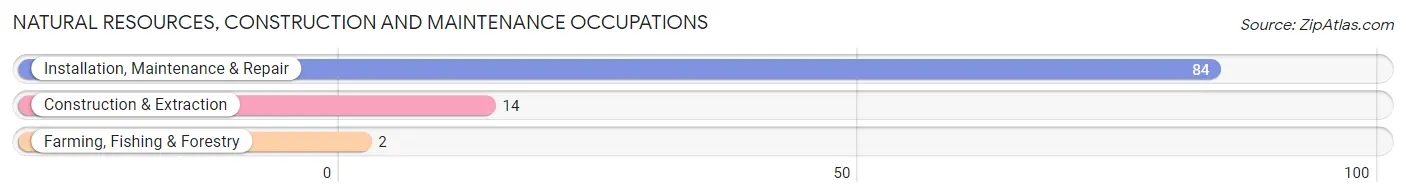
Natural Resources, Construction and Maintenance Occupations
The most common Natural Resources, Construction and Maintenance occupations in Grant are Installation, Maintenance & Repair (84 | 12.4%), Construction & Extraction (14 | 2.1%), and Farming, Fishing & Forestry (2 | 0.3%).
Natural Resources, Construction and Maintenance Occupations by Sex
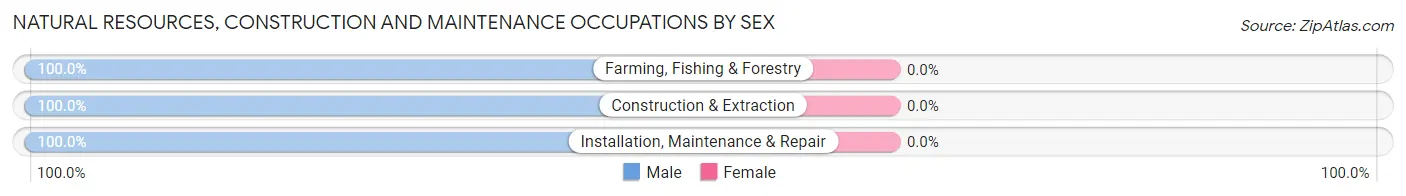
| Occupation | Male | Female |
| Farming, Fishing & Forestry | 2 (100.0%) | 0 (0.0%) |
| Construction & Extraction | 14 (100.0%) | 0 (0.0%) |
| Installation, Maintenance & Repair | 84 (100.0%) | 0 (0.0%) |
| Total (Category) | 100 (100.0%) | 0 (0.0%) |
| Total (Overall) | 364 (53.8%) | 312 (46.2%) |
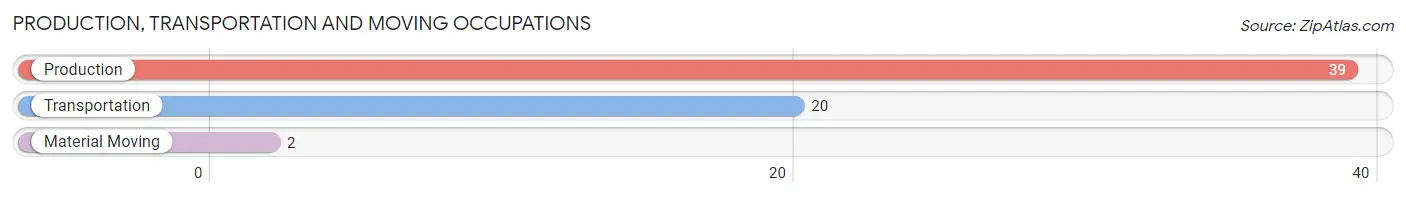
Production, Transportation and Moving Occupations
The most common Production, Transportation and Moving occupations in Grant are Production (39 | 5.8%), Transportation (20 | 3.0%), and Material Moving (2 | 0.3%).
Production, Transportation and Moving Occupations by Sex
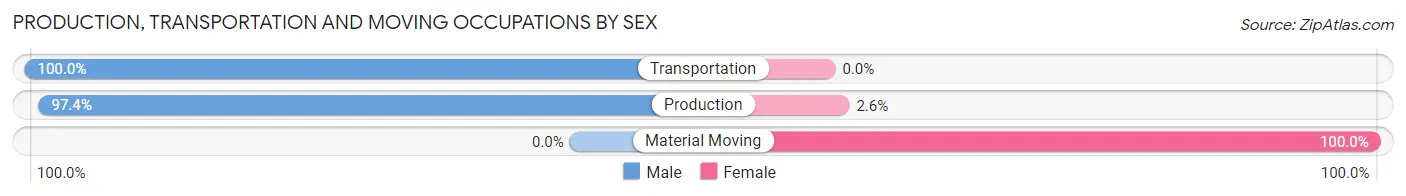
| Occupation | Male | Female |
| Production | 38 (97.4%) | 1 (2.6%) |
| Transportation | 20 (100.0%) | 0 (0.0%) |
| Material Moving | 0 (0.0%) | 2 (100.0%) |
| Total (Category) | 58 (95.1%) | 3 (4.9%) |
| Total (Overall) | 364 (53.8%) | 312 (46.2%) |
Employment Industries by Sex in Grant
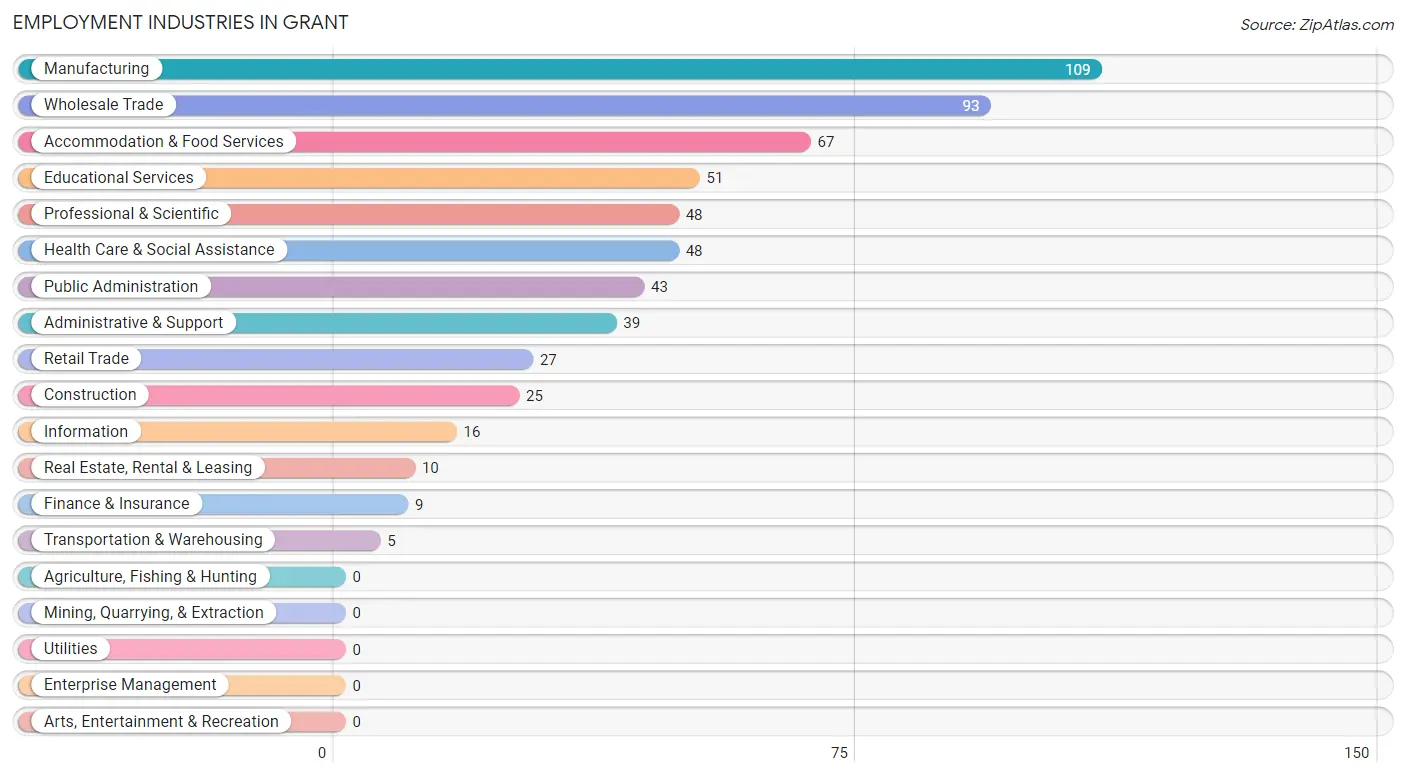
Employment Industries in Grant
The major employment industries in Grant include Manufacturing (109 | 16.1%), Wholesale Trade (93 | 13.8%), Accommodation & Food Services (67 | 9.9%), Educational Services (51 | 7.5%), and Professional & Scientific (48 | 7.1%).
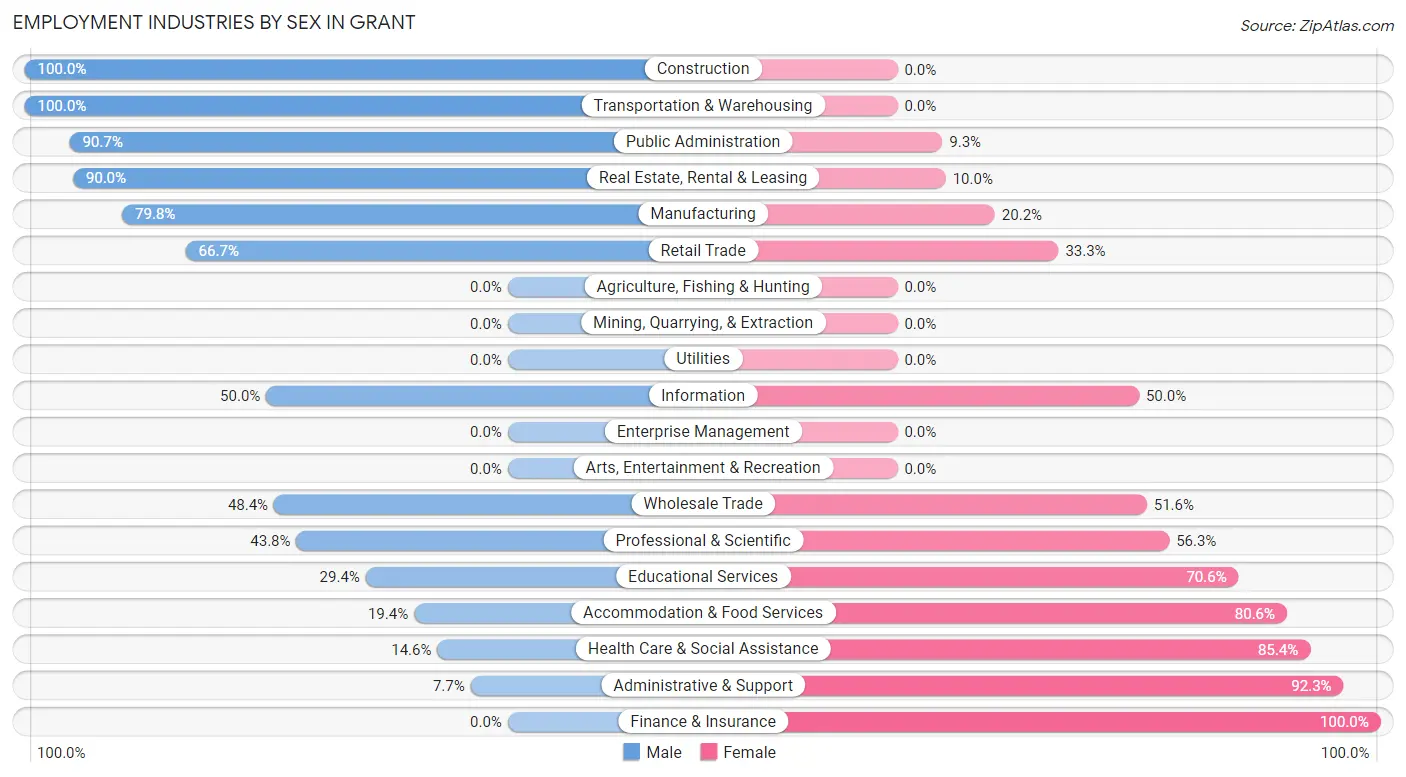
Employment Industries by Sex in Grant
The Grant industries that see more men than women are Construction (100.0%), Transportation & Warehousing (100.0%), and Public Administration (90.7%), whereas the industries that tend to have a higher number of women are Finance & Insurance (100.0%), Administrative & Support (92.3%), and Health Care & Social Assistance (85.4%).
| Industry | Male | Female |
| Agriculture, Fishing & Hunting | 0 (0.0%) | 0 (0.0%) |
| Mining, Quarrying, & Extraction | 0 (0.0%) | 0 (0.0%) |
| Construction | 25 (100.0%) | 0 (0.0%) |
| Manufacturing | 87 (79.8%) | 22 (20.2%) |
| Wholesale Trade | 45 (48.4%) | 48 (51.6%) |
| Retail Trade | 18 (66.7%) | 9 (33.3%) |
| Transportation & Warehousing | 5 (100.0%) | 0 (0.0%) |
| Utilities | 0 (0.0%) | 0 (0.0%) |
| Information | 8 (50.0%) | 8 (50.0%) |
| Finance & Insurance | 0 (0.0%) | 9 (100.0%) |
| Real Estate, Rental & Leasing | 9 (90.0%) | 1 (10.0%) |
| Professional & Scientific | 21 (43.8%) | 27 (56.2%) |
| Enterprise Management | 0 (0.0%) | 0 (0.0%) |
| Administrative & Support | 3 (7.7%) | 36 (92.3%) |
| Educational Services | 15 (29.4%) | 36 (70.6%) |
| Health Care & Social Assistance | 7 (14.6%) | 41 (85.4%) |
| Arts, Entertainment & Recreation | 0 (0.0%) | 0 (0.0%) |
| Accommodation & Food Services | 13 (19.4%) | 54 (80.6%) |
| Public Administration | 39 (90.7%) | 4 (9.3%) |
| Total | 364 (53.8%) | 312 (46.2%) |
Education in Grant
School Enrollment in Grant
The most common levels of schooling among the 477 students in Grant are middle school (124 | 26.0%), kindergarten (114 | 23.9%), and elementary school (80 | 16.8%).
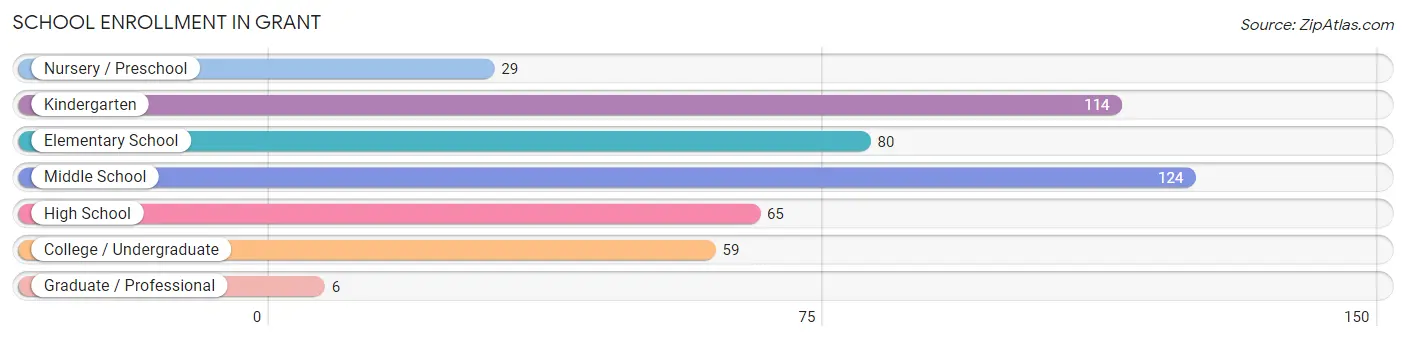
| School Level | # Students | % Students |
| Nursery / Preschool | 29 | 6.1% |
| Kindergarten | 114 | 23.9% |
| Elementary School | 80 | 16.8% |
| Middle School | 124 | 26.0% |
| High School | 65 | 13.6% |
| College / Undergraduate | 59 | 12.4% |
| Graduate / Professional | 6 | 1.3% |
| Total | 477 | 100.0% |
School Enrollment by Age by Funding Source in Grant
Out of a total of 477 students who are enrolled in schools in Grant, 12 (2.5%) attend a private institution, while the remaining 465 (97.5%) are enrolled in public schools. The age group of 20 to 24 year olds has the highest likelihood of being enrolled in private schools, with 2 (16.7% in the age bracket) enrolled. Conversely, the age group of 3 to 4 year olds has the lowest likelihood of being enrolled in a private school, with 28 (100.0% in the age bracket) attending a public institution.
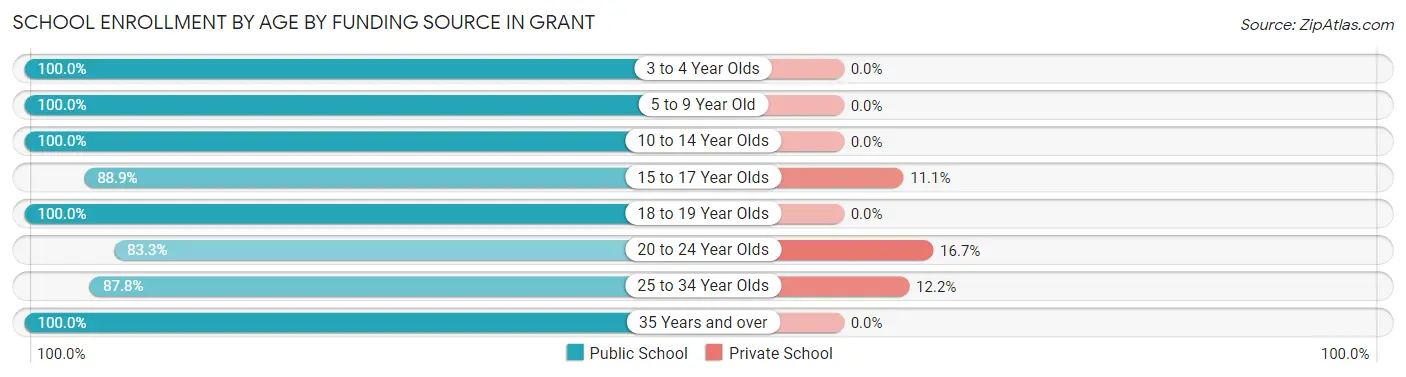
| Age Bracket | Public School | Private School |
| 3 to 4 Year Olds | 28 (100.0%) | 0 (0.0%) |
| 5 to 9 Year Old | 167 (100.0%) | 0 (0.0%) |
| 10 to 14 Year Olds | 127 (100.0%) | 0 (0.0%) |
| 15 to 17 Year Olds | 40 (88.9%) | 5 (11.1%) |
| 18 to 19 Year Olds | 49 (100.0%) | 0 (0.0%) |
| 20 to 24 Year Olds | 10 (83.3%) | 2 (16.7%) |
| 25 to 34 Year Olds | 36 (87.8%) | 5 (12.2%) |
| 35 Years and over | 8 (100.0%) | 0 (0.0%) |
| Total | 465 (97.5%) | 12 (2.5%) |
Educational Attainment by Field of Study in Grant
Psychology (66 | 23.2%), education (43 | 15.1%), science & technology (42 | 14.8%), engineering (33 | 11.6%), and business (32 | 11.3%) are the most common fields of study among 284 individuals in Grant who have obtained a bachelor's degree or higher.
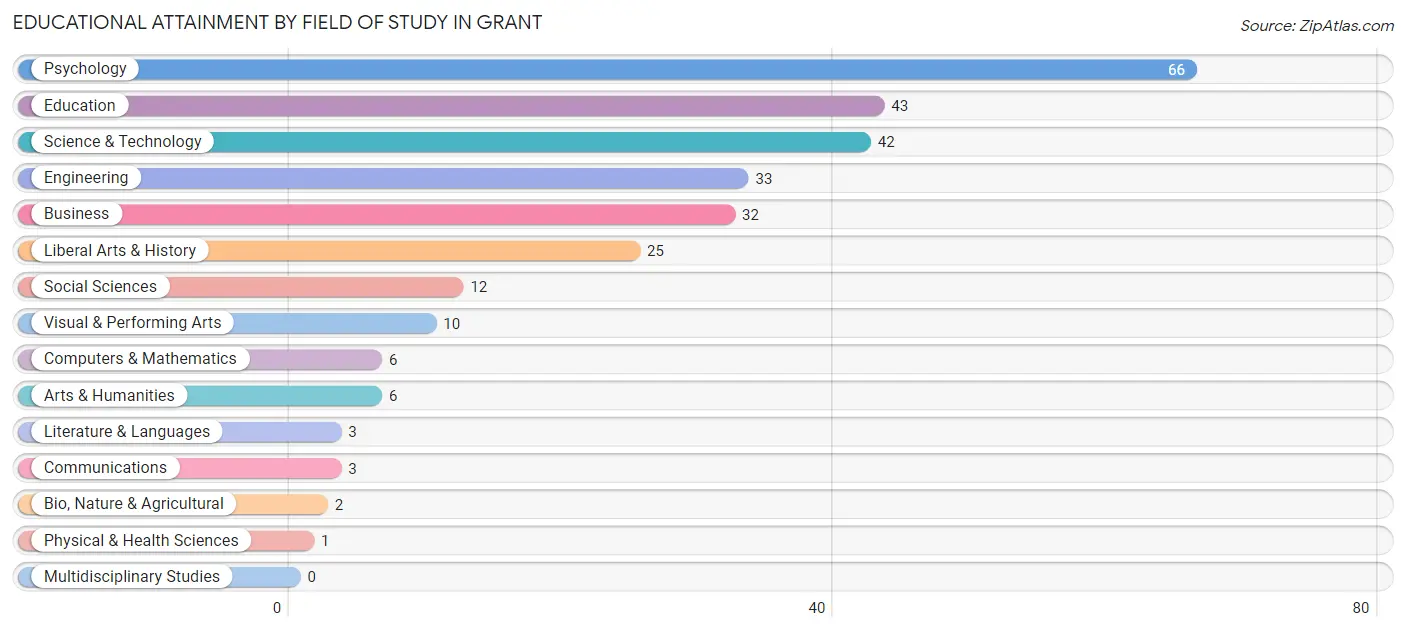
| Field of Study | # Graduates | % Graduates |
| Computers & Mathematics | 6 | 2.1% |
| Bio, Nature & Agricultural | 2 | 0.7% |
| Physical & Health Sciences | 1 | 0.4% |
| Psychology | 66 | 23.2% |
| Social Sciences | 12 | 4.2% |
| Engineering | 33 | 11.6% |
| Multidisciplinary Studies | 0 | 0.0% |
| Science & Technology | 42 | 14.8% |
| Business | 32 | 11.3% |
| Education | 43 | 15.1% |
| Literature & Languages | 3 | 1.1% |
| Liberal Arts & History | 25 | 8.8% |
| Visual & Performing Arts | 10 | 3.5% |
| Communications | 3 | 1.1% |
| Arts & Humanities | 6 | 2.1% |
| Total | 284 | 100.0% |
Transportation & Commute in Grant
Vehicle Availability by Sex in Grant
The most prevalent vehicle ownership categories in Grant are males with 2 vehicles (115, accounting for 31.6%) and females with 2 vehicles (53, making up 37.5%).
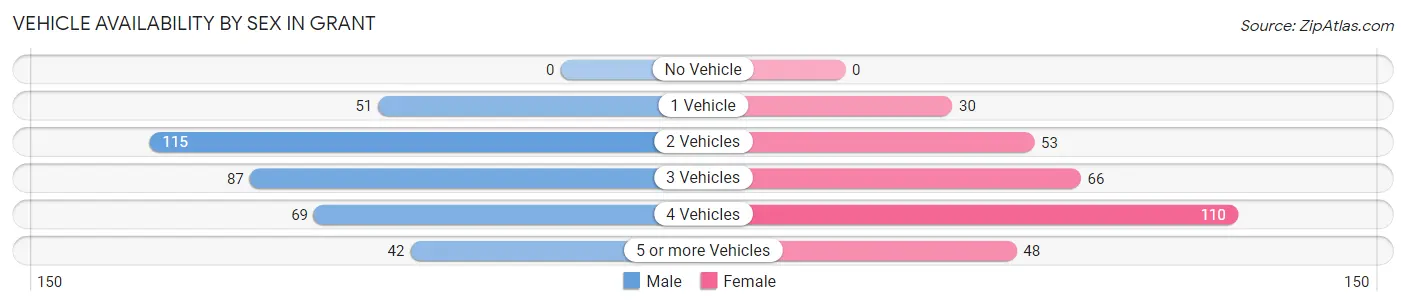
| Vehicles Available | Male | Female |
| No Vehicle | 0 (0.0%) | 0 (0.0%) |
| 1 Vehicle | 51 (14.0%) | 30 (9.8%) |
| 2 Vehicles | 115 (31.6%) | 53 (17.3%) |
| 3 Vehicles | 87 (23.9%) | 66 (21.5%) |
| 4 Vehicles | 69 (19.0%) | 110 (35.8%) |
| 5 or more Vehicles | 42 (11.5%) | 48 (15.6%) |
| Total | 364 (100.0%) | 307 (100.0%) |
Commute Time in Grant
The most frequently occuring commute durations in Grant are 35 to 39 minutes (137 commuters, 21.0%), 15 to 19 minutes (95 commuters, 14.6%), and 20 to 24 minutes (85 commuters, 13.1%).
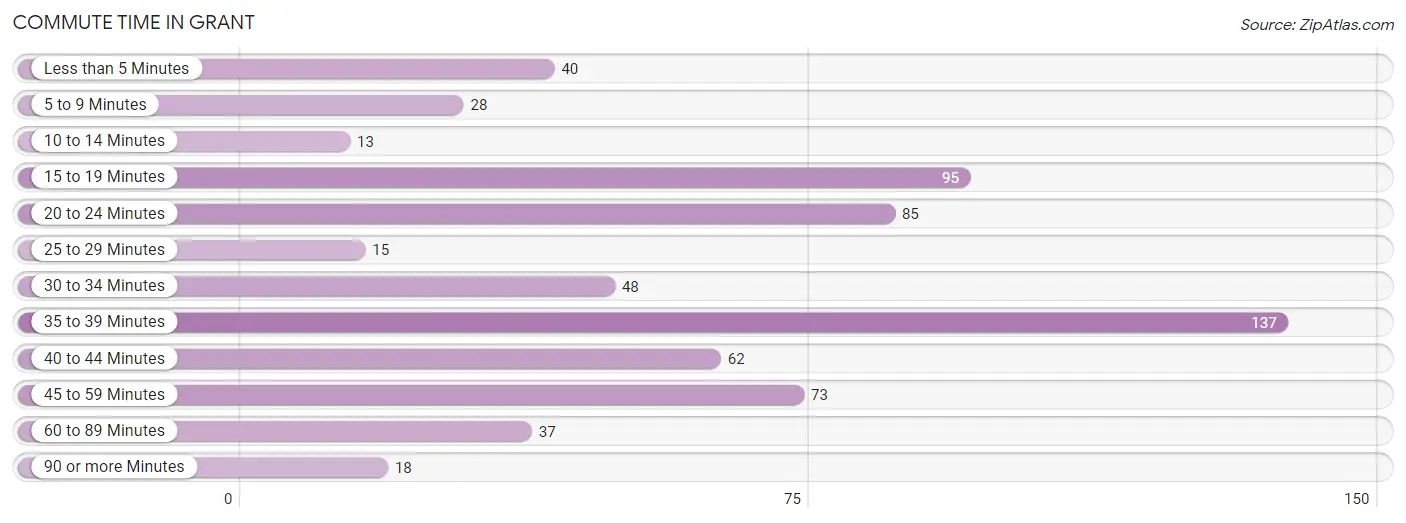
| Commute Time | # Commuters | % Commuters |
| Less than 5 Minutes | 40 | 6.1% |
| 5 to 9 Minutes | 28 | 4.3% |
| 10 to 14 Minutes | 13 | 2.0% |
| 15 to 19 Minutes | 95 | 14.6% |
| 20 to 24 Minutes | 85 | 13.1% |
| 25 to 29 Minutes | 15 | 2.3% |
| 30 to 34 Minutes | 48 | 7.4% |
| 35 to 39 Minutes | 137 | 21.0% |
| 40 to 44 Minutes | 62 | 9.5% |
| 45 to 59 Minutes | 73 | 11.2% |
| 60 to 89 Minutes | 37 | 5.7% |
| 90 or more Minutes | 18 | 2.8% |
Commute Time by Sex in Grant
The most common commute times in Grant are 15 to 19 minutes (89 commuters, 24.5%) for males and 35 to 39 minutes (96 commuters, 33.3%) for females.
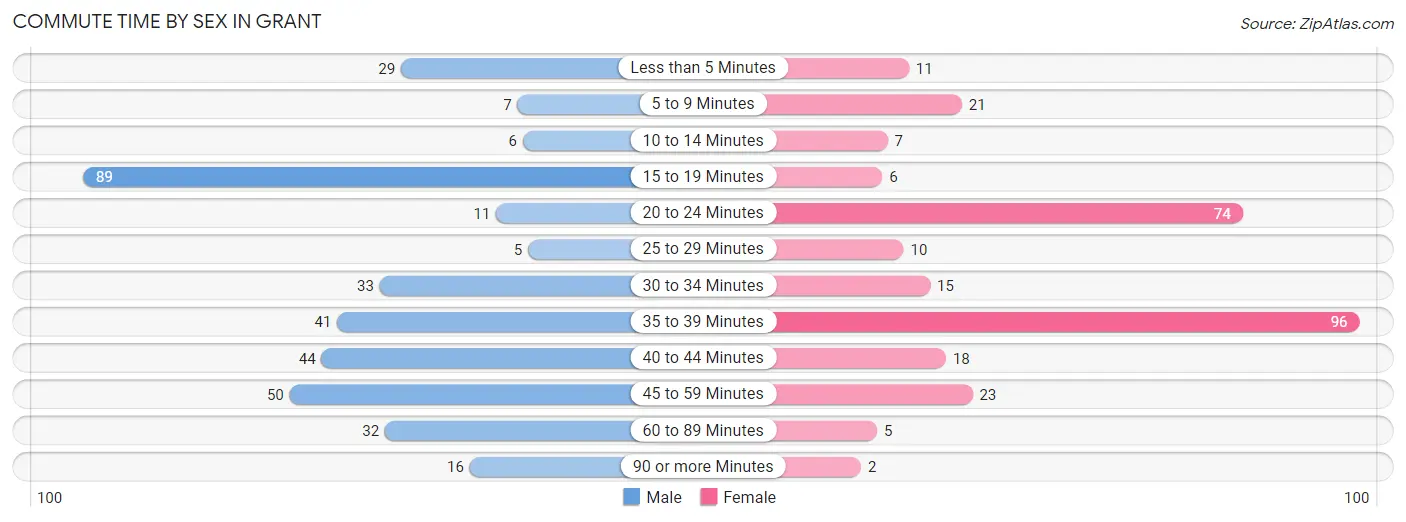
| Commute Time | Male | Female |
| Less than 5 Minutes | 29 (8.0%) | 11 (3.8%) |
| 5 to 9 Minutes | 7 (1.9%) | 21 (7.3%) |
| 10 to 14 Minutes | 6 (1.7%) | 7 (2.4%) |
| 15 to 19 Minutes | 89 (24.5%) | 6 (2.1%) |
| 20 to 24 Minutes | 11 (3.0%) | 74 (25.7%) |
| 25 to 29 Minutes | 5 (1.4%) | 10 (3.5%) |
| 30 to 34 Minutes | 33 (9.1%) | 15 (5.2%) |
| 35 to 39 Minutes | 41 (11.3%) | 96 (33.3%) |
| 40 to 44 Minutes | 44 (12.1%) | 18 (6.2%) |
| 45 to 59 Minutes | 50 (13.8%) | 23 (8.0%) |
| 60 to 89 Minutes | 32 (8.8%) | 5 (1.7%) |
| 90 or more Minutes | 16 (4.4%) | 2 (0.7%) |
Time of Departure to Work by Sex in Grant
The most frequent times of departure to work in Grant are 8:00 AM to 8:29 AM (77, 21.2%) for males and 6:00 AM to 6:29 AM (98, 34.0%) for females.
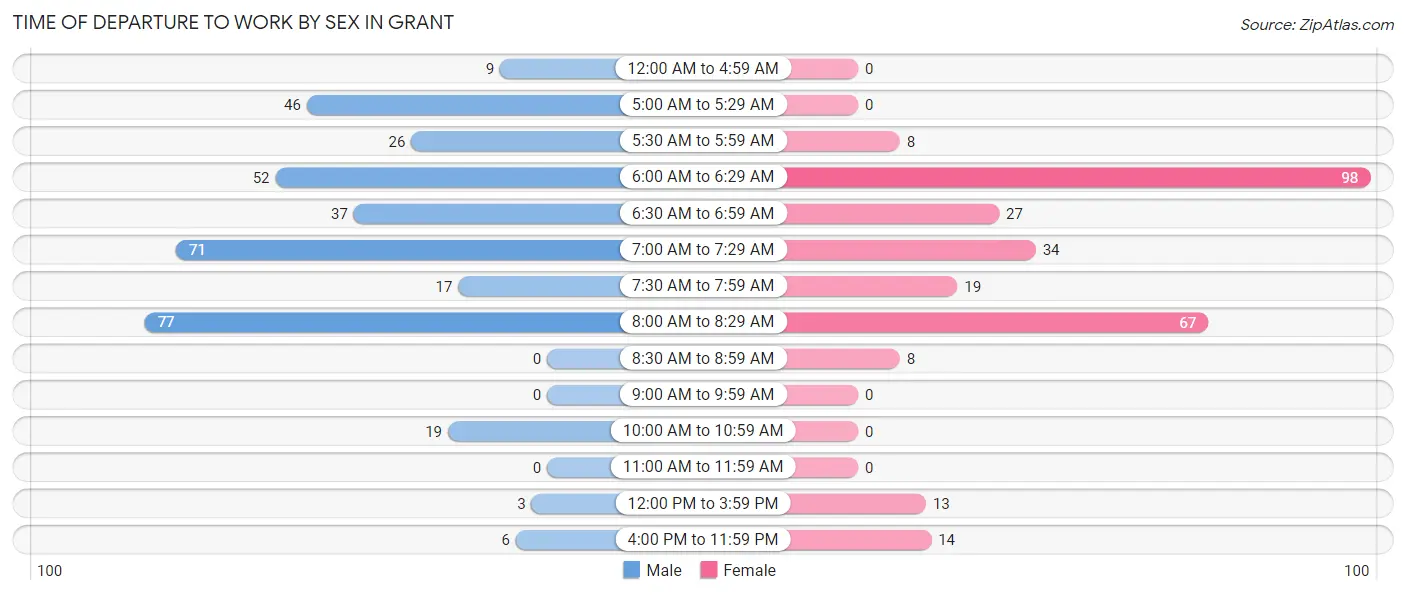
| Time of Departure | Male | Female |
| 12:00 AM to 4:59 AM | 9 (2.5%) | 0 (0.0%) |
| 5:00 AM to 5:29 AM | 46 (12.7%) | 0 (0.0%) |
| 5:30 AM to 5:59 AM | 26 (7.2%) | 8 (2.8%) |
| 6:00 AM to 6:29 AM | 52 (14.3%) | 98 (34.0%) |
| 6:30 AM to 6:59 AM | 37 (10.2%) | 27 (9.4%) |
| 7:00 AM to 7:29 AM | 71 (19.6%) | 34 (11.8%) |
| 7:30 AM to 7:59 AM | 17 (4.7%) | 19 (6.6%) |
| 8:00 AM to 8:29 AM | 77 (21.2%) | 67 (23.3%) |
| 8:30 AM to 8:59 AM | 0 (0.0%) | 8 (2.8%) |
| 9:00 AM to 9:59 AM | 0 (0.0%) | 0 (0.0%) |
| 10:00 AM to 10:59 AM | 19 (5.2%) | 0 (0.0%) |
| 11:00 AM to 11:59 AM | 0 (0.0%) | 0 (0.0%) |
| 12:00 PM to 3:59 PM | 3 (0.8%) | 13 (4.5%) |
| 4:00 PM to 11:59 PM | 6 (1.7%) | 14 (4.9%) |
| Total | 363 (100.0%) | 288 (100.0%) |
Housing Occupancy in Grant
Occupancy by Ownership in Grant
Of the total 517 dwellings in Grant, owner-occupied units account for 413 (79.9%), while renter-occupied units make up 104 (20.1%).
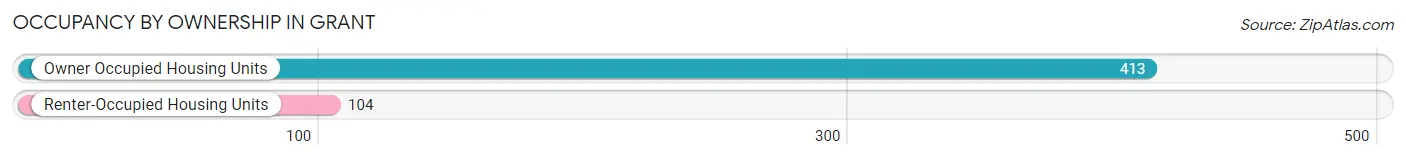
| Occupancy | # Housing Units | % Housing Units |
| Owner Occupied Housing Units | 413 | 79.9% |
| Renter-Occupied Housing Units | 104 | 20.1% |
| Total Occupied Housing Units | 517 | 100.0% |
Occupancy by Household Size in Grant
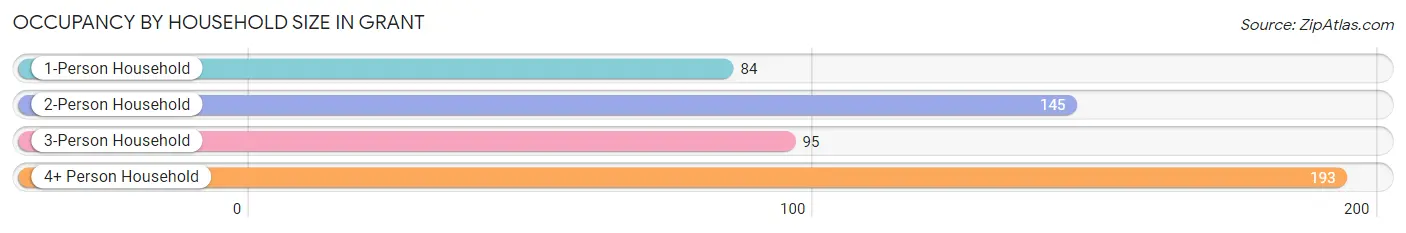
| Household Size | # Housing Units | % Housing Units |
| 1-Person Household | 84 | 16.3% |
| 2-Person Household | 145 | 28.1% |
| 3-Person Household | 95 | 18.4% |
| 4+ Person Household | 193 | 37.3% |
| Total Housing Units | 517 | 100.0% |
Occupancy by Ownership by Household Size in Grant
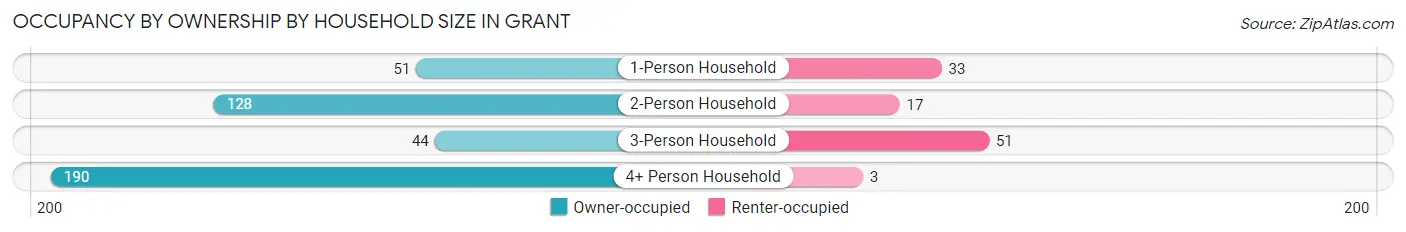
| Household Size | Owner-occupied | Renter-occupied |
| 1-Person Household | 51 (60.7%) | 33 (39.3%) |
| 2-Person Household | 128 (88.3%) | 17 (11.7%) |
| 3-Person Household | 44 (46.3%) | 51 (53.7%) |
| 4+ Person Household | 190 (98.5%) | 3 (1.5%) |
| Total Housing Units | 413 (79.9%) | 104 (20.1%) |
Occupancy by Educational Attainment in Grant
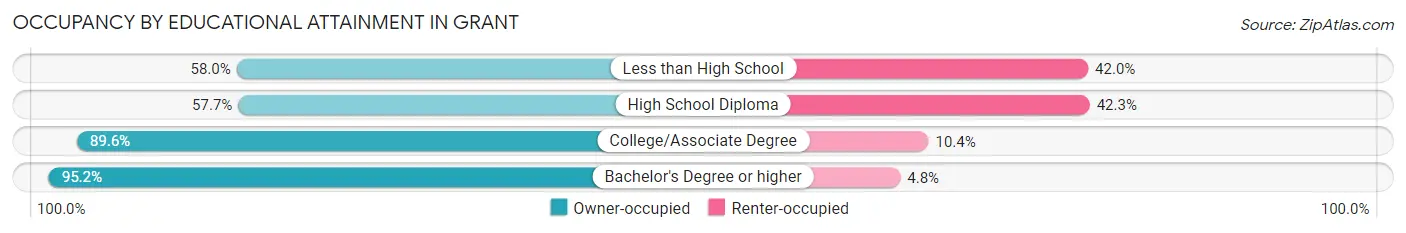
| Household Size | Owner-occupied | Renter-occupied |
| Less than High School | 40 (58.0%) | 29 (42.0%) |
| High School Diploma | 64 (57.7%) | 47 (42.3%) |
| College/Associate Degree | 190 (89.6%) | 22 (10.4%) |
| Bachelor's Degree or higher | 119 (95.2%) | 6 (4.8%) |
Occupancy by Age of Householder in Grant
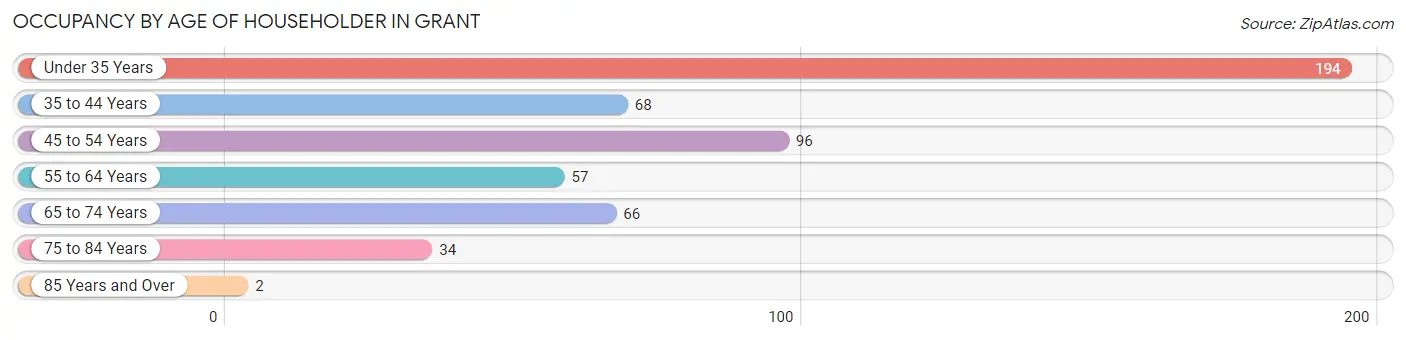
| Age Bracket | # Households | % Households |
| Under 35 Years | 194 | 37.5% |
| 35 to 44 Years | 68 | 13.2% |
| 45 to 54 Years | 96 | 18.6% |
| 55 to 64 Years | 57 | 11.0% |
| 65 to 74 Years | 66 | 12.8% |
| 75 to 84 Years | 34 | 6.6% |
| 85 Years and Over | 2 | 0.4% |
| Total | 517 | 100.0% |
Housing Finances in Grant
Median Income by Occupancy in Grant
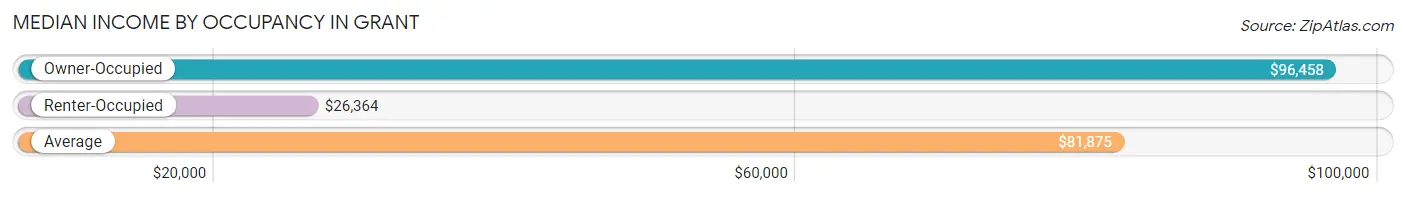
| Occupancy Type | # Households | Median Income |
| Owner-Occupied | 413 (79.9%) | $96,458 |
| Renter-Occupied | 104 (20.1%) | $26,364 |
| Average | 517 (100.0%) | $81,875 |
Occupancy by Householder Income Bracket in Grant
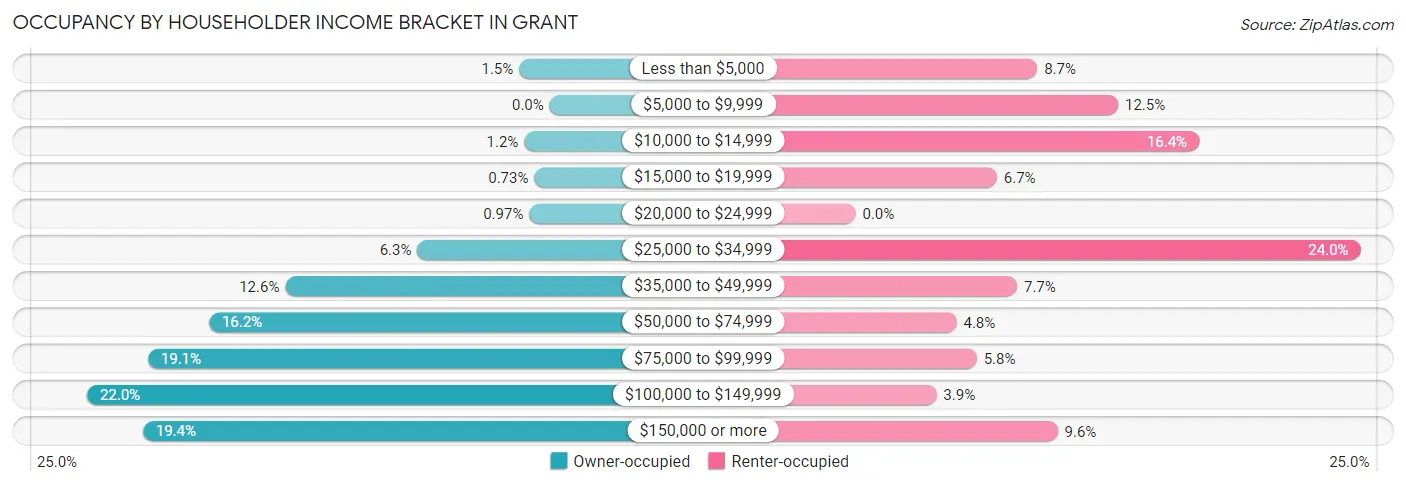
| Income Bracket | Owner-occupied | Renter-occupied |
| Less than $5,000 | 6 (1.5%) | 9 (8.6%) |
| $5,000 to $9,999 | 0 (0.0%) | 13 (12.5%) |
| $10,000 to $14,999 | 5 (1.2%) | 17 (16.4%) |
| $15,000 to $19,999 | 3 (0.7%) | 7 (6.7%) |
| $20,000 to $24,999 | 4 (1.0%) | 0 (0.0%) |
| $25,000 to $34,999 | 26 (6.3%) | 25 (24.0%) |
| $35,000 to $49,999 | 52 (12.6%) | 8 (7.7%) |
| $50,000 to $74,999 | 67 (16.2%) | 5 (4.8%) |
| $75,000 to $99,999 | 79 (19.1%) | 6 (5.8%) |
| $100,000 to $149,999 | 91 (22.0%) | 4 (3.8%) |
| $150,000 or more | 80 (19.4%) | 10 (9.6%) |
| Total | 413 (100.0%) | 104 (100.0%) |
Monthly Housing Cost Tiers in Grant
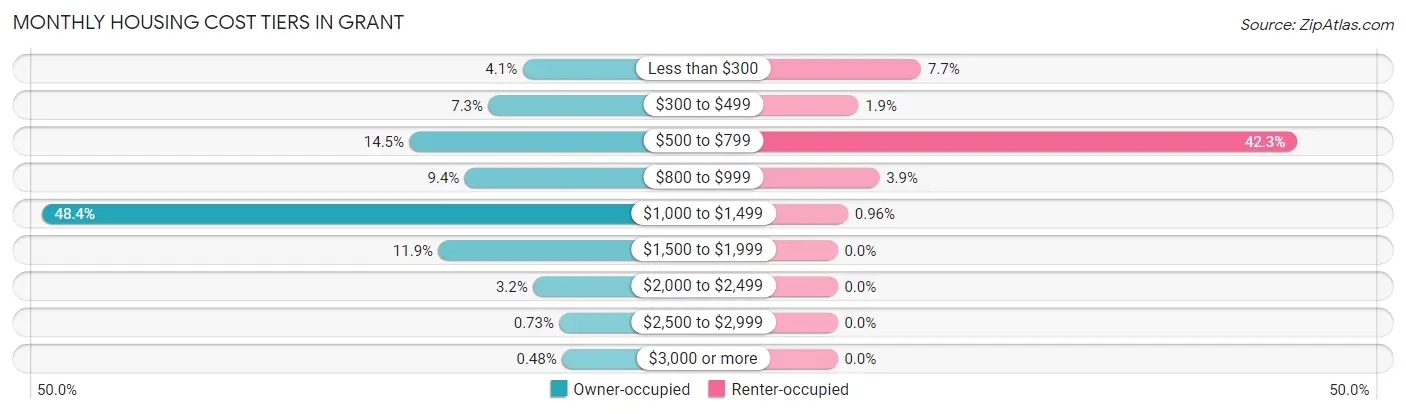
| Monthly Cost | Owner-occupied | Renter-occupied |
| Less than $300 | 17 (4.1%) | 8 (7.7%) |
| $300 to $499 | 30 (7.3%) | 2 (1.9%) |
| $500 to $799 | 60 (14.5%) | 44 (42.3%) |
| $800 to $999 | 39 (9.4%) | 4 (3.8%) |
| $1,000 to $1,499 | 200 (48.4%) | 1 (1.0%) |
| $1,500 to $1,999 | 49 (11.9%) | 0 (0.0%) |
| $2,000 to $2,499 | 13 (3.2%) | 0 (0.0%) |
| $2,500 to $2,999 | 3 (0.7%) | 0 (0.0%) |
| $3,000 or more | 2 (0.5%) | 0 (0.0%) |
| Total | 413 (100.0%) | 104 (100.0%) |
Physical Housing Characteristics in Grant
Housing Structures in Grant
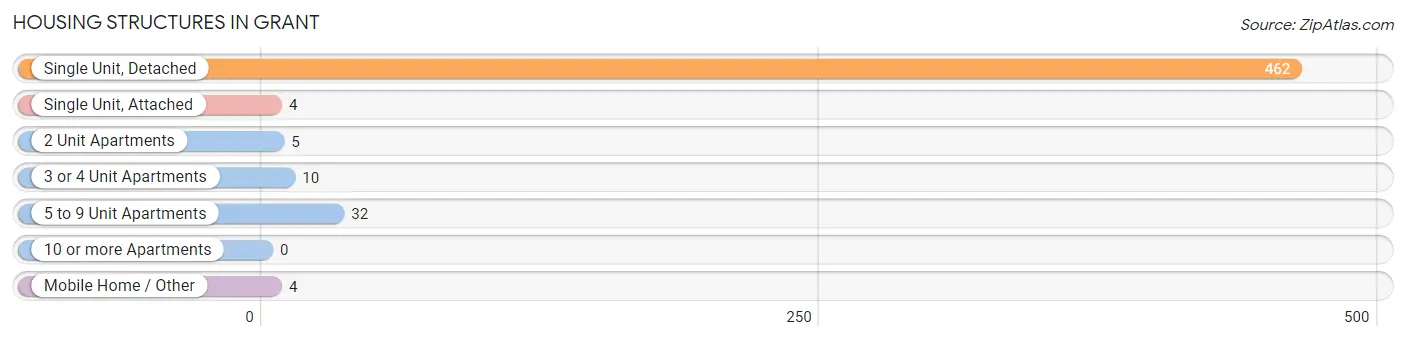
| Structure Type | # Housing Units | % Housing Units |
| Single Unit, Detached | 462 | 89.4% |
| Single Unit, Attached | 4 | 0.8% |
| 2 Unit Apartments | 5 | 1.0% |
| 3 or 4 Unit Apartments | 10 | 1.9% |
| 5 to 9 Unit Apartments | 32 | 6.2% |
| 10 or more Apartments | 0 | 0.0% |
| Mobile Home / Other | 4 | 0.8% |
| Total | 517 | 100.0% |
Housing Structures by Occupancy in Grant
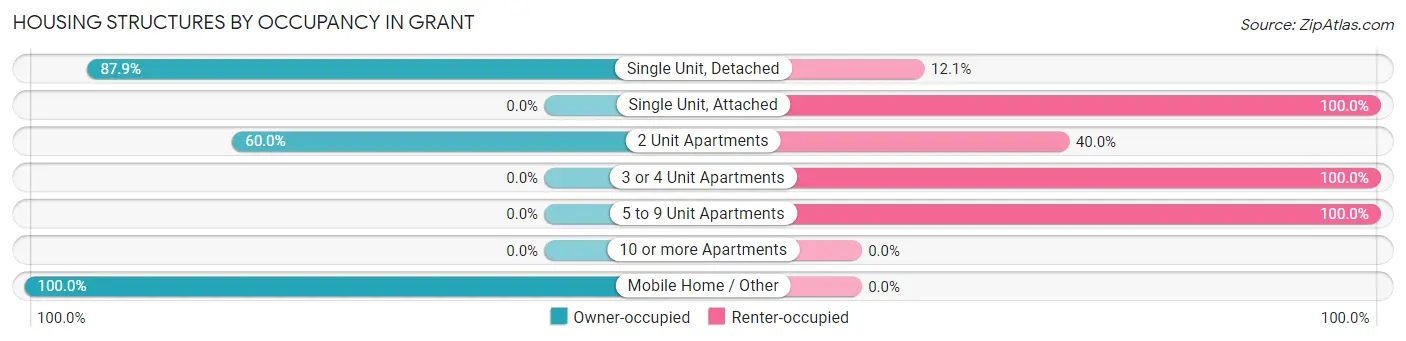
| Structure Type | Owner-occupied | Renter-occupied |
| Single Unit, Detached | 406 (87.9%) | 56 (12.1%) |
| Single Unit, Attached | 0 (0.0%) | 4 (100.0%) |
| 2 Unit Apartments | 3 (60.0%) | 2 (40.0%) |
| 3 or 4 Unit Apartments | 0 (0.0%) | 10 (100.0%) |
| 5 to 9 Unit Apartments | 0 (0.0%) | 32 (100.0%) |
| 10 or more Apartments | 0 (0.0%) | 0 (0.0%) |
| Mobile Home / Other | 4 (100.0%) | 0 (0.0%) |
| Total | 413 (79.9%) | 104 (20.1%) |
Housing Structures by Number of Rooms in Grant
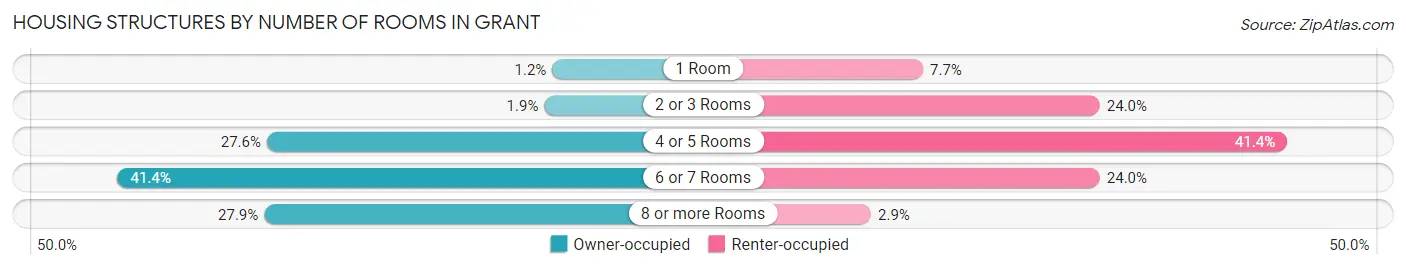
| Number of Rooms | Owner-occupied | Renter-occupied |
| 1 Room | 5 (1.2%) | 8 (7.7%) |
| 2 or 3 Rooms | 8 (1.9%) | 25 (24.0%) |
| 4 or 5 Rooms | 114 (27.6%) | 43 (41.3%) |
| 6 or 7 Rooms | 171 (41.4%) | 25 (24.0%) |
| 8 or more Rooms | 115 (27.9%) | 3 (2.9%) |
| Total | 413 (100.0%) | 104 (100.0%) |
Housing Structure by Heating Type in Grant
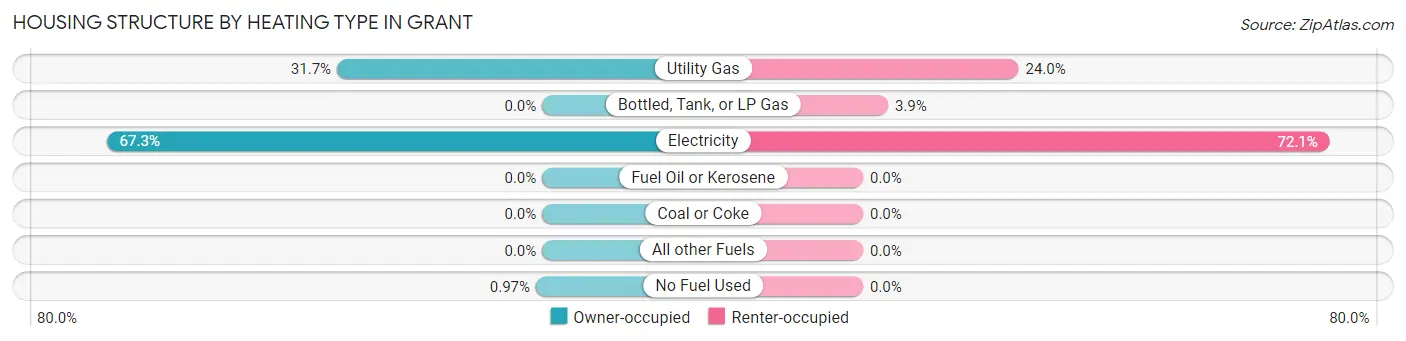
| Heating Type | Owner-occupied | Renter-occupied |
| Utility Gas | 131 (31.7%) | 25 (24.0%) |
| Bottled, Tank, or LP Gas | 0 (0.0%) | 4 (3.8%) |
| Electricity | 278 (67.3%) | 75 (72.1%) |
| Fuel Oil or Kerosene | 0 (0.0%) | 0 (0.0%) |
| Coal or Coke | 0 (0.0%) | 0 (0.0%) |
| All other Fuels | 0 (0.0%) | 0 (0.0%) |
| No Fuel Used | 4 (1.0%) | 0 (0.0%) |
| Total | 413 (100.0%) | 104 (100.0%) |
Household Vehicle Usage in Grant
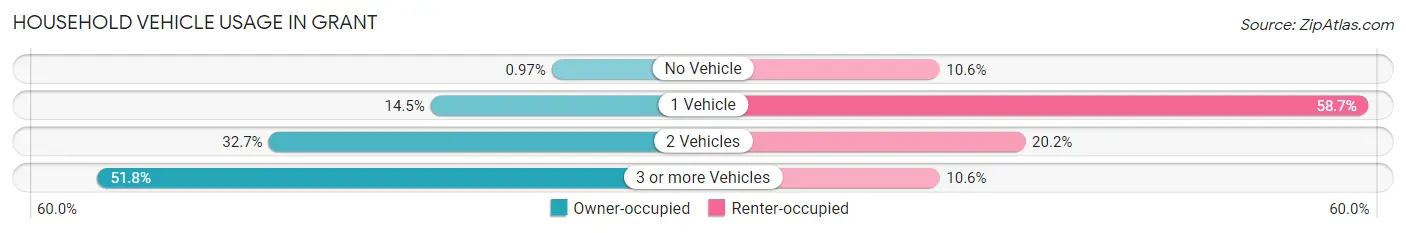
| Vehicles per Household | Owner-occupied | Renter-occupied |
| No Vehicle | 4 (1.0%) | 11 (10.6%) |
| 1 Vehicle | 60 (14.5%) | 61 (58.7%) |
| 2 Vehicles | 135 (32.7%) | 21 (20.2%) |
| 3 or more Vehicles | 214 (51.8%) | 11 (10.6%) |
| Total | 413 (100.0%) | 104 (100.0%) |
Real Estate & Mortgages in Grant
Real Estate and Mortgage Overview in Grant
| Characteristic | Without Mortgage | With Mortgage |
| Housing Units | 71 | 342 |
| Median Property Value | $244,200 | $205,100 |
| Median Household Income | $71,250 | $75 |
| Monthly Housing Costs | $393 | $2 |
| Real Estate Taxes | $950 | $81 |
Property Value by Mortgage Status in Grant
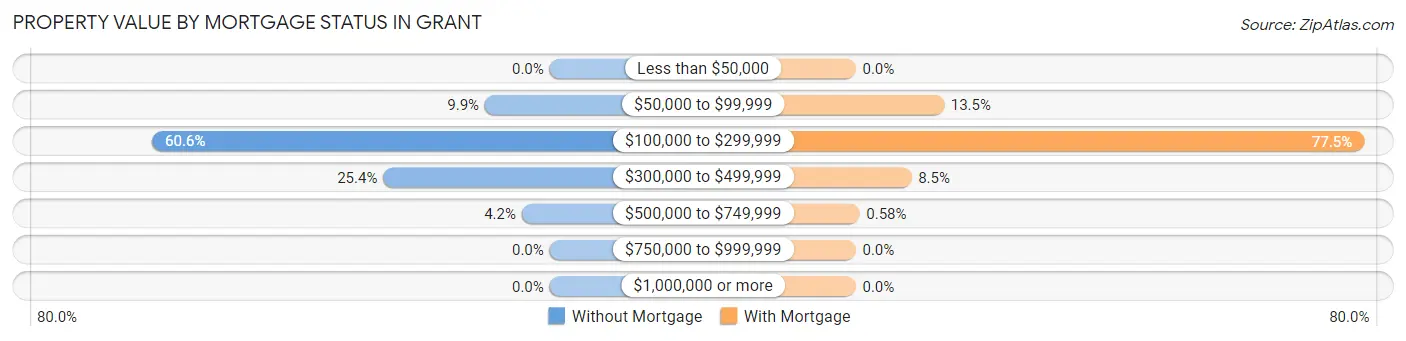
| Property Value | Without Mortgage | With Mortgage |
| Less than $50,000 | 0 (0.0%) | 0 (0.0%) |
| $50,000 to $99,999 | 7 (9.9%) | 46 (13.5%) |
| $100,000 to $299,999 | 43 (60.6%) | 265 (77.5%) |
| $300,000 to $499,999 | 18 (25.4%) | 29 (8.5%) |
| $500,000 to $749,999 | 3 (4.2%) | 2 (0.6%) |
| $750,000 to $999,999 | 0 (0.0%) | 0 (0.0%) |
| $1,000,000 or more | 0 (0.0%) | 0 (0.0%) |
| Total | 71 (100.0%) | 342 (100.0%) |
Household Income by Mortgage Status in Grant
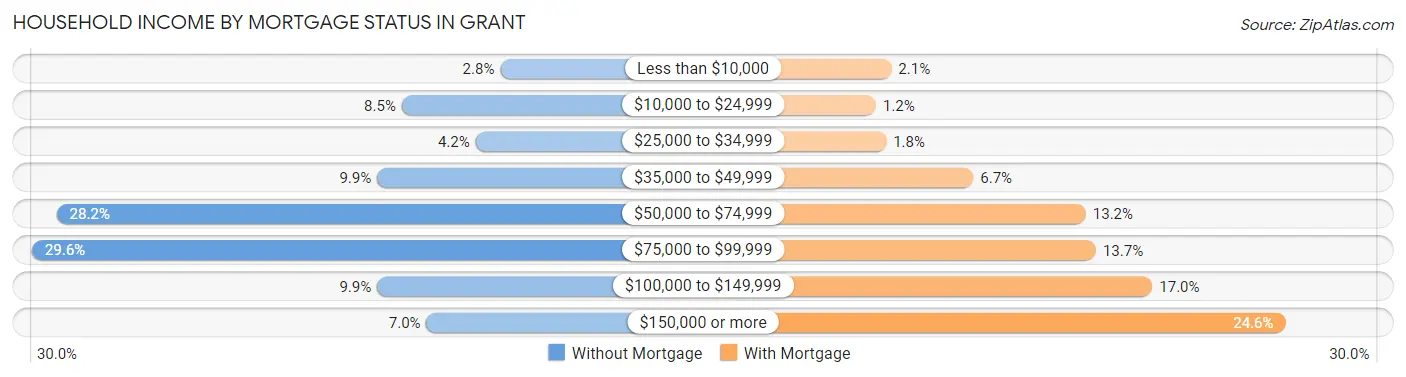
| Household Income | Without Mortgage | With Mortgage |
| Less than $10,000 | 2 (2.8%) | 7 (2.1%) |
| $10,000 to $24,999 | 6 (8.5%) | 4 (1.2%) |
| $25,000 to $34,999 | 3 (4.2%) | 6 (1.8%) |
| $35,000 to $49,999 | 7 (9.9%) | 23 (6.7%) |
| $50,000 to $74,999 | 20 (28.2%) | 45 (13.2%) |
| $75,000 to $99,999 | 21 (29.6%) | 47 (13.7%) |
| $100,000 to $149,999 | 7 (9.9%) | 58 (17.0%) |
| $150,000 or more | 5 (7.0%) | 84 (24.6%) |
| Total | 71 (100.0%) | 342 (100.0%) |
Property Value to Household Income Ratio in Grant
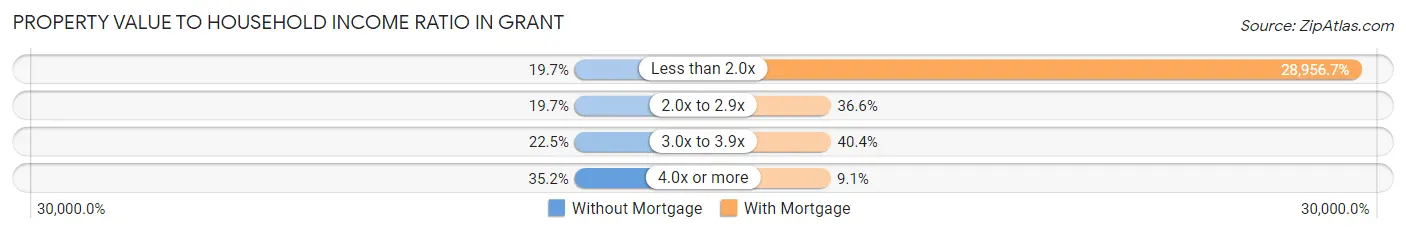
| Value-to-Income Ratio | Without Mortgage | With Mortgage |
| Less than 2.0x | 14 (19.7%) | 99,032 (28,956.7%) |
| 2.0x to 2.9x | 14 (19.7%) | 125 (36.5%) |
| 3.0x to 3.9x | 16 (22.5%) | 138 (40.4%) |
| 4.0x or more | 25 (35.2%) | 31 (9.1%) |
| Total | 71 (100.0%) | 342 (100.0%) |
Real Estate Taxes by Mortgage Status in Grant
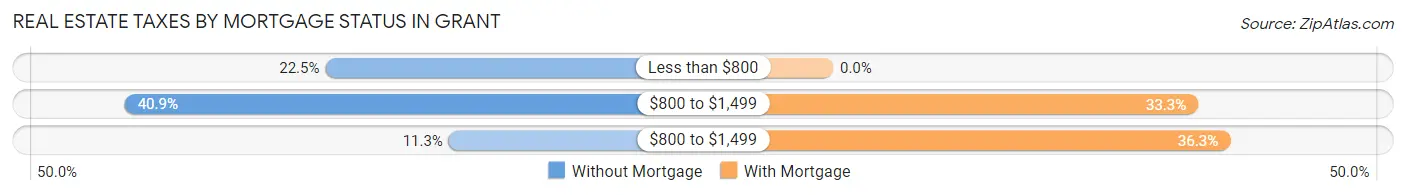
| Property Taxes | Without Mortgage | With Mortgage |
| Less than $800 | 16 (22.5%) | 0 (0.0%) |
| $800 to $1,499 | 29 (40.8%) | 114 (33.3%) |
| $800 to $1,499 | 8 (11.3%) | 124 (36.3%) |
| Total | 71 (100.0%) | 342 (100.0%) |
Health & Disability in Grant
Health Insurance Coverage by Age in Grant
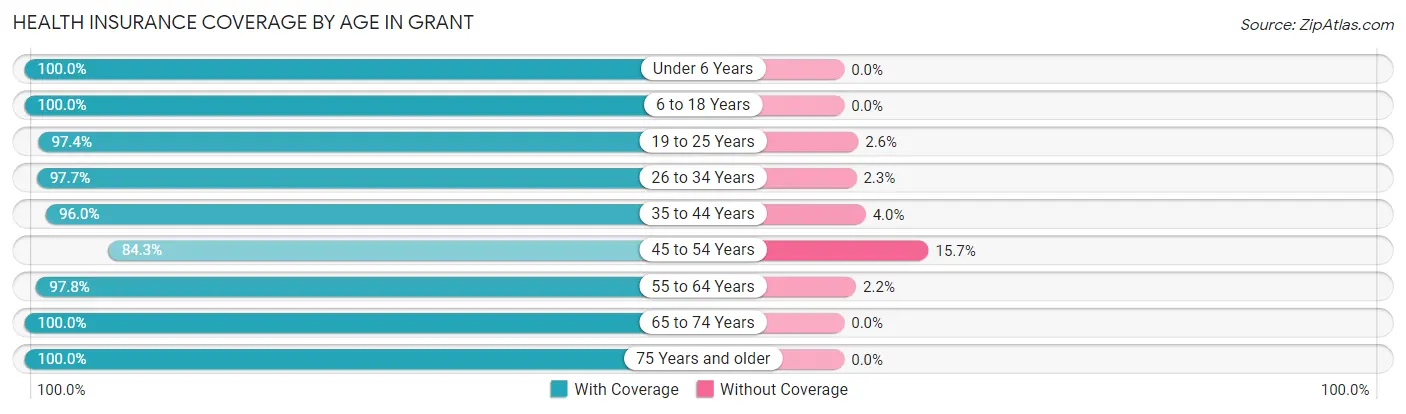
| Age Bracket | With Coverage | Without Coverage |
| Under 6 Years | 315 (100.0%) | 0 (0.0%) |
| 6 to 18 Years | 286 (100.0%) | 0 (0.0%) |
| 19 to 25 Years | 112 (97.4%) | 3 (2.6%) |
| 26 to 34 Years | 301 (97.7%) | 7 (2.3%) |
| 35 to 44 Years | 144 (96.0%) | 6 (4.0%) |
| 45 to 54 Years | 118 (84.3%) | 22 (15.7%) |
| 55 to 64 Years | 133 (97.8%) | 3 (2.2%) |
| 65 to 74 Years | 138 (100.0%) | 0 (0.0%) |
| 75 Years and older | 79 (100.0%) | 0 (0.0%) |
| Total | 1,626 (97.5%) | 41 (2.5%) |
Health Insurance Coverage by Citizenship Status in Grant
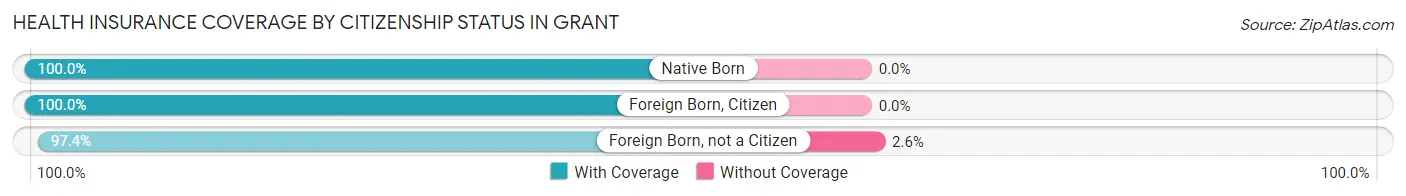
| Citizenship Status | With Coverage | Without Coverage |
| Native Born | 315 (100.0%) | 0 (0.0%) |
| Foreign Born, Citizen | 286 (100.0%) | 0 (0.0%) |
| Foreign Born, not a Citizen | 112 (97.4%) | 3 (2.6%) |
Health Insurance Coverage by Household Income in Grant
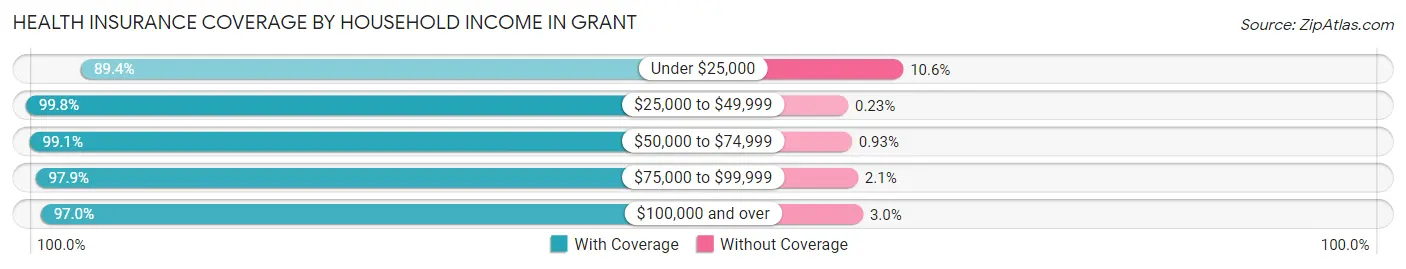
| Household Income | With Coverage | Without Coverage |
| Under $25,000 | 110 (89.4%) | 13 (10.6%) |
| $25,000 to $49,999 | 427 (99.8%) | 1 (0.2%) |
| $50,000 to $74,999 | 214 (99.1%) | 2 (0.9%) |
| $75,000 to $99,999 | 235 (97.9%) | 5 (2.1%) |
| $100,000 and over | 640 (97.0%) | 20 (3.0%) |
Public vs Private Health Insurance Coverage by Age in Grant
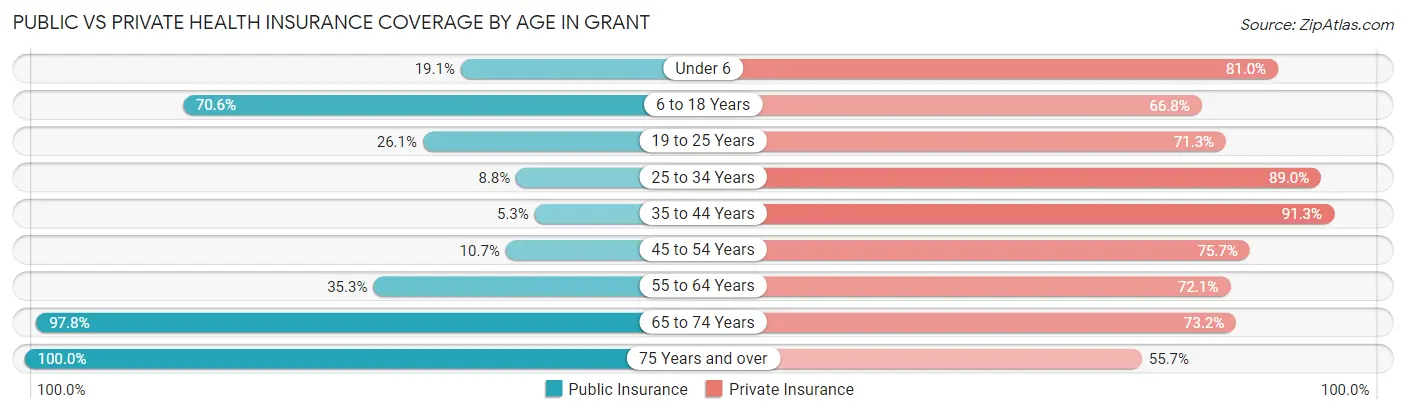
| Age Bracket | Public Insurance | Private Insurance |
| Under 6 | 60 (19.1%) | 255 (80.9%) |
| 6 to 18 Years | 202 (70.6%) | 191 (66.8%) |
| 19 to 25 Years | 30 (26.1%) | 82 (71.3%) |
| 25 to 34 Years | 27 (8.8%) | 274 (89.0%) |
| 35 to 44 Years | 8 (5.3%) | 137 (91.3%) |
| 45 to 54 Years | 15 (10.7%) | 106 (75.7%) |
| 55 to 64 Years | 48 (35.3%) | 98 (72.1%) |
| 65 to 74 Years | 135 (97.8%) | 101 (73.2%) |
| 75 Years and over | 79 (100.0%) | 44 (55.7%) |
| Total | 604 (36.2%) | 1,288 (77.3%) |
Disability Status by Sex by Age in Grant
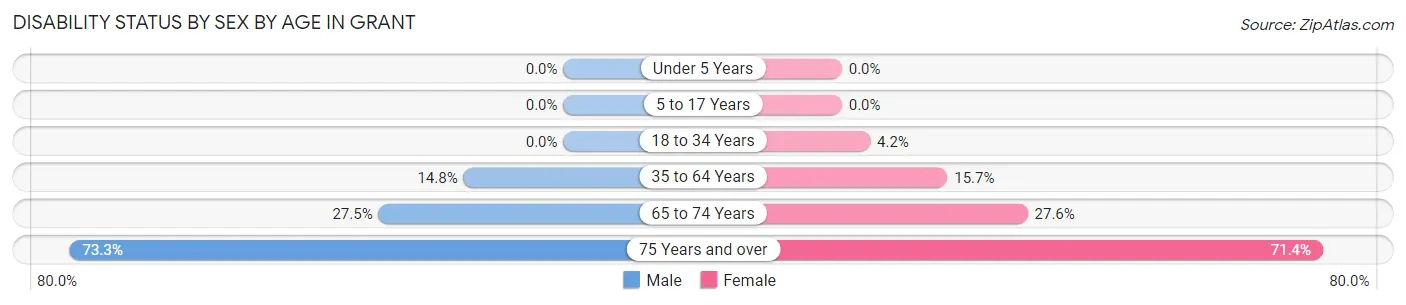
| Age Bracket | Male | Female |
| Under 5 Years | 0 (0.0%) | 0 (0.0%) |
| 5 to 17 Years | 0 (0.0%) | 0 (0.0%) |
| 18 to 34 Years | 0 (0.0%) | 12 (4.2%) |
| 35 to 64 Years | 31 (14.8%) | 34 (15.7%) |
| 65 to 74 Years | 14 (27.5%) | 24 (27.6%) |
| 75 Years and over | 22 (73.3%) | 35 (71.4%) |
Disability Class by Sex by Age in Grant
Disability Class: Hearing Difficulty
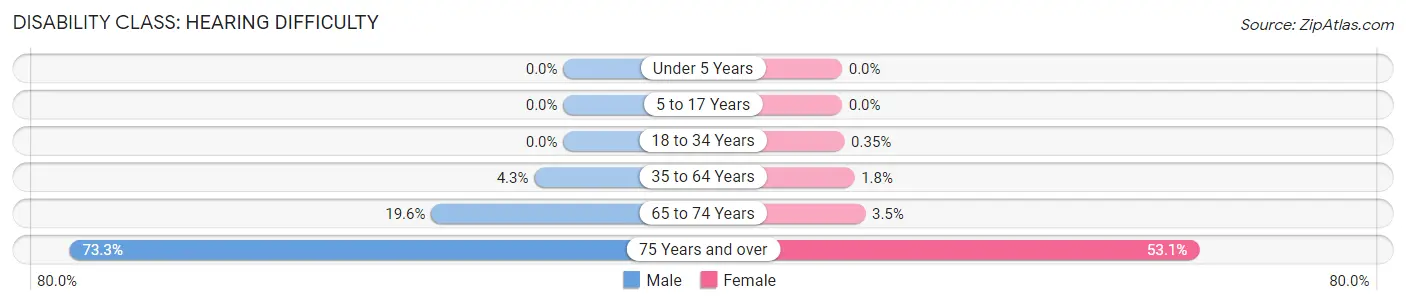
| Age Bracket | Male | Female |
| Under 5 Years | 0 (0.0%) | 0 (0.0%) |
| 5 to 17 Years | 0 (0.0%) | 0 (0.0%) |
| 18 to 34 Years | 0 (0.0%) | 1 (0.4%) |
| 35 to 64 Years | 9 (4.3%) | 4 (1.8%) |
| 65 to 74 Years | 10 (19.6%) | 3 (3.5%) |
| 75 Years and over | 22 (73.3%) | 26 (53.1%) |
Disability Class: Vision Difficulty
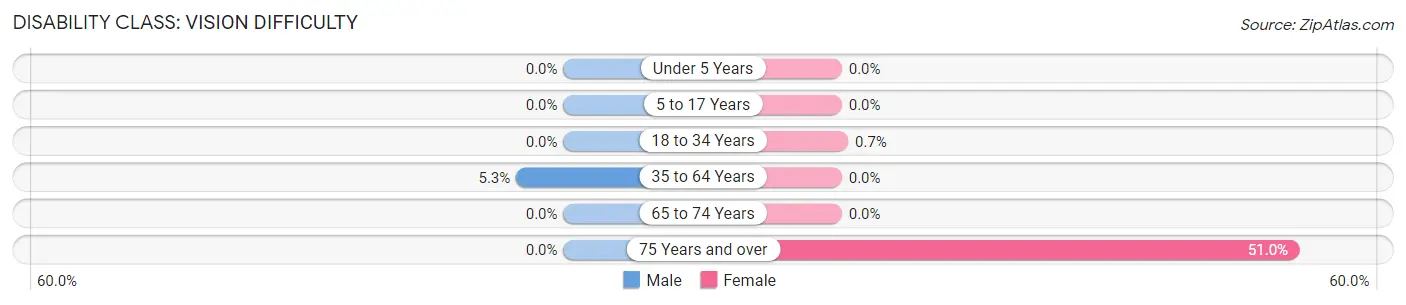
| Age Bracket | Male | Female |
| Under 5 Years | 0 (0.0%) | 0 (0.0%) |
| 5 to 17 Years | 0 (0.0%) | 0 (0.0%) |
| 18 to 34 Years | 0 (0.0%) | 2 (0.7%) |
| 35 to 64 Years | 11 (5.3%) | 0 (0.0%) |
| 65 to 74 Years | 0 (0.0%) | 0 (0.0%) |
| 75 Years and over | 0 (0.0%) | 25 (51.0%) |
Disability Class: Cognitive Difficulty
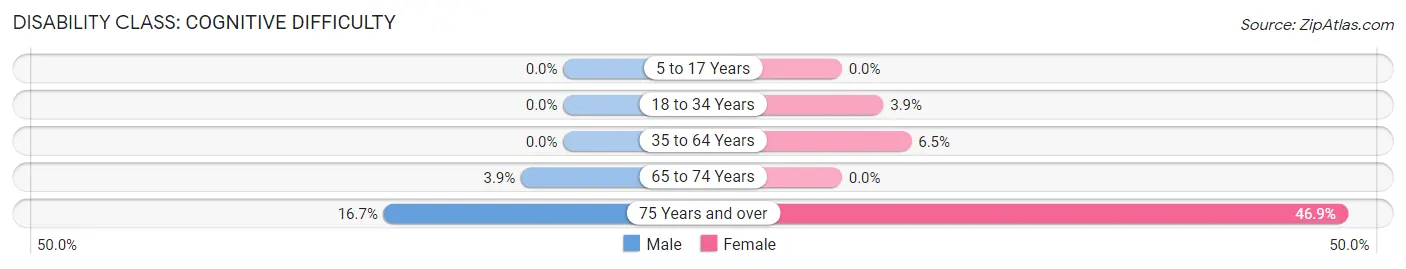
| Age Bracket | Male | Female |
| 5 to 17 Years | 0 (0.0%) | 0 (0.0%) |
| 18 to 34 Years | 0 (0.0%) | 11 (3.8%) |
| 35 to 64 Years | 0 (0.0%) | 14 (6.5%) |
| 65 to 74 Years | 2 (3.9%) | 0 (0.0%) |
| 75 Years and over | 5 (16.7%) | 23 (46.9%) |
Disability Class: Ambulatory Difficulty
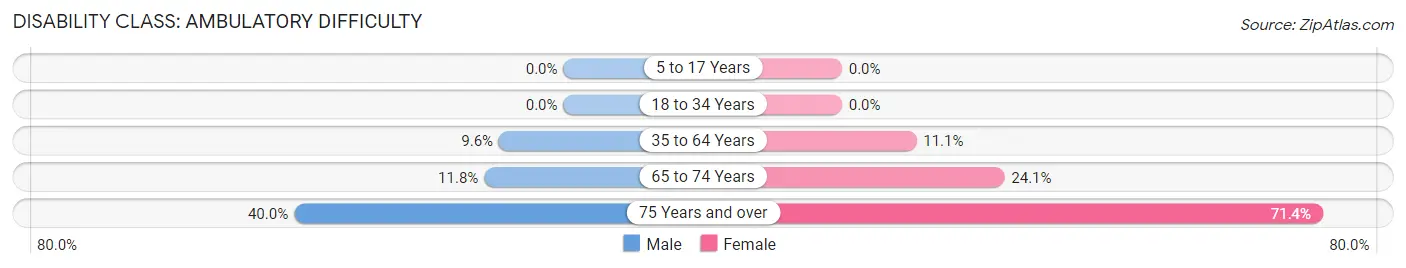
| Age Bracket | Male | Female |
| 5 to 17 Years | 0 (0.0%) | 0 (0.0%) |
| 18 to 34 Years | 0 (0.0%) | 0 (0.0%) |
| 35 to 64 Years | 20 (9.6%) | 24 (11.1%) |
| 65 to 74 Years | 6 (11.8%) | 21 (24.1%) |
| 75 Years and over | 12 (40.0%) | 35 (71.4%) |
Disability Class: Self-Care Difficulty
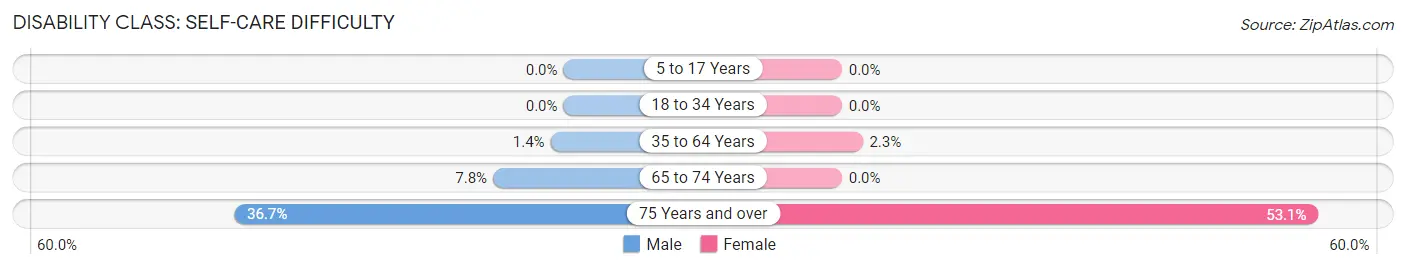
| Age Bracket | Male | Female |
| 5 to 17 Years | 0 (0.0%) | 0 (0.0%) |
| 18 to 34 Years | 0 (0.0%) | 0 (0.0%) |
| 35 to 64 Years | 3 (1.4%) | 5 (2.3%) |
| 65 to 74 Years | 4 (7.8%) | 0 (0.0%) |
| 75 Years and over | 11 (36.7%) | 26 (53.1%) |
Technology Access in Grant
Computing Device Access in Grant
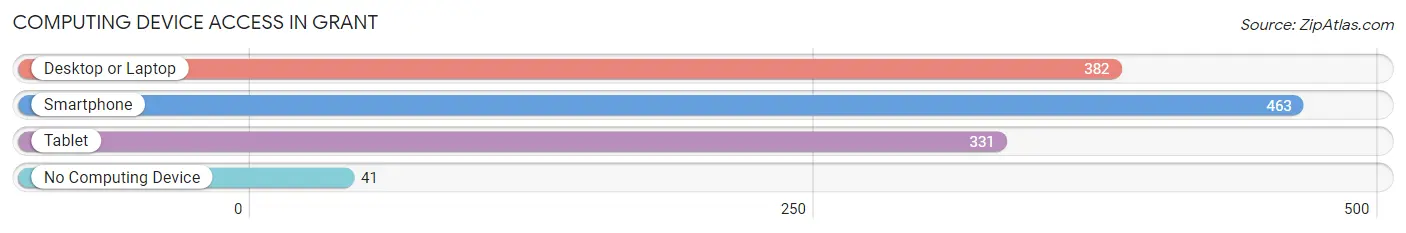
| Device Type | # Households | % Households |
| Desktop or Laptop | 382 | 73.9% |
| Smartphone | 463 | 89.6% |
| Tablet | 331 | 64.0% |
| No Computing Device | 41 | 7.9% |
| Total | 517 | 100.0% |
Internet Access in Grant
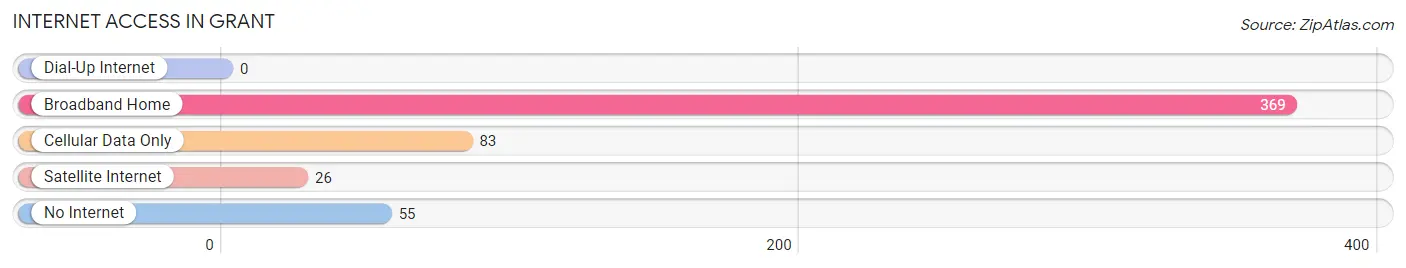
| Internet Type | # Households | % Households |
| Dial-Up Internet | 0 | 0.0% |
| Broadband Home | 369 | 71.4% |
| Cellular Data Only | 83 | 16.1% |
| Satellite Internet | 26 | 5.0% |
| No Internet | 55 | 10.6% |
| Total | 517 | 100.0% |
Grant Summary
History
Grant, Alabama is a small town located in Marshall County, Alabama. It was founded in 1891 and incorporated in 1901. The town was named after General Ulysses S. Grant, the 18th President of the United States. The town was originally a farming community, but has since grown to include a variety of businesses and industries.
The town of Grant was first settled in the late 1800s by a group of settlers from Tennessee. The settlers were attracted to the area due to its fertile soil and abundant natural resources. The town was officially incorporated in 1901 and the first mayor was elected in 1902.
The town of Grant has a long and rich history. During the Civil War, the town was a major supply center for the Confederate Army. After the war, the town was a major center for cotton production. The town was also home to several large sawmills and lumber companies.
In the early 1900s, the town of Grant began to experience a period of growth and prosperity. The town was home to several large businesses, including a cotton mill, a furniture factory, and a brickyard. The town also had several banks, a hotel, and a movie theater.
In the 1950s, the town of Grant began to experience a period of decline. The cotton mill and furniture factory closed, and the town’s population began to decline. In the late 1970s, the town began to experience a period of revitalization. The town was home to several new businesses, including a grocery store, a hardware store, and a restaurant.
Geography
Grant, Alabama is located in Marshall County, Alabama. The town is situated in the foothills of the Appalachian Mountains and is surrounded by rolling hills and forests. The town is located approximately 25 miles north of Huntsville and approximately 50 miles south of Chattanooga, Tennessee.
The town of Grant is located at the intersection of two major highways, US Highway 431 and Alabama Highway 79. The town is also located near several major lakes, including Lake Guntersville, Lake Wheeler, and Lake Guntersville State Park.
The town of Grant has a total area of 2.2 square miles, all of which is land. The town has a humid subtropical climate, with hot, humid summers and mild winters. The average annual temperature is around 68 degrees Fahrenheit.
Economy
The economy of Grant, Alabama is largely based on agriculture and manufacturing. The town is home to several large farms, which produce a variety of crops, including cotton, corn, soybeans, and wheat. The town is also home to several large manufacturing companies, which produce a variety of products, including furniture, clothing, and automotive parts.
The town of Grant is also home to several small businesses, including restaurants, retail stores, and service providers. The town is also home to several banks, which provide financial services to the local community.
Demographics
As of the 2010 census, the town of Grant had a population of 1,845 people. The racial makeup of the town was 95.3% White, 0.7% African American, 0.3% Native American, 0.2% Asian, 0.1% Pacific Islander, and 3.4% from other races. The median household income was $37,917, and the median family income was $45,625.
The town of Grant is served by the Marshall County School District. The town is home to several schools, including Grant Elementary School, Grant Middle School, and Grant High School. The town is also home to several churches, including the First Baptist Church of Grant and the Church of Christ of Grant.
Common Questions
What is Per Capita Income in Grant?
Per Capita income in Grant is $28,474.
What is the Median Family Income in Grant?
Median Family Income in Grant is $88,875.
What is the Median Household income in Grant?
Median Household Income in Grant is $81,875.
What is Inequality or Gini Index in Grant?
Inequality or Gini Index in Grant is 0.39.
What is the Total Population of Grant?
Total Population of Grant is 1,667.
What is the Total Male Population of Grant?
Total Male Population of Grant is 800.
What is the Total Female Population of Grant?
Total Female Population of Grant is 867.
What is the Ratio of Males per 100 Females in Grant?
There are 92.27 Males per 100 Females in Grant.
What is the Ratio of Females per 100 Males in Grant?
There are 108.38 Females per 100 Males in Grant.
What is the Median Population Age in Grant?
Median Population Age in Grant is 29.0 Years.
What is the Average Family Size in Grant
Average Family Size in Grant is 3.4 People.
What is the Average Household Size in Grant
Average Household Size in Grant is 3.2 People.
How Large is the Labor Force in Grant?
There are 691 People in the Labor Forcein in Grant.
What is the Percentage of People in the Labor Force in Grant?
60.8% of People are in the Labor Force in Grant.
What is the Unemployment Rate in Grant?
Unemployment Rate in Grant is 2.2%.