Trinity, AL Map & Demographics
Trinity Map
Trinity Overview
$36,623
PER CAPITA INCOME
$104,514
AVG FAMILY INCOME
$94,706
AVG HOUSEHOLD INCOME
53.1%
WAGE / INCOME GAP [ % ]
46.9¢/ $1
WAGE / INCOME GAP [ $ ]
0.36
INEQUALITY / GINI INDEX
2,510
TOTAL POPULATION
1,346
MALE POPULATION
1,164
FEMALE POPULATION
115.64
MALES / 100 FEMALES
86.48
FEMALES / 100 MALES
38.1
MEDIAN AGE
3.4
AVG FAMILY SIZE
2.9
AVG HOUSEHOLD SIZE
1,315
LABOR FORCE [ PEOPLE ]
66.3%
PERCENT IN LABOR FORCE
2.4%
UNEMPLOYMENT RATE
Trinity Zip Codes
Income in Trinity
Income Overview in Trinity
Per Capita Income in Trinity is $36,623, while median incomes of families and households are $104,514 and $94,706 respectively.
| Characteristic | Number | Measure |
| Per Capita Income | 2,510 | $36,623 |
| Median Family Income | 659 | $104,514 |
| Mean Family Income | 659 | $116,726 |
| Median Household Income | 880 | $94,706 |
| Mean Household Income | 880 | $101,341 |
| Income Deficit | 659 | $0 |
| Wage / Income Gap (%) | 2,510 | 53.12% |
| Wage / Income Gap ($) | 2,510 | 46.88¢ per $1 |
| Gini / Inequality Index | 2,510 | 0.36 |
Earnings by Sex in Trinity
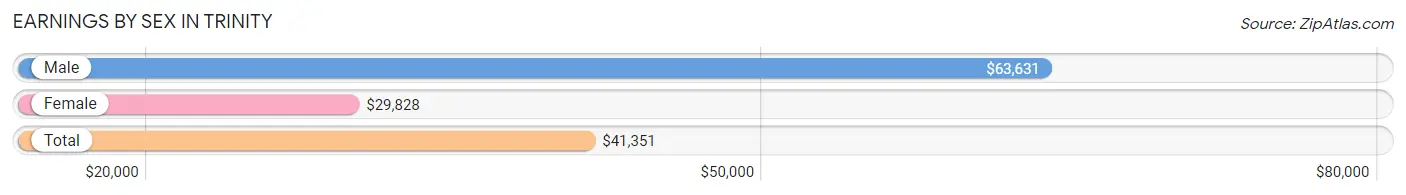
Average Earnings in Trinity are $41,351, $63,631 for men and $29,828 for women, a difference of 53.1%.
| Sex | Number | Average Earnings |
| Male | 695 (52.5%) | $63,631 |
| Female | 629 (47.5%) | $29,828 |
| Total | 1,324 (100.0%) | $41,351 |
Earnings by Sex by Income Bracket in Trinity
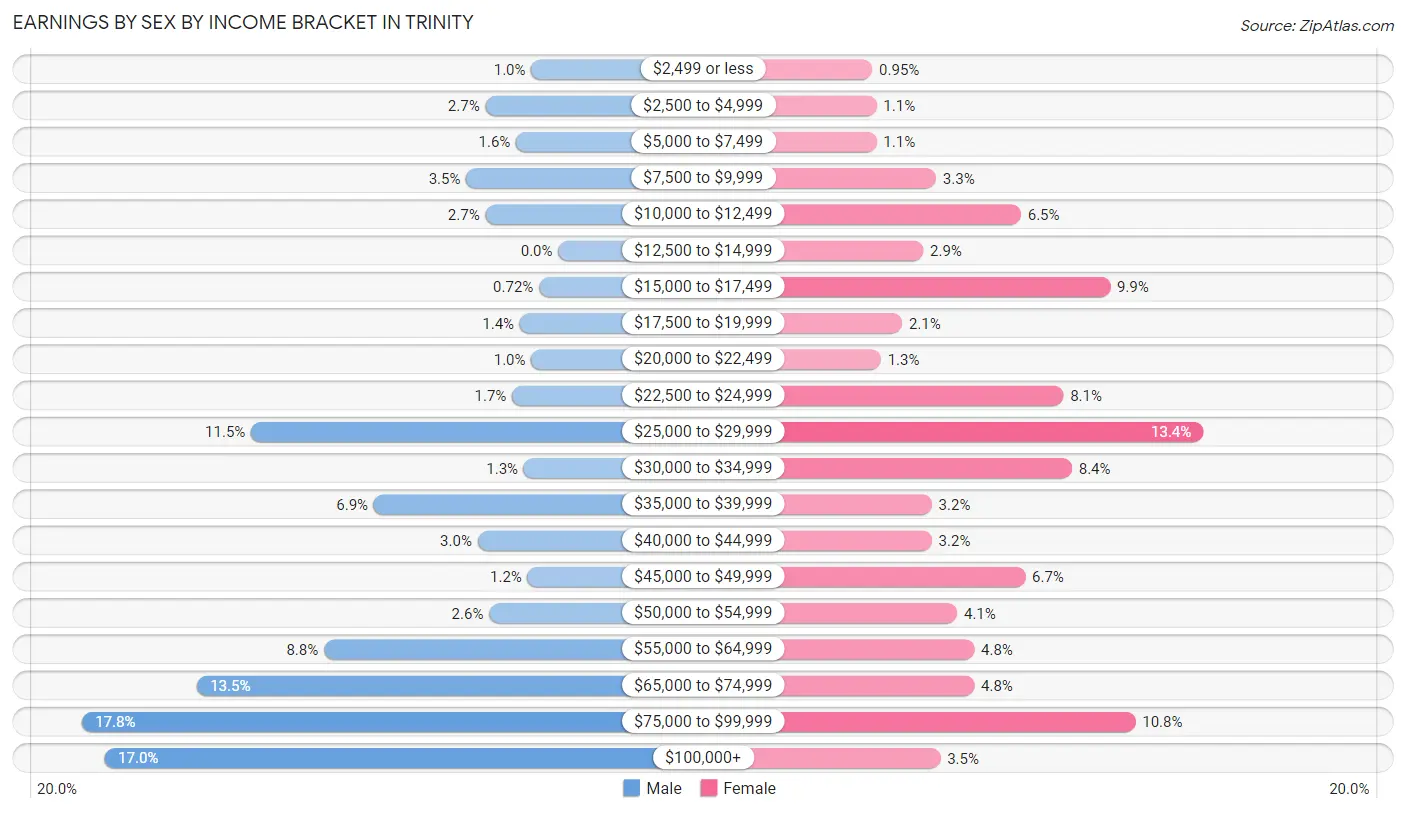
The most common earnings brackets in Trinity are $75,000 to $99,999 for men (124 | 17.8%) and $25,000 to $29,999 for women (84 | 13.4%).
| Income | Male | Female |
| $2,499 or less | 7 (1.0%) | 6 (0.9%) |
| $2,500 to $4,999 | 19 (2.7%) | 7 (1.1%) |
| $5,000 to $7,499 | 11 (1.6%) | 7 (1.1%) |
| $7,500 to $9,999 | 24 (3.5%) | 21 (3.3%) |
| $10,000 to $12,499 | 19 (2.7%) | 41 (6.5%) |
| $12,500 to $14,999 | 0 (0.0%) | 18 (2.9%) |
| $15,000 to $17,499 | 5 (0.7%) | 62 (9.9%) |
| $17,500 to $19,999 | 10 (1.4%) | 13 (2.1%) |
| $20,000 to $22,499 | 7 (1.0%) | 8 (1.3%) |
| $22,500 to $24,999 | 12 (1.7%) | 51 (8.1%) |
| $25,000 to $29,999 | 80 (11.5%) | 84 (13.4%) |
| $30,000 to $34,999 | 9 (1.3%) | 53 (8.4%) |
| $35,000 to $39,999 | 48 (6.9%) | 20 (3.2%) |
| $40,000 to $44,999 | 21 (3.0%) | 20 (3.2%) |
| $45,000 to $49,999 | 8 (1.1%) | 42 (6.7%) |
| $50,000 to $54,999 | 18 (2.6%) | 26 (4.1%) |
| $55,000 to $64,999 | 61 (8.8%) | 30 (4.8%) |
| $65,000 to $74,999 | 94 (13.5%) | 30 (4.8%) |
| $75,000 to $99,999 | 124 (17.8%) | 68 (10.8%) |
| $100,000+ | 118 (17.0%) | 22 (3.5%) |
| Total | 695 (100.0%) | 629 (100.0%) |
Earnings by Sex by Educational Attainment in Trinity
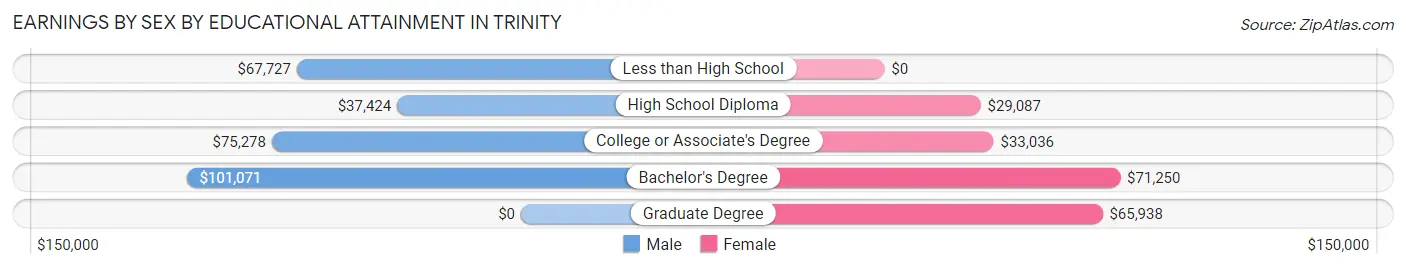
Average earnings in Trinity are $68,828 for men and $34,233 for women, a difference of 50.3%. Men with an educational attainment of bachelor's degree enjoy the highest average annual earnings of $101,071, while those with high school diploma education earn the least with $37,424. Women with an educational attainment of bachelor's degree earn the most with the average annual earnings of $71,250, while those with high school diploma education have the smallest earnings of $29,087.
| Educational Attainment | Male Income | Female Income |
| Less than High School | $67,727 | $0 |
| High School Diploma | $37,424 | $29,087 |
| College or Associate's Degree | $75,278 | $33,036 |
| Bachelor's Degree | $101,071 | $71,250 |
| Graduate Degree | - | - |
| Total | $68,828 | $34,233 |
Family Income in Trinity
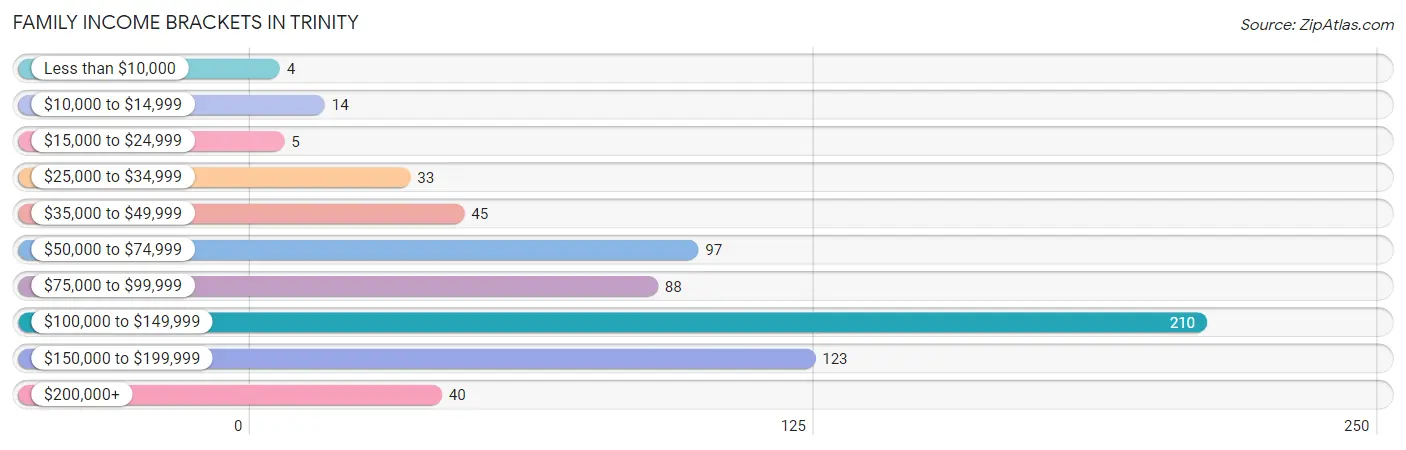
Family Income Brackets in Trinity
According to the Trinity family income data, there are 210 families falling into the $100,000 to $149,999 income range, which is the most common income bracket and makes up 31.9% of all families. Conversely, the less than $10,000 income bracket is the least frequent group with only 4 families (0.6%) belonging to this category.
| Income Bracket | # Families | % Families |
| Less than $10,000 | 4 | 0.6% |
| $10,000 to $14,999 | 14 | 2.1% |
| $15,000 to $24,999 | 5 | 0.8% |
| $25,000 to $34,999 | 33 | 5.0% |
| $35,000 to $49,999 | 45 | 6.8% |
| $50,000 to $74,999 | 97 | 14.7% |
| $75,000 to $99,999 | 88 | 13.4% |
| $100,000 to $149,999 | 210 | 31.9% |
| $150,000 to $199,999 | 123 | 18.7% |
| $200,000+ | 40 | 6.1% |
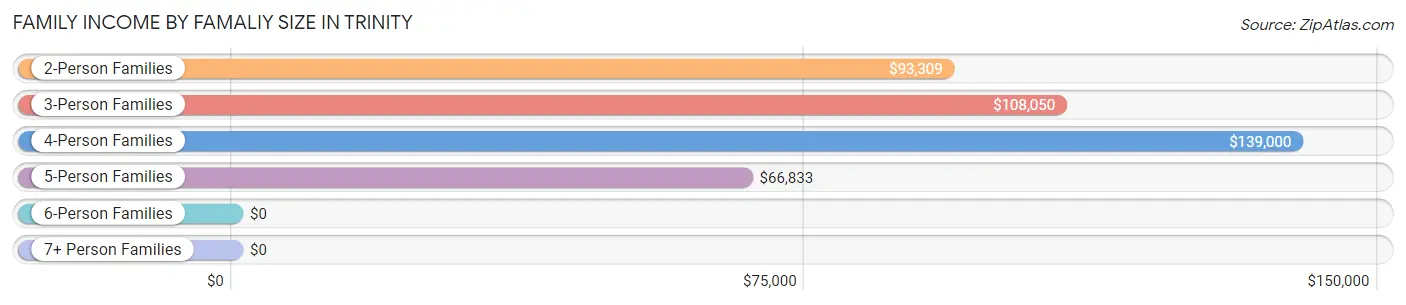
Family Income by Famaliy Size in Trinity
4-person families (88 | 13.4%) account for the highest median family income in Trinity with $139,000 per family, while 2-person families (243 | 36.9%) have the highest median income of $46,654 per family member.
| Income Bracket | # Families | Median Income |
| 2-Person Families | 243 (36.9%) | $93,309 |
| 3-Person Families | 235 (35.7%) | $108,050 |
| 4-Person Families | 88 (13.4%) | $139,000 |
| 5-Person Families | 86 (13.1%) | $66,833 |
| 6-Person Families | 0 (0.0%) | $0 |
| 7+ Person Families | 7 (1.1%) | $0 |
| Total | 659 (100.0%) | $104,514 |
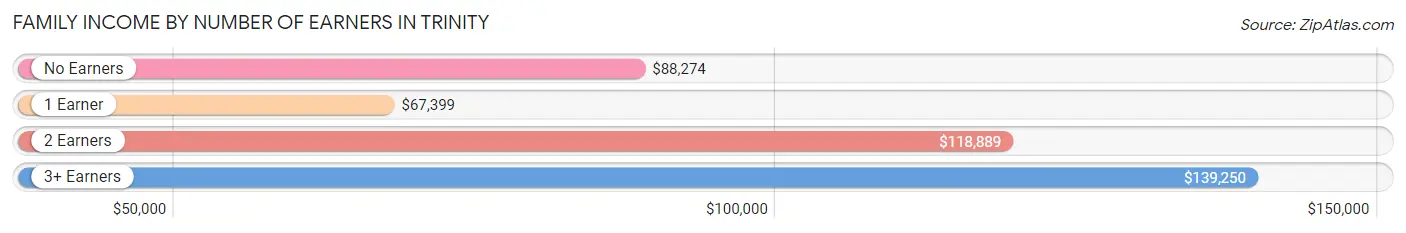
Family Income by Number of Earners in Trinity
The median family income in Trinity is $104,514, with families comprising 3+ earners (111) having the highest median family income of $139,250, while families with 1 earner (213) have the lowest median family income of $67,399, accounting for 16.8% and 32.3% of families, respectively.
| Number of Earners | # Families | Median Income |
| No Earners | 79 (12.0%) | $88,274 |
| 1 Earner | 213 (32.3%) | $67,399 |
| 2 Earners | 256 (38.9%) | $118,889 |
| 3+ Earners | 111 (16.8%) | $139,250 |
| Total | 659 (100.0%) | $104,514 |
Household Income in Trinity
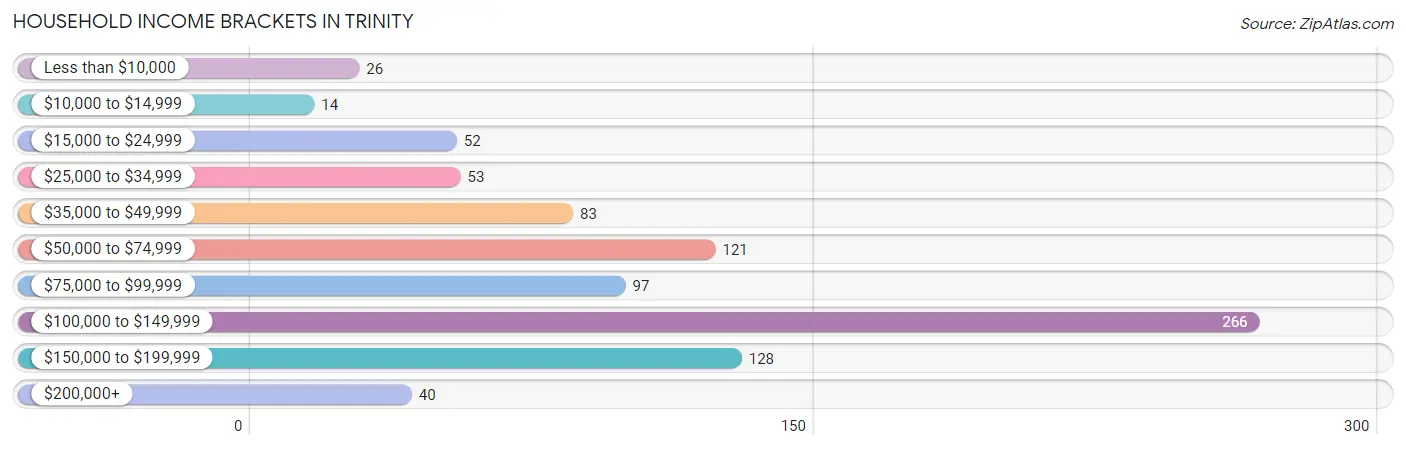
Household Income Brackets in Trinity
With 266 households falling in the category, the $100,000 to $149,999 income range is the most frequent in Trinity, accounting for 30.2% of all households. In contrast, only 14 households (1.6%) fall into the $10,000 to $14,999 income bracket, making it the least populous group.
| Income Bracket | # Households | % Households |
| Less than $10,000 | 26 | 3.0% |
| $10,000 to $14,999 | 14 | 1.6% |
| $15,000 to $24,999 | 52 | 5.9% |
| $25,000 to $34,999 | 53 | 6.0% |
| $35,000 to $49,999 | 83 | 9.4% |
| $50,000 to $74,999 | 121 | 13.8% |
| $75,000 to $99,999 | 97 | 11.0% |
| $100,000 to $149,999 | 266 | 30.2% |
| $150,000 to $199,999 | 128 | 14.5% |
| $200,000+ | 40 | 4.5% |
Household Income by Householder Age in Trinity
The median household income in Trinity is $94,706, with the highest median household income of $108,625 found in the 25 to 44 years age bracket for the primary householder. A total of 239 households (27.2%) fall into this category.
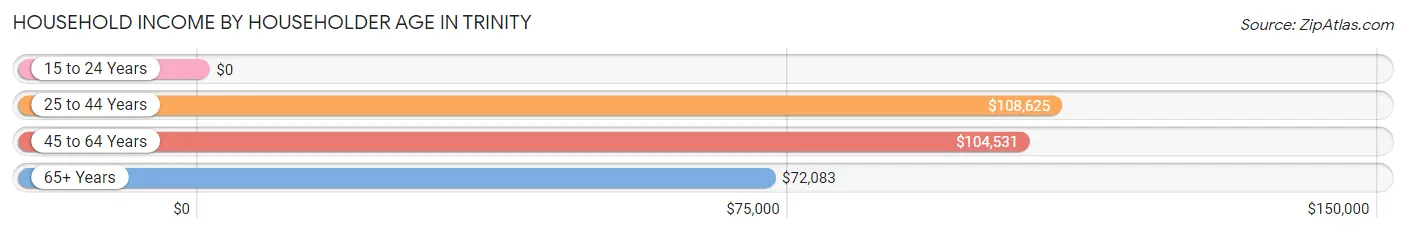
| Income Bracket | # Households | Median Income |
| 15 to 24 Years | 0 (0.0%) | $0 |
| 25 to 44 Years | 239 (27.2%) | $108,625 |
| 45 to 64 Years | 469 (53.3%) | $104,531 |
| 65+ Years | 172 (19.6%) | $72,083 |
| Total | 880 (100.0%) | $94,706 |
Poverty in Trinity
Income Below Poverty by Sex and Age in Trinity
With 3.6% poverty level for males and 7.9% for females among the residents of Trinity, 55 to 64 year old males and 16 and 17 year old females are the most vulnerable to poverty, with 33 males (14.7%) and 11 females (32.4%) in their respective age groups living below the poverty level.
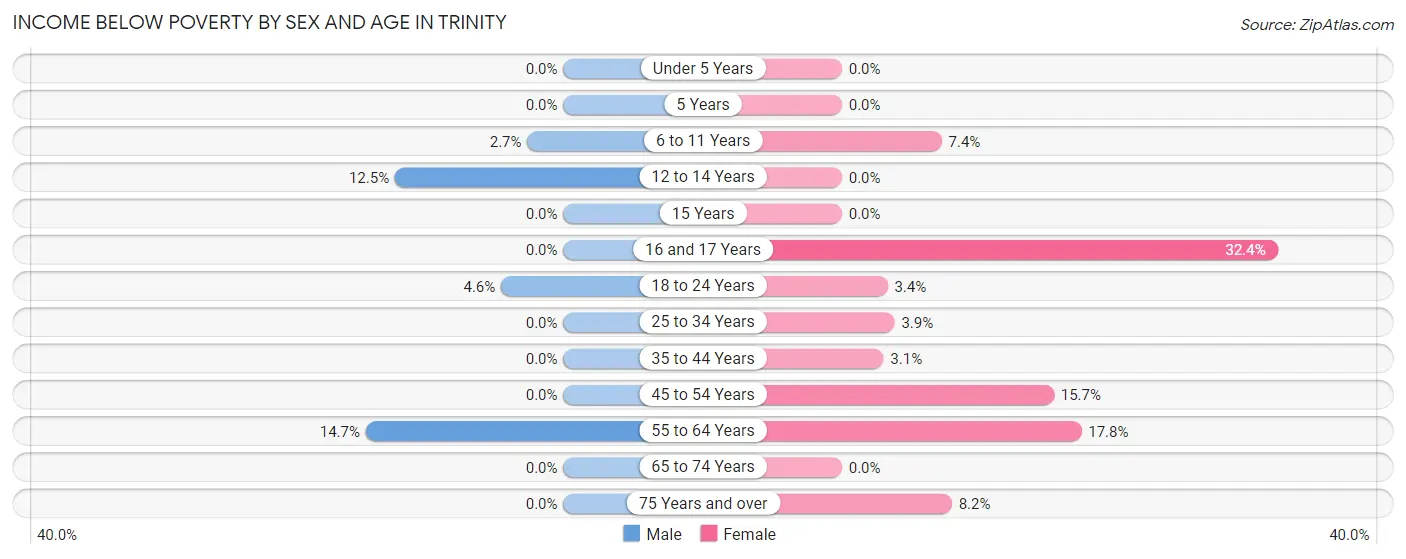
| Age Bracket | Male | Female |
| Under 5 Years | 0 (0.0%) | 0 (0.0%) |
| 5 Years | 0 (0.0%) | 0 (0.0%) |
| 6 to 11 Years | 5 (2.7%) | 4 (7.4%) |
| 12 to 14 Years | 4 (12.5%) | 0 (0.0%) |
| 15 Years | 0 (0.0%) | 0 (0.0%) |
| 16 and 17 Years | 0 (0.0%) | 11 (32.4%) |
| 18 to 24 Years | 6 (4.6%) | 4 (3.4%) |
| 25 to 34 Years | 0 (0.0%) | 5 (3.9%) |
| 35 to 44 Years | 0 (0.0%) | 5 (3.1%) |
| 45 to 54 Years | 0 (0.0%) | 34 (15.7%) |
| 55 to 64 Years | 33 (14.7%) | 24 (17.8%) |
| 65 to 74 Years | 0 (0.0%) | 0 (0.0%) |
| 75 Years and over | 0 (0.0%) | 4 (8.2%) |
| Total | 48 (3.6%) | 91 (7.9%) |
Income Above Poverty by Sex and Age in Trinity
According to the poverty statistics in Trinity, males aged under 5 years and females aged under 5 years are the age groups that are most secure financially, with 100.0% of males and 100.0% of females in these age groups living above the poverty line.
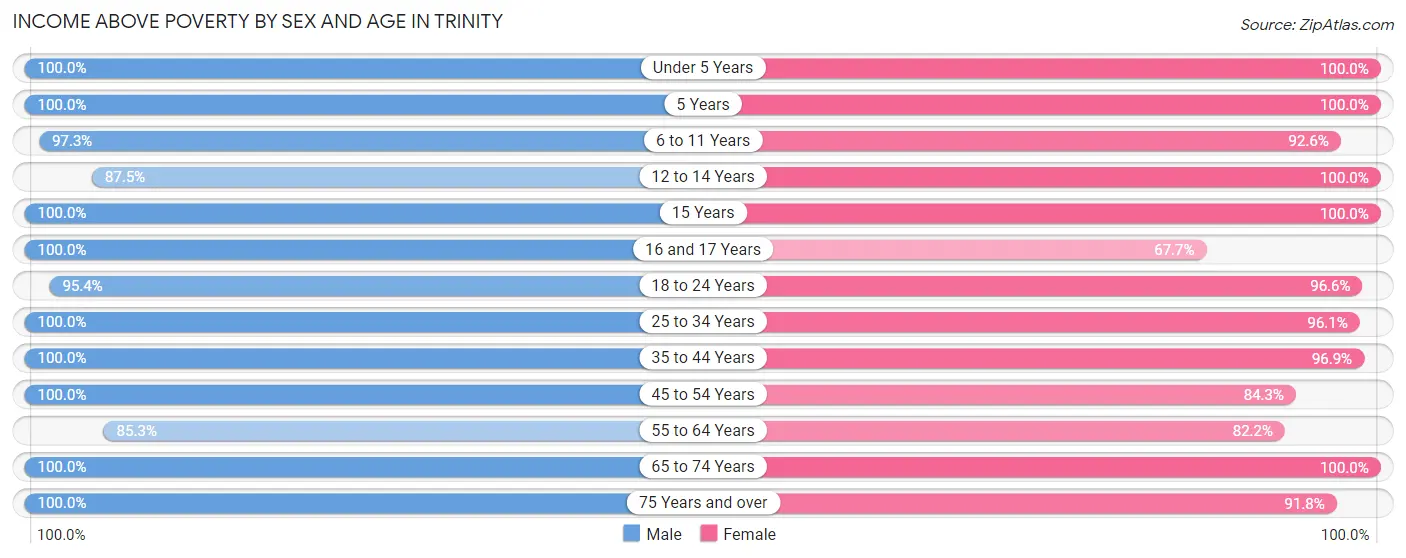
| Age Bracket | Male | Female |
| Under 5 Years | 47 (100.0%) | 35 (100.0%) |
| 5 Years | 57 (100.0%) | 3 (100.0%) |
| 6 to 11 Years | 182 (97.3%) | 50 (92.6%) |
| 12 to 14 Years | 28 (87.5%) | 87 (100.0%) |
| 15 Years | 5 (100.0%) | 7 (100.0%) |
| 16 and 17 Years | 98 (100.0%) | 23 (67.6%) |
| 18 to 24 Years | 124 (95.4%) | 114 (96.6%) |
| 25 to 34 Years | 123 (100.0%) | 123 (96.1%) |
| 35 to 44 Years | 153 (100.0%) | 157 (96.9%) |
| 45 to 54 Years | 170 (100.0%) | 182 (84.3%) |
| 55 to 64 Years | 192 (85.3%) | 111 (82.2%) |
| 65 to 74 Years | 92 (100.0%) | 123 (100.0%) |
| 75 Years and over | 27 (100.0%) | 45 (91.8%) |
| Total | 1,298 (96.4%) | 1,060 (92.1%) |
Income Below Poverty Among Married-Couple Families in Trinity
The poverty statistics for married-couple families in Trinity show that 3.6% or 19 of the total 534 families live below the poverty line. Families with no children have the highest poverty rate of 6.3%, comprising of 19 families. On the other hand, families with 1 or 2 children have the lowest poverty rate of 0.0%, which includes 0 families.
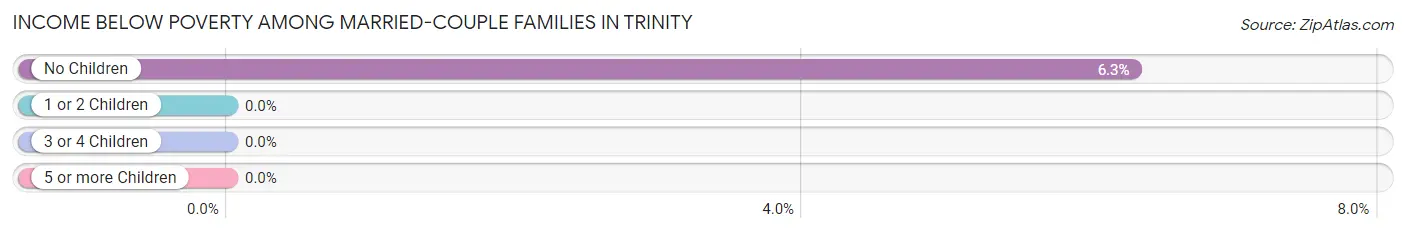
| Children | Above Poverty | Below Poverty |
| No Children | 283 (93.7%) | 19 (6.3%) |
| 1 or 2 Children | 168 (100.0%) | 0 (0.0%) |
| 3 or 4 Children | 64 (100.0%) | 0 (0.0%) |
| 5 or more Children | 0 (0.0%) | 0 (0.0%) |
| Total | 515 (96.4%) | 19 (3.6%) |
Income Below Poverty Among Single-Parent Households in Trinity
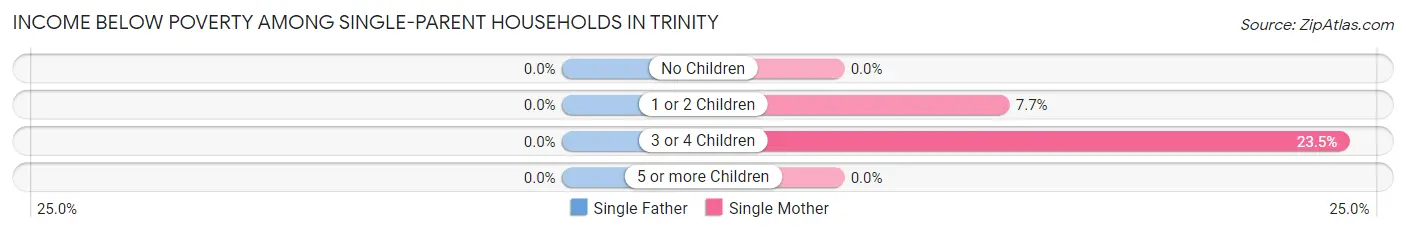
| Children | Single Father | Single Mother |
| No Children | 0 (0.0%) | 0 (0.0%) |
| 1 or 2 Children | 0 (0.0%) | 5 (7.7%) |
| 3 or 4 Children | 0 (0.0%) | 4 (23.5%) |
| 5 or more Children | 0 (0.0%) | 0 (0.0%) |
| Total | 0 (0.0%) | 9 (7.8%) |
Income Below Poverty Among Married-Couple vs Single-Parent Households in Trinity
The poverty data for Trinity shows that 19 of the married-couple family households (3.6%) and 9 of the single-parent households (7.2%) are living below the poverty level. Within the married-couple family households, those with no children have the highest poverty rate, with 19 households (6.3%) falling below the poverty line. Among the single-parent households, those with 3 or 4 children have the highest poverty rate, with 4 household (19.1%) living below poverty.
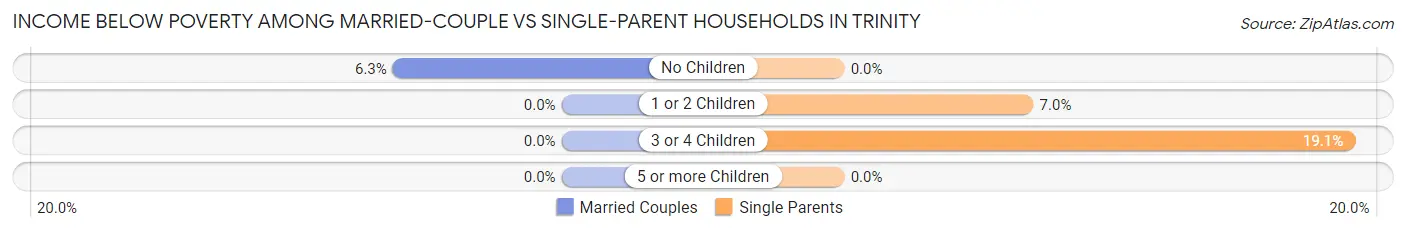
| Children | Married-Couple Families | Single-Parent Households |
| No Children | 19 (6.3%) | 0 (0.0%) |
| 1 or 2 Children | 0 (0.0%) | 5 (7.0%) |
| 3 or 4 Children | 0 (0.0%) | 4 (19.1%) |
| 5 or more Children | 0 (0.0%) | 0 (0.0%) |
| Total | 19 (3.6%) | 9 (7.2%) |
Race in Trinity
The most populous races in Trinity are White / Caucasian (1,993 | 79.4%), Hispanic or Latino (276 | 11.0%), and Black / African American (220 | 8.8%).
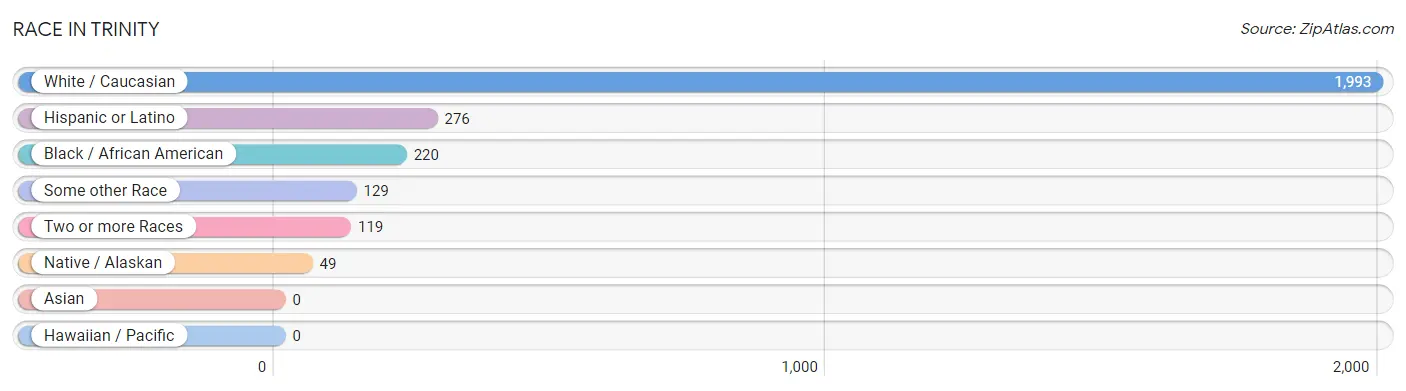
| Race | # Population | % Population |
| Asian | 0 | 0.0% |
| Black / African American | 220 | 8.8% |
| Hawaiian / Pacific | 0 | 0.0% |
| Hispanic or Latino | 276 | 11.0% |
| Native / Alaskan | 49 | 1.9% |
| White / Caucasian | 1,993 | 79.4% |
| Two or more Races | 119 | 4.7% |
| Some other Race | 129 | 5.1% |
| Total | 2,510 | 100.0% |
Ancestry in Trinity
The most populous ancestries reported in Trinity are American (425 | 16.9%), English (312 | 12.4%), Irish (271 | 10.8%), Mexican (220 | 8.8%), and Italian (130 | 5.2%), together accounting for 54.1% of all Trinity residents.
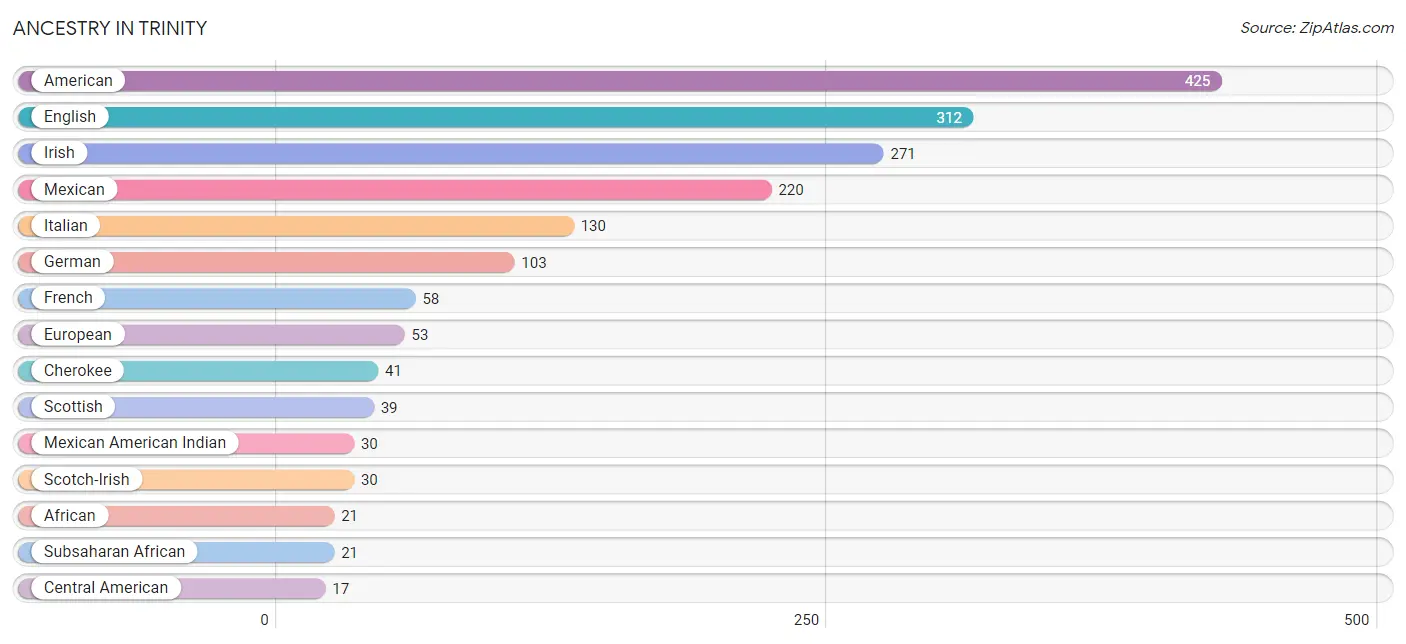
| Ancestry | # Population | % Population |
| African | 21 | 0.8% |
| American | 425 | 16.9% |
| Bulgarian | 3 | 0.1% |
| Central American | 17 | 0.7% |
| Cherokee | 41 | 1.6% |
| Chilean | 14 | 0.6% |
| English | 312 | 12.4% |
| European | 53 | 2.1% |
| French | 58 | 2.3% |
| French Canadian | 16 | 0.6% |
| German | 103 | 4.1% |
| Guatemalan | 10 | 0.4% |
| Honduran | 7 | 0.3% |
| Irish | 271 | 10.8% |
| Italian | 130 | 5.2% |
| Korean | 11 | 0.4% |
| Mexican | 220 | 8.8% |
| Mexican American Indian | 30 | 1.2% |
| Norwegian | 12 | 0.5% |
| Polish | 8 | 0.3% |
| Scandinavian | 16 | 0.6% |
| Scotch-Irish | 30 | 1.2% |
| Scottish | 39 | 1.5% |
| South American | 14 | 0.6% |
| Subsaharan African | 21 | 0.8% |
| Welsh | 13 | 0.5% |
| Yugoslavian | 6 | 0.2% | View All 27 Rows |
Immigrants in Trinity
The most numerous immigrant groups reported in Trinity came from Latin America (103 | 4.1%), Central America (99 | 3.9%), Mexico (82 | 3.3%), Canada (17 | 0.7%), and Guatemala (17 | 0.7%), together accounting for 12.7% of all Trinity residents.
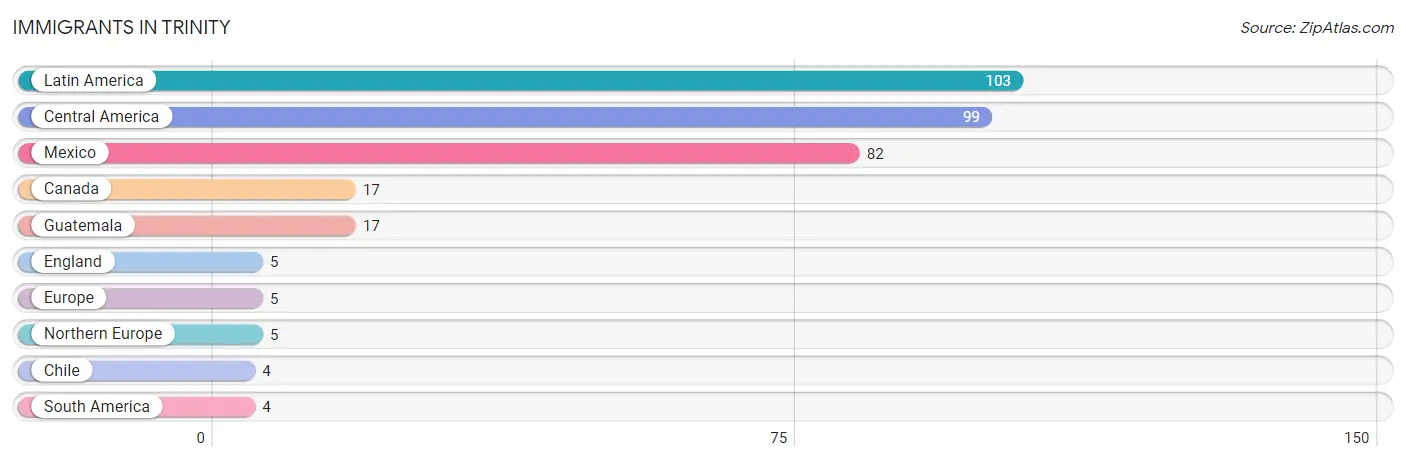
| Immigration Origin | # Population | % Population |
| Canada | 17 | 0.7% |
| Central America | 99 | 3.9% |
| Chile | 4 | 0.2% |
| England | 5 | 0.2% |
| Europe | 5 | 0.2% |
| Guatemala | 17 | 0.7% |
| Latin America | 103 | 4.1% |
| Mexico | 82 | 3.3% |
| Northern Europe | 5 | 0.2% |
| South America | 4 | 0.2% | View All 10 Rows |
Sex and Age in Trinity
Sex and Age in Trinity
The most populous age groups in Trinity are 5 to 9 Years (151 | 11.2%) for men and 50 to 54 Years (130 | 11.2%) for women.
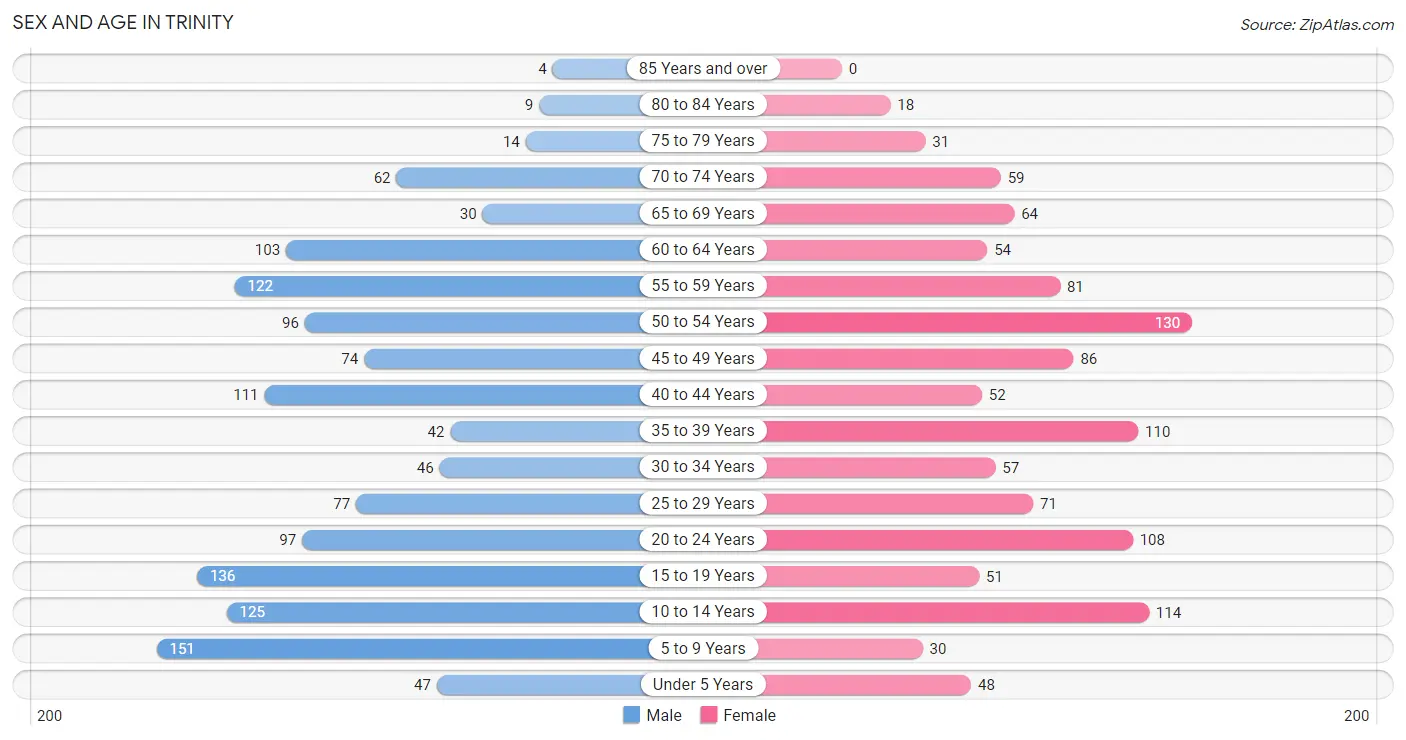
| Age Bracket | Male | Female |
| Under 5 Years | 47 (3.5%) | 48 (4.1%) |
| 5 to 9 Years | 151 (11.2%) | 30 (2.6%) |
| 10 to 14 Years | 125 (9.3%) | 114 (9.8%) |
| 15 to 19 Years | 136 (10.1%) | 51 (4.4%) |
| 20 to 24 Years | 97 (7.2%) | 108 (9.3%) |
| 25 to 29 Years | 77 (5.7%) | 71 (6.1%) |
| 30 to 34 Years | 46 (3.4%) | 57 (4.9%) |
| 35 to 39 Years | 42 (3.1%) | 110 (9.5%) |
| 40 to 44 Years | 111 (8.3%) | 52 (4.5%) |
| 45 to 49 Years | 74 (5.5%) | 86 (7.4%) |
| 50 to 54 Years | 96 (7.1%) | 130 (11.2%) |
| 55 to 59 Years | 122 (9.1%) | 81 (7.0%) |
| 60 to 64 Years | 103 (7.6%) | 54 (4.6%) |
| 65 to 69 Years | 30 (2.2%) | 64 (5.5%) |
| 70 to 74 Years | 62 (4.6%) | 59 (5.1%) |
| 75 to 79 Years | 14 (1.0%) | 31 (2.7%) |
| 80 to 84 Years | 9 (0.7%) | 18 (1.5%) |
| 85 Years and over | 4 (0.3%) | 0 (0.0%) |
| Total | 1,346 (100.0%) | 1,164 (100.0%) |
Families and Households in Trinity
Median Family Size in Trinity
The median family size in Trinity is 3.36 persons per family, with single male/father families (10 | 1.5%) accounting for the largest median family size of 4.2 persons per family. On the other hand, single female/mother families (115 | 17.4%) represent the smallest median family size with 3.21 persons per family.
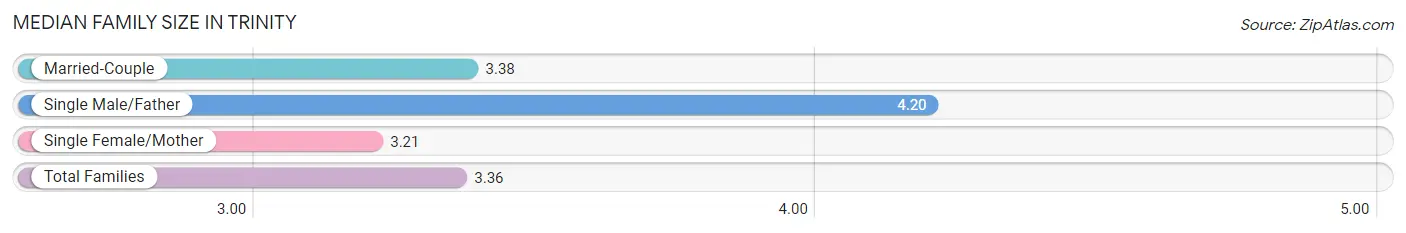
| Family Type | # Families | Family Size |
| Married-Couple | 534 (81.0%) | 3.38 |
| Single Male/Father | 10 (1.5%) | 4.20 |
| Single Female/Mother | 115 (17.4%) | 3.21 |
| Total Families | 659 (100.0%) | 3.36 |
Median Household Size in Trinity
The median household size in Trinity is 2.85 persons per household, with single male/father households (10 | 1.1%) accounting for the largest median household size of 4.2 persons per household. non-family households (221 | 25.1%) represent the smallest median household size with 1.16 persons per household.
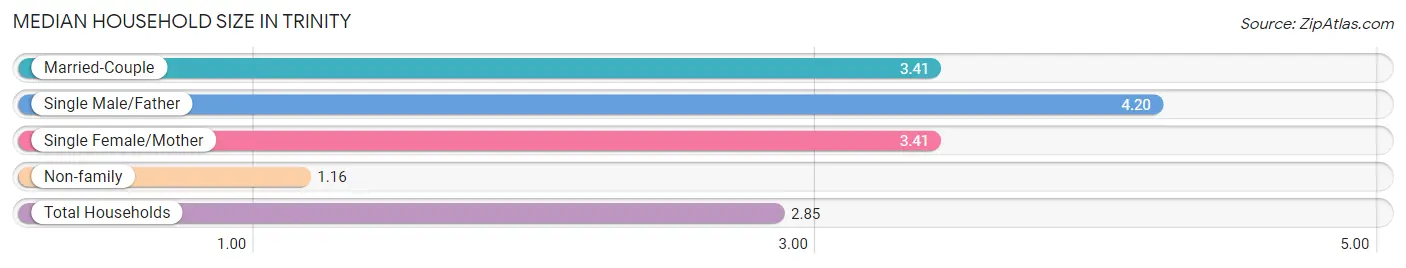
| Household Type | # Households | Household Size |
| Married-Couple | 534 (60.7%) | 3.41 |
| Single Male/Father | 10 (1.1%) | 4.20 |
| Single Female/Mother | 115 (13.1%) | 3.41 |
| Non-family | 221 (25.1%) | 1.16 |
| Total Households | 880 (100.0%) | 2.85 |
Household Size by Marriage Status in Trinity
Out of a total of 880 households in Trinity, 659 (74.9%) are family households, while 221 (25.1%) are nonfamily households. The most numerous type of family households are 3-person households, comprising 251, and the most common type of nonfamily households are 1-person households, comprising 181.
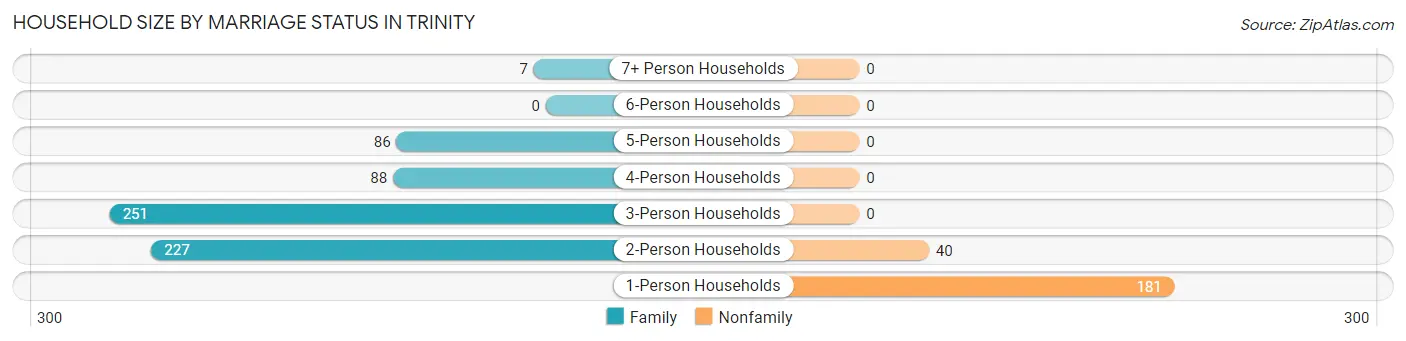
| Household Size | Family Households | Nonfamily Households |
| 1-Person Households | - | 181 (20.6%) |
| 2-Person Households | 227 (25.8%) | 40 (4.5%) |
| 3-Person Households | 251 (28.5%) | 0 (0.0%) |
| 4-Person Households | 88 (10.0%) | 0 (0.0%) |
| 5-Person Households | 86 (9.8%) | 0 (0.0%) |
| 6-Person Households | 0 (0.0%) | 0 (0.0%) |
| 7+ Person Households | 7 (0.8%) | 0 (0.0%) |
| Total | 659 (74.9%) | 221 (25.1%) |
Female Fertility in Trinity
Fertility by Age in Trinity
| Age Bracket | Women with Births | Births / 1,000 Women |
| 15 to 19 years | 0 (0.0%) | 0.0 |
| 20 to 34 years | 0 (0.0%) | 0.0 |
| 35 to 50 years | 0 (0.0%) | 0.0 |
| Total | 0 (0.0%) | 0.0 |
Fertility by Age by Marriage Status in Trinity
| Age Bracket | Married | Unmarried |
| 15 to 19 years | 0 (0.0%) | 0 (0.0%) |
| 20 to 34 years | 0 (0.0%) | 0 (0.0%) |
| 35 to 50 years | 0 (0.0%) | 0 (0.0%) |
| Total | 0 (0.0%) | 0 (0.0%) |
Fertility by Education in Trinity
| Educational Attainment | Women with Births | Births / 1,000 Women |
| Less than High School | 0 (0.0%) | 0.0 |
| High School Diploma | 0 (0.0%) | 0.0 |
| College or Associate's Degree | 0 (0.0%) | 0.0 |
| Bachelor's Degree | 0 (0.0%) | 0.0 |
| Graduate Degree | 0 (0.0%) | 0.0 |
| Total | 0 (0.0%) | 0.0 |
Fertility by Education by Marriage Status in Trinity
| Educational Attainment | Married | Unmarried |
| Less than High School | 0 (0.0%) | 0 (0.0%) |
| High School Diploma | 0 (0.0%) | 0 (0.0%) |
| College or Associate's Degree | 0 (0.0%) | 0 (0.0%) |
| Bachelor's Degree | 0 (0.0%) | 0 (0.0%) |
| Graduate Degree | 0 (0.0%) | 0 (0.0%) |
| Total | 0 (0.0%) | 0 (0.0%) |
Employment Characteristics in Trinity
Employment by Class of Employer in Trinity
Among the 1,272 employed individuals in Trinity, private company employees (969 | 76.2%), federal government employees (93 | 7.3%), and local government employees (60 | 4.7%) make up the most common classes of employment.
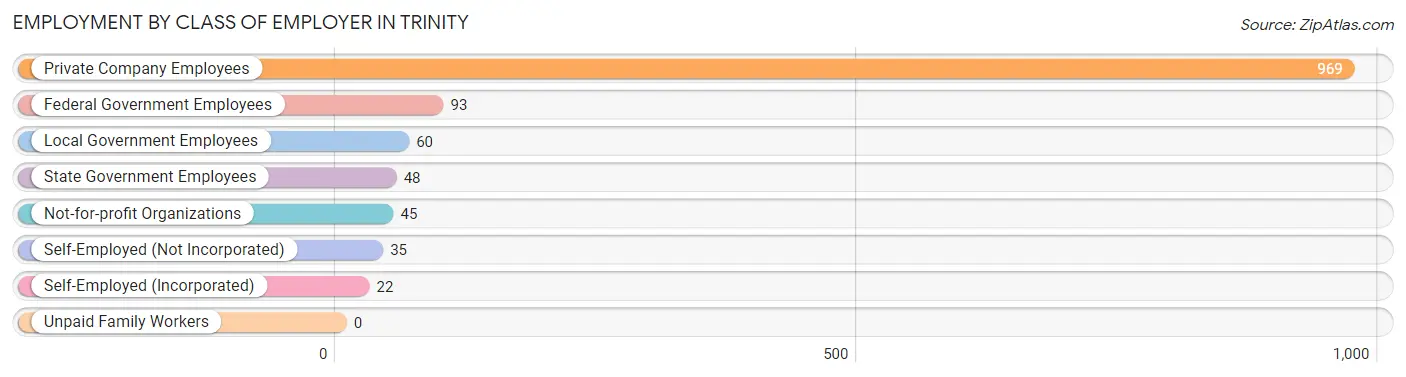
| Employer Class | # Employees | % Employees |
| Private Company Employees | 969 | 76.2% |
| Self-Employed (Incorporated) | 22 | 1.7% |
| Self-Employed (Not Incorporated) | 35 | 2.8% |
| Not-for-profit Organizations | 45 | 3.5% |
| Local Government Employees | 60 | 4.7% |
| State Government Employees | 48 | 3.8% |
| Federal Government Employees | 93 | 7.3% |
| Unpaid Family Workers | 0 | 0.0% |
| Total | 1,272 | 100.0% |
Employment Status by Age in Trinity
According to the labor force statistics for Trinity, out of the total population over 16 years of age (1,983), 66.3% or 1,315 individuals are in the labor force, with 2.4% or 32 of them unemployed. The age group with the highest labor force participation rate is 25 to 29 years, with 97.3% or 144 individuals in the labor force. Within the labor force, the 55 to 59 years age range has the highest percentage of unemployed individuals, with 15.0% or 19 of them being unemployed.
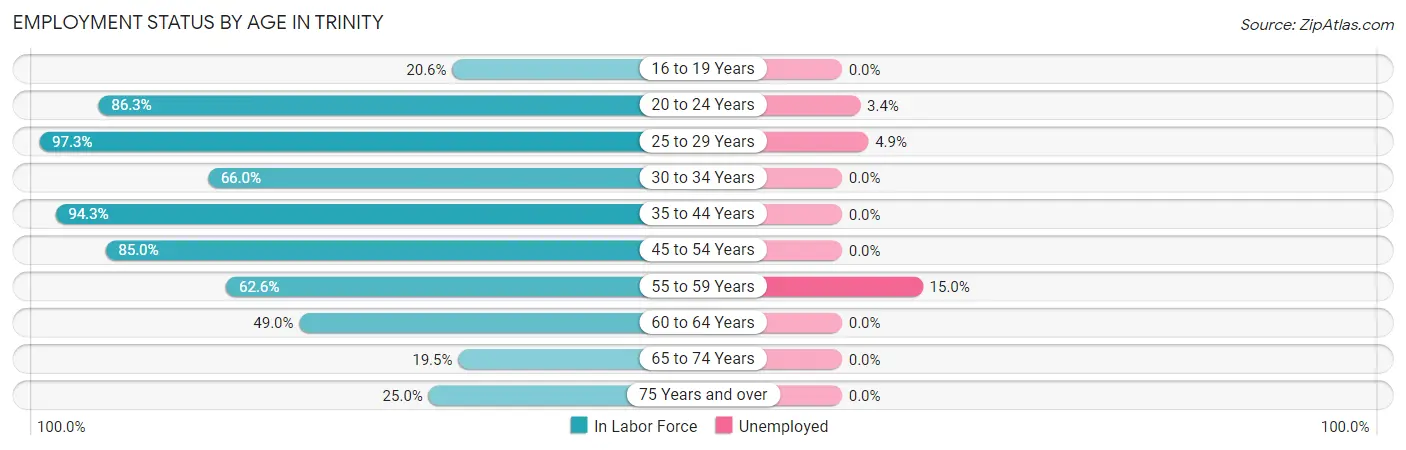
| Age Bracket | In Labor Force | Unemployed |
| 16 to 19 Years | 36 (20.6%) | 0 (0.0%) |
| 20 to 24 Years | 177 (86.3%) | 6 (3.4%) |
| 25 to 29 Years | 144 (97.3%) | 7 (4.9%) |
| 30 to 34 Years | 68 (66.0%) | 0 (0.0%) |
| 35 to 44 Years | 297 (94.3%) | 0 (0.0%) |
| 45 to 54 Years | 328 (85.0%) | 0 (0.0%) |
| 55 to 59 Years | 127 (62.6%) | 19 (15.0%) |
| 60 to 64 Years | 77 (49.0%) | 0 (0.0%) |
| 65 to 74 Years | 42 (19.5%) | 0 (0.0%) |
| 75 Years and over | 19 (25.0%) | 0 (0.0%) |
| Total | 1,315 (66.3%) | 32 (2.4%) |
Employment Status by Educational Attainment in Trinity
According to labor force statistics for Trinity, 79.3% of individuals (1,040) out of the total population between 25 and 64 years of age (1,312) are in the labor force, with 2.5% or 26 of them being unemployed. The group with the highest labor force participation rate are those with the educational attainment of bachelor's degree or higher, with 97.4% or 189 individuals in the labor force. Within the labor force, individuals with high school diploma education have the highest percentage of unemployment, with 5.2% or 19 of them being unemployed.
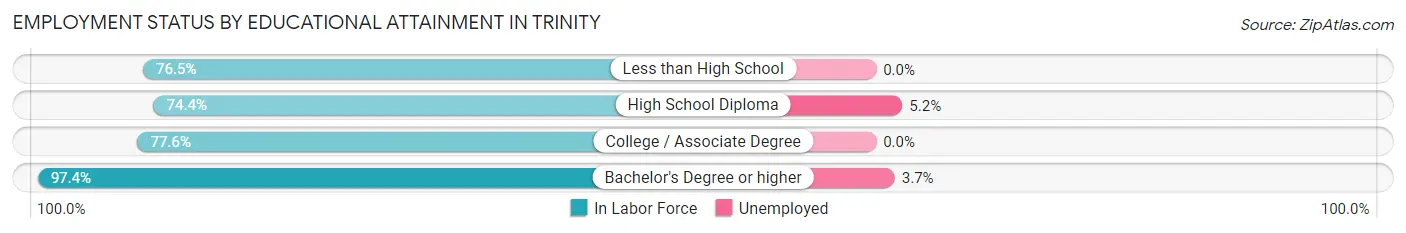
| Educational Attainment | In Labor Force | Unemployed |
| Less than High School | 26 (76.5%) | 0 (0.0%) |
| High School Diploma | 364 (74.4%) | 25 (5.2%) |
| College / Associate Degree | 462 (77.6%) | 0 (0.0%) |
| Bachelor's Degree or higher | 189 (97.4%) | 7 (3.7%) |
| Total | 1,040 (79.3%) | 33 (2.5%) |
Employment Occupations by Sex in Trinity
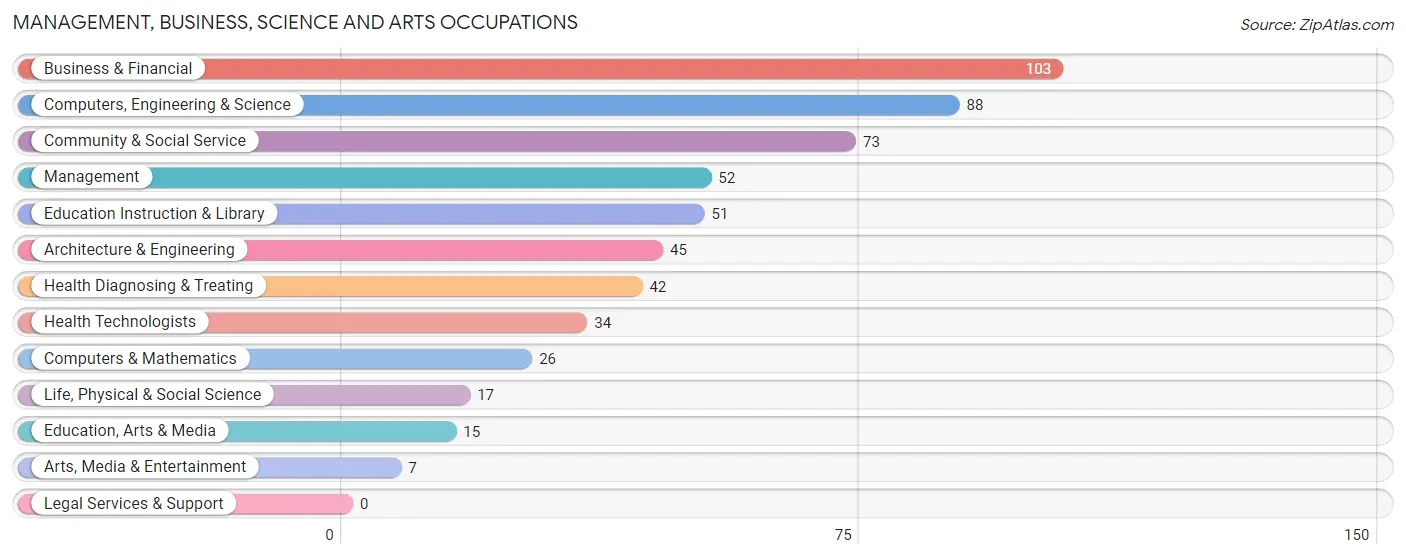
Management, Business, Science and Arts Occupations
The most common Management, Business, Science and Arts occupations in Trinity are Business & Financial (103 | 8.0%), Computers, Engineering & Science (88 | 6.9%), Community & Social Service (73 | 5.7%), Management (52 | 4.1%), and Education Instruction & Library (51 | 4.0%).
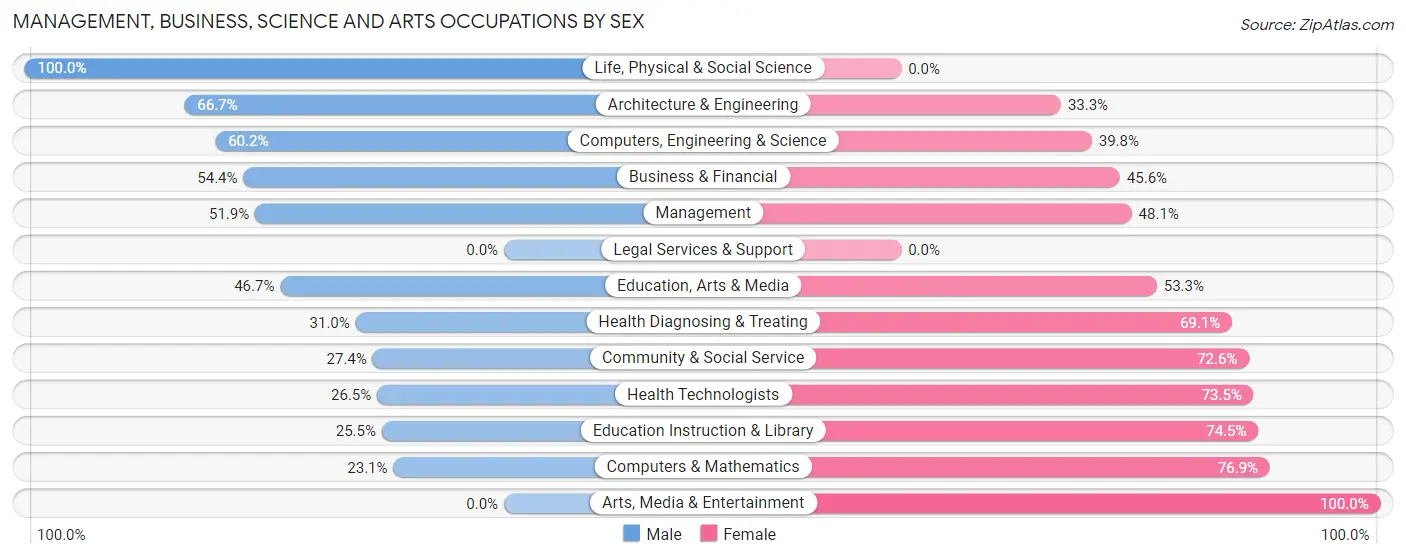
Management, Business, Science and Arts Occupations by Sex
Within the Management, Business, Science and Arts occupations in Trinity, the most male-oriented occupations are Life, Physical & Social Science (100.0%), Architecture & Engineering (66.7%), and Computers, Engineering & Science (60.2%), while the most female-oriented occupations are Arts, Media & Entertainment (100.0%), Computers & Mathematics (76.9%), and Education Instruction & Library (74.5%).
| Occupation | Male | Female |
| Management | 27 (51.9%) | 25 (48.1%) |
| Business & Financial | 56 (54.4%) | 47 (45.6%) |
| Computers, Engineering & Science | 53 (60.2%) | 35 (39.8%) |
| Computers & Mathematics | 6 (23.1%) | 20 (76.9%) |
| Architecture & Engineering | 30 (66.7%) | 15 (33.3%) |
| Life, Physical & Social Science | 17 (100.0%) | 0 (0.0%) |
| Community & Social Service | 20 (27.4%) | 53 (72.6%) |
| Education, Arts & Media | 7 (46.7%) | 8 (53.3%) |
| Legal Services & Support | 0 (0.0%) | 0 (0.0%) |
| Education Instruction & Library | 13 (25.5%) | 38 (74.5%) |
| Arts, Media & Entertainment | 0 (0.0%) | 7 (100.0%) |
| Health Diagnosing & Treating | 13 (30.9%) | 29 (69.1%) |
| Health Technologists | 9 (26.5%) | 25 (73.5%) |
| Total (Category) | 169 (47.2%) | 189 (52.8%) |
| Total (Overall) | 663 (51.7%) | 620 (48.3%) |
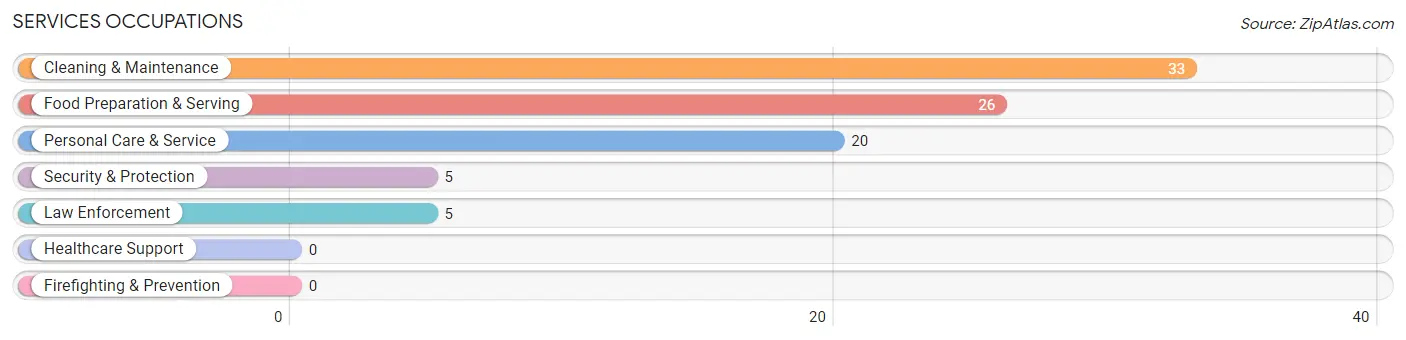
Services Occupations
The most common Services occupations in Trinity are Cleaning & Maintenance (33 | 2.6%), Food Preparation & Serving (26 | 2.0%), Personal Care & Service (20 | 1.6%), Security & Protection (5 | 0.4%), and Law Enforcement (5 | 0.4%).
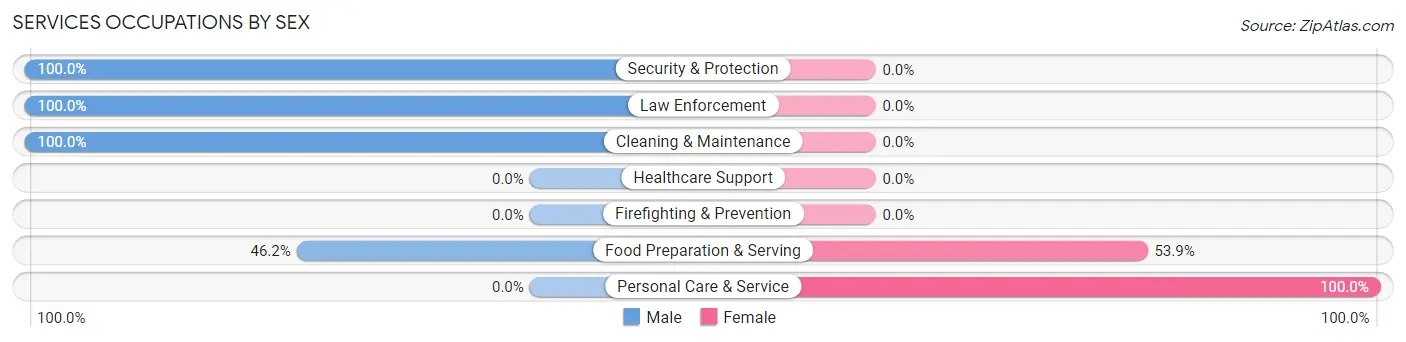
Services Occupations by Sex
Within the Services occupations in Trinity, the most male-oriented occupations are Security & Protection (100.0%), Law Enforcement (100.0%), and Cleaning & Maintenance (100.0%), while the most female-oriented occupations are Personal Care & Service (100.0%), and Food Preparation & Serving (53.8%).
| Occupation | Male | Female |
| Healthcare Support | 0 (0.0%) | 0 (0.0%) |
| Security & Protection | 5 (100.0%) | 0 (0.0%) |
| Firefighting & Prevention | 0 (0.0%) | 0 (0.0%) |
| Law Enforcement | 5 (100.0%) | 0 (0.0%) |
| Food Preparation & Serving | 12 (46.2%) | 14 (53.8%) |
| Cleaning & Maintenance | 33 (100.0%) | 0 (0.0%) |
| Personal Care & Service | 0 (0.0%) | 20 (100.0%) |
| Total (Category) | 50 (59.5%) | 34 (40.5%) |
| Total (Overall) | 663 (51.7%) | 620 (48.3%) |
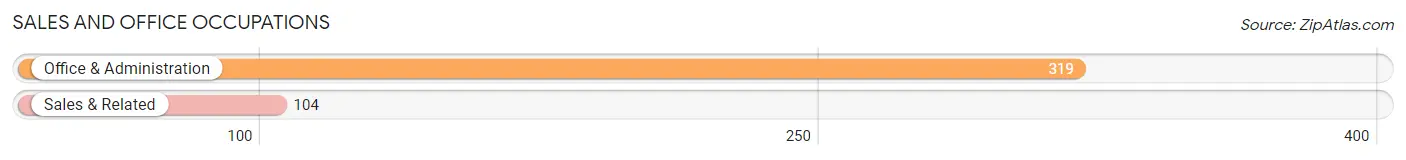
Sales and Office Occupations
The most common Sales and Office occupations in Trinity are Office & Administration (319 | 24.9%), and Sales & Related (104 | 8.1%).
Sales and Office Occupations by Sex
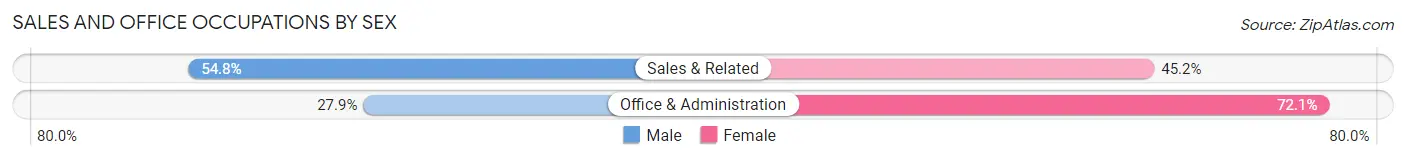
| Occupation | Male | Female |
| Sales & Related | 57 (54.8%) | 47 (45.2%) |
| Office & Administration | 89 (27.9%) | 230 (72.1%) |
| Total (Category) | 146 (34.5%) | 277 (65.5%) |
| Total (Overall) | 663 (51.7%) | 620 (48.3%) |
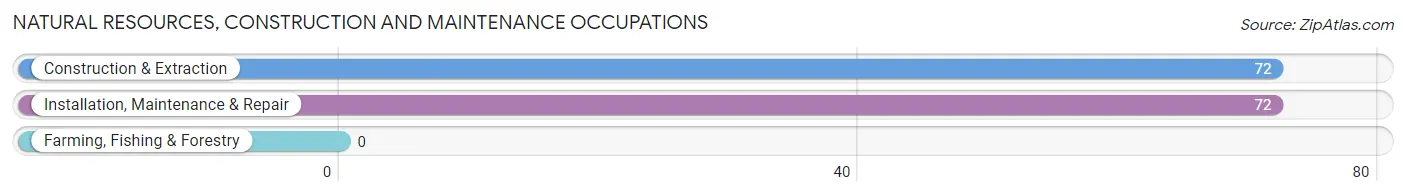
Natural Resources, Construction and Maintenance Occupations
The most common Natural Resources, Construction and Maintenance occupations in Trinity are Construction & Extraction (72 | 5.6%), and Installation, Maintenance & Repair (72 | 5.6%).
Natural Resources, Construction and Maintenance Occupations by Sex
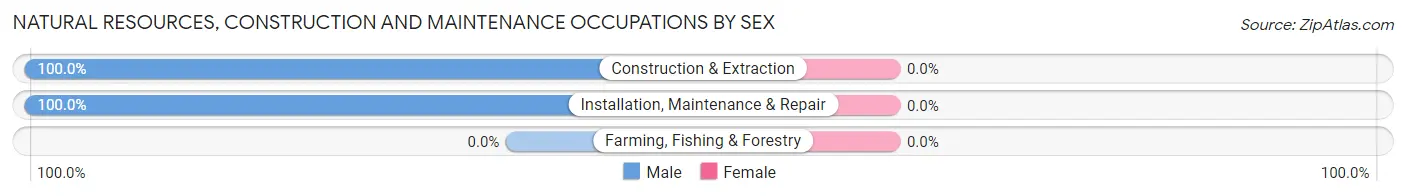
| Occupation | Male | Female |
| Farming, Fishing & Forestry | 0 (0.0%) | 0 (0.0%) |
| Construction & Extraction | 72 (100.0%) | 0 (0.0%) |
| Installation, Maintenance & Repair | 72 (100.0%) | 0 (0.0%) |
| Total (Category) | 144 (100.0%) | 0 (0.0%) |
| Total (Overall) | 663 (51.7%) | 620 (48.3%) |
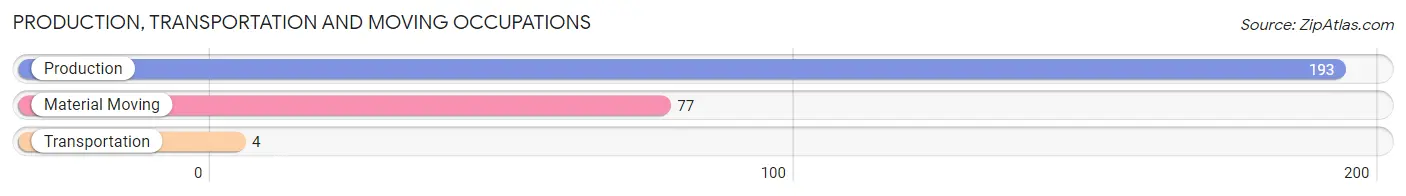
Production, Transportation and Moving Occupations
The most common Production, Transportation and Moving occupations in Trinity are Production (193 | 15.0%), Material Moving (77 | 6.0%), and Transportation (4 | 0.3%).
Production, Transportation and Moving Occupations by Sex
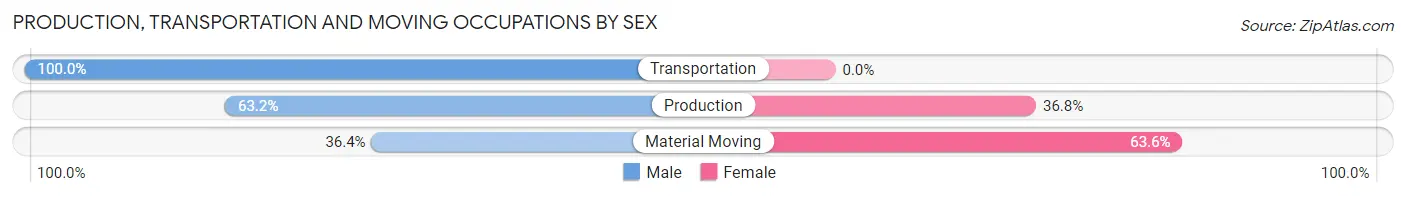
| Occupation | Male | Female |
| Production | 122 (63.2%) | 71 (36.8%) |
| Transportation | 4 (100.0%) | 0 (0.0%) |
| Material Moving | 28 (36.4%) | 49 (63.6%) |
| Total (Category) | 154 (56.2%) | 120 (43.8%) |
| Total (Overall) | 663 (51.7%) | 620 (48.3%) |
Employment Industries by Sex in Trinity
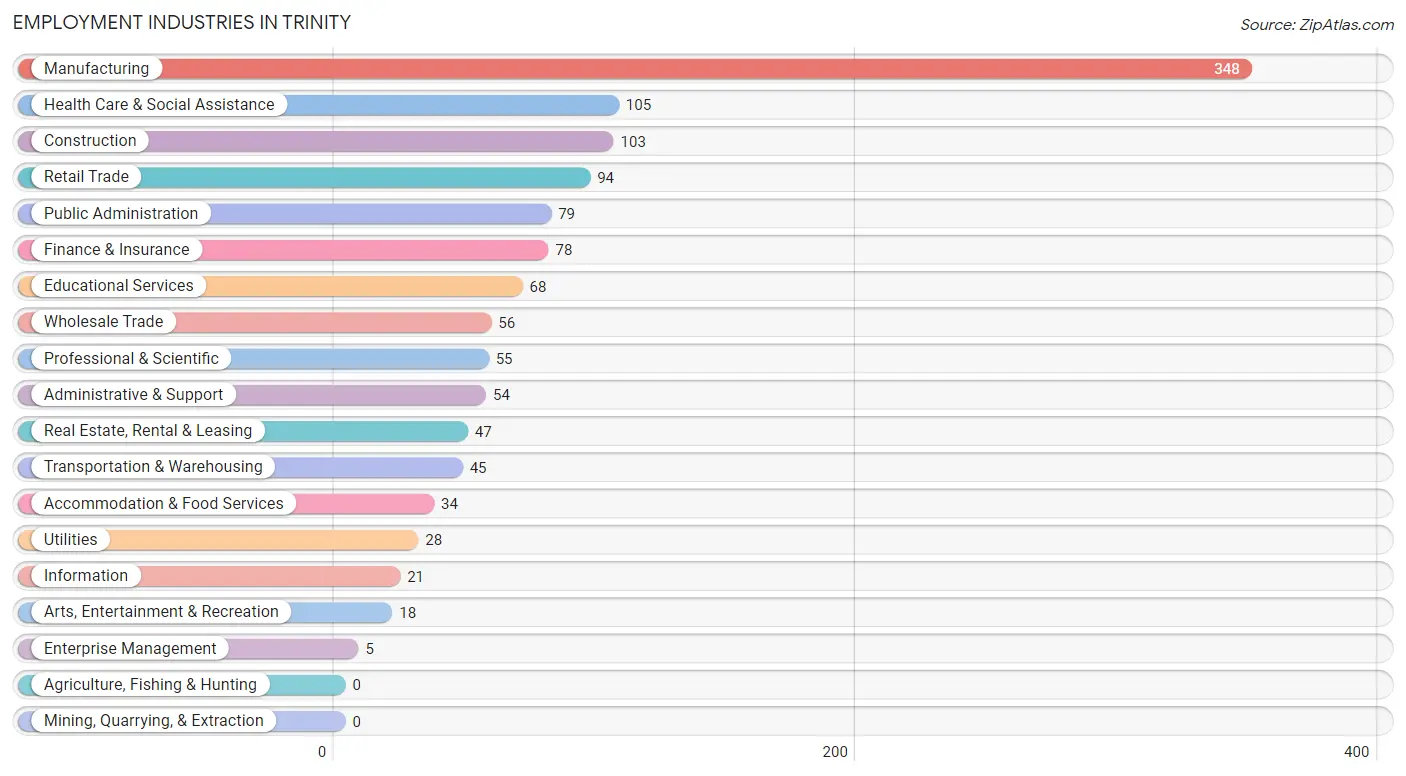
Employment Industries in Trinity
The major employment industries in Trinity include Manufacturing (348 | 27.1%), Health Care & Social Assistance (105 | 8.2%), Construction (103 | 8.0%), Retail Trade (94 | 7.3%), and Public Administration (79 | 6.2%).
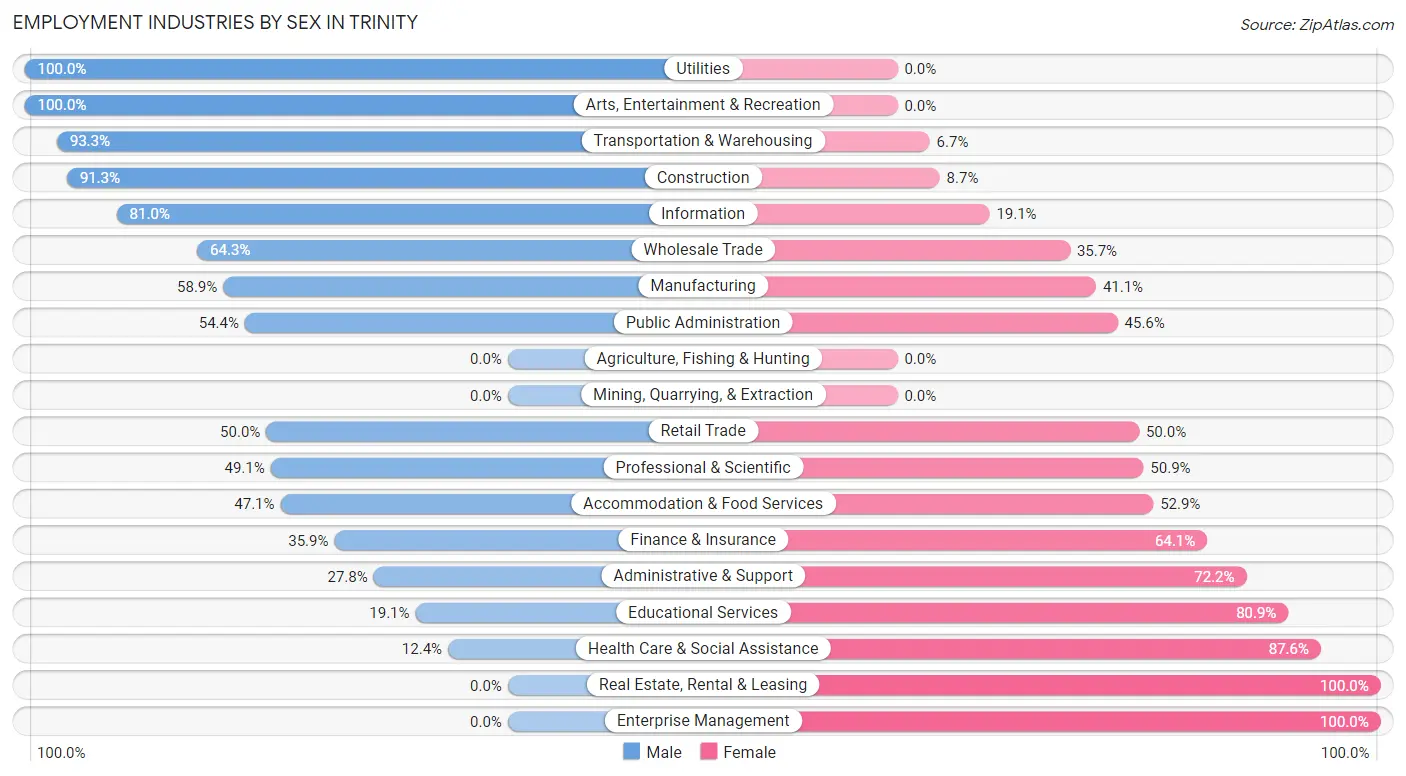
Employment Industries by Sex in Trinity
The Trinity industries that see more men than women are Utilities (100.0%), Arts, Entertainment & Recreation (100.0%), and Transportation & Warehousing (93.3%), whereas the industries that tend to have a higher number of women are Real Estate, Rental & Leasing (100.0%), Enterprise Management (100.0%), and Health Care & Social Assistance (87.6%).
| Industry | Male | Female |
| Agriculture, Fishing & Hunting | 0 (0.0%) | 0 (0.0%) |
| Mining, Quarrying, & Extraction | 0 (0.0%) | 0 (0.0%) |
| Construction | 94 (91.3%) | 9 (8.7%) |
| Manufacturing | 205 (58.9%) | 143 (41.1%) |
| Wholesale Trade | 36 (64.3%) | 20 (35.7%) |
| Retail Trade | 47 (50.0%) | 47 (50.0%) |
| Transportation & Warehousing | 42 (93.3%) | 3 (6.7%) |
| Utilities | 28 (100.0%) | 0 (0.0%) |
| Information | 17 (80.9%) | 4 (19.1%) |
| Finance & Insurance | 28 (35.9%) | 50 (64.1%) |
| Real Estate, Rental & Leasing | 0 (0.0%) | 47 (100.0%) |
| Professional & Scientific | 27 (49.1%) | 28 (50.9%) |
| Enterprise Management | 0 (0.0%) | 5 (100.0%) |
| Administrative & Support | 15 (27.8%) | 39 (72.2%) |
| Educational Services | 13 (19.1%) | 55 (80.9%) |
| Health Care & Social Assistance | 13 (12.4%) | 92 (87.6%) |
| Arts, Entertainment & Recreation | 18 (100.0%) | 0 (0.0%) |
| Accommodation & Food Services | 16 (47.1%) | 18 (52.9%) |
| Public Administration | 43 (54.4%) | 36 (45.6%) |
| Total | 663 (51.7%) | 620 (48.3%) |
Education in Trinity
School Enrollment in Trinity
The most common levels of schooling among the 712 students in Trinity are middle school (187 | 26.3%), high school (182 | 25.6%), and college / undergraduate (142 | 19.9%).
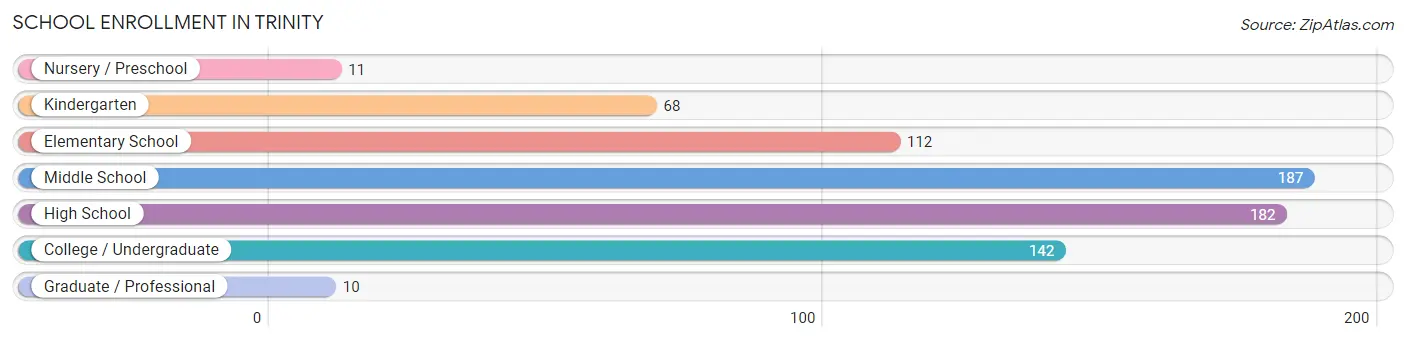
| School Level | # Students | % Students |
| Nursery / Preschool | 11 | 1.5% |
| Kindergarten | 68 | 9.6% |
| Elementary School | 112 | 15.7% |
| Middle School | 187 | 26.3% |
| High School | 182 | 25.6% |
| College / Undergraduate | 142 | 19.9% |
| Graduate / Professional | 10 | 1.4% |
| Total | 712 | 100.0% |
School Enrollment by Age by Funding Source in Trinity
Out of a total of 712 students who are enrolled in schools in Trinity, 199 (27.9%) attend a private institution, while the remaining 513 (72.1%) are enrolled in public schools. The age group of 35 years and over has the highest likelihood of being enrolled in private schools, with 23 (79.3% in the age bracket) enrolled. Conversely, the age group of 18 to 19 year olds has the lowest likelihood of being enrolled in a private school, with 33 (100.0% in the age bracket) attending a public institution.
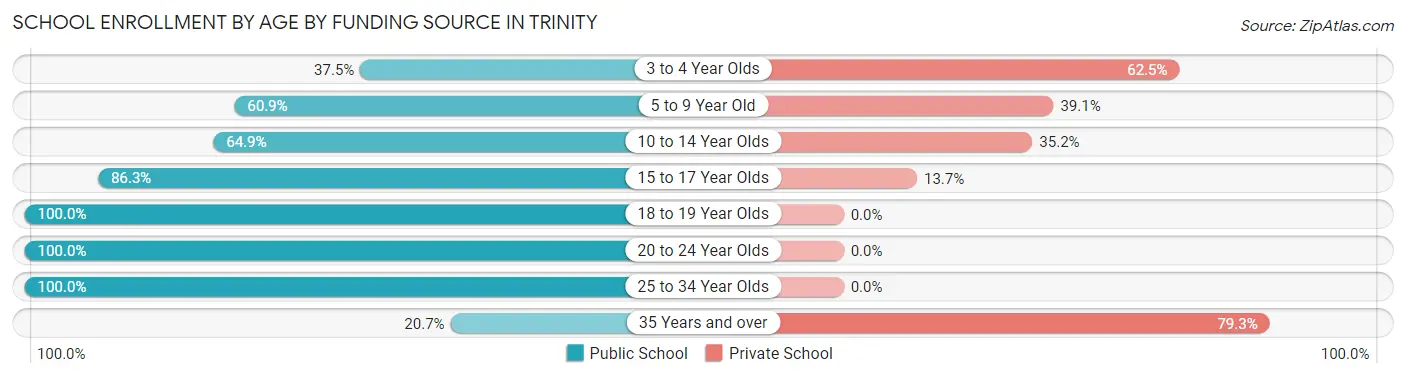
| Age Bracket | Public School | Private School |
| 3 to 4 Year Olds | 3 (37.5%) | 5 (62.5%) |
| 5 to 9 Year Old | 106 (60.9%) | 68 (39.1%) |
| 10 to 14 Year Olds | 155 (64.8%) | 84 (35.1%) |
| 15 to 17 Year Olds | 120 (86.3%) | 19 (13.7%) |
| 18 to 19 Year Olds | 33 (100.0%) | 0 (0.0%) |
| 20 to 24 Year Olds | 82 (100.0%) | 0 (0.0%) |
| 25 to 34 Year Olds | 8 (100.0%) | 0 (0.0%) |
| 35 Years and over | 6 (20.7%) | 23 (79.3%) |
| Total | 513 (72.1%) | 199 (27.9%) |
Educational Attainment by Field of Study in Trinity
Business (71 | 26.1%), engineering (48 | 17.6%), education (30 | 11.0%), computers & mathematics (23 | 8.5%), and science & technology (21 | 7.7%) are the most common fields of study among 272 individuals in Trinity who have obtained a bachelor's degree or higher.
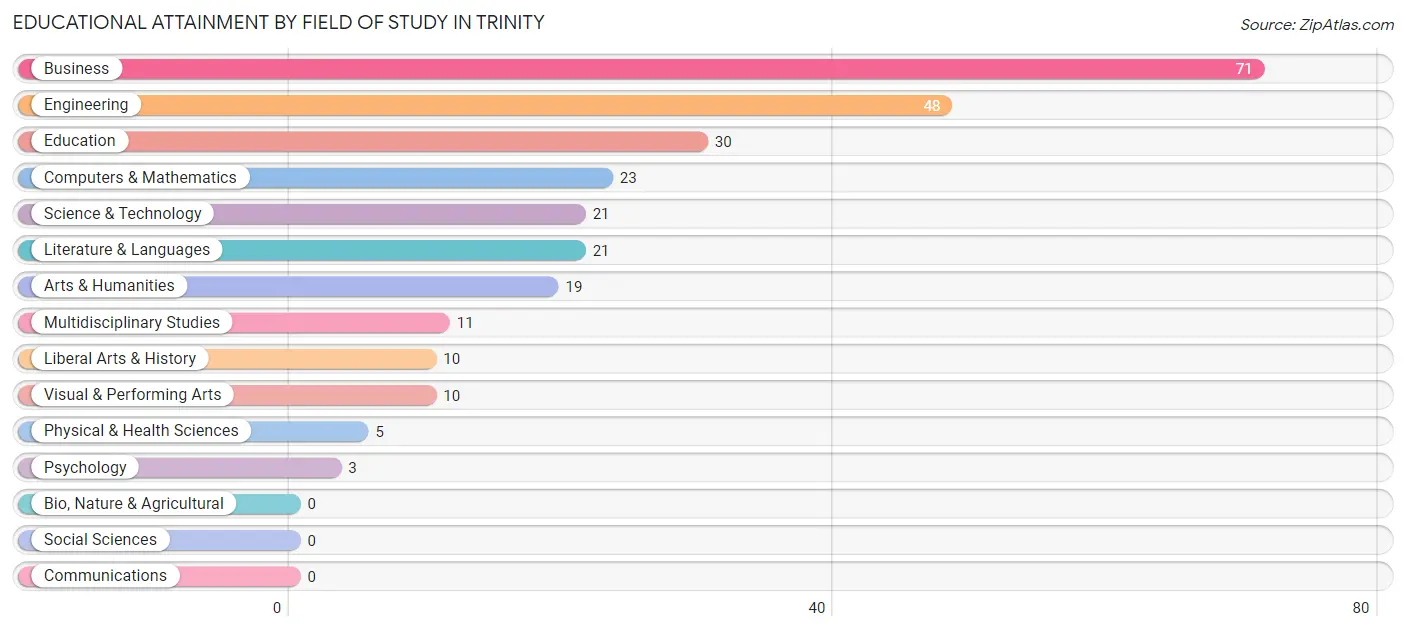
| Field of Study | # Graduates | % Graduates |
| Computers & Mathematics | 23 | 8.5% |
| Bio, Nature & Agricultural | 0 | 0.0% |
| Physical & Health Sciences | 5 | 1.8% |
| Psychology | 3 | 1.1% |
| Social Sciences | 0 | 0.0% |
| Engineering | 48 | 17.6% |
| Multidisciplinary Studies | 11 | 4.0% |
| Science & Technology | 21 | 7.7% |
| Business | 71 | 26.1% |
| Education | 30 | 11.0% |
| Literature & Languages | 21 | 7.7% |
| Liberal Arts & History | 10 | 3.7% |
| Visual & Performing Arts | 10 | 3.7% |
| Communications | 0 | 0.0% |
| Arts & Humanities | 19 | 7.0% |
| Total | 272 | 100.0% |
Transportation & Commute in Trinity
Vehicle Availability by Sex in Trinity
The most prevalent vehicle ownership categories in Trinity are males with 3 vehicles (249, accounting for 38.0%) and females with 3 vehicles (204, making up 40.4%).
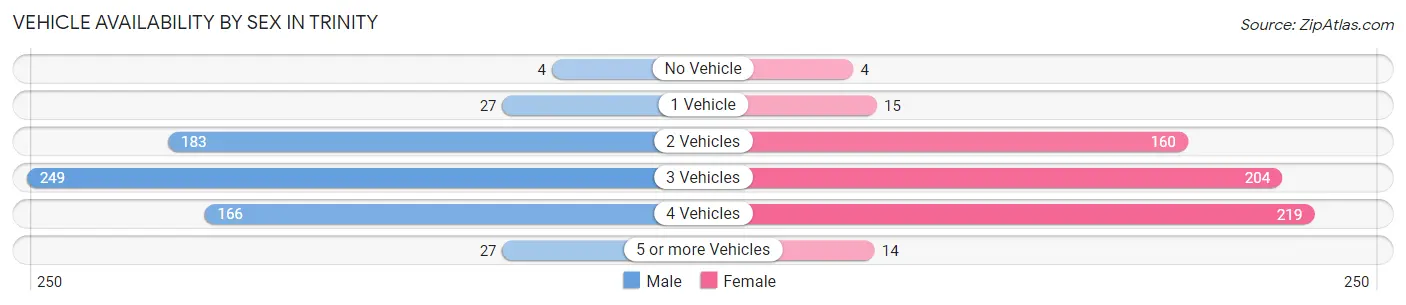
| Vehicles Available | Male | Female |
| No Vehicle | 4 (0.6%) | 4 (0.6%) |
| 1 Vehicle | 27 (4.1%) | 15 (2.4%) |
| 2 Vehicles | 183 (27.9%) | 160 (26.0%) |
| 3 Vehicles | 249 (38.0%) | 204 (33.1%) |
| 4 Vehicles | 166 (25.3%) | 219 (35.5%) |
| 5 or more Vehicles | 27 (4.1%) | 14 (2.3%) |
| Total | 656 (100.0%) | 616 (100.0%) |
Commute Time in Trinity
The most frequently occuring commute durations in Trinity are 20 to 24 minutes (361 commuters, 29.5%), 15 to 19 minutes (235 commuters, 19.2%), and 10 to 14 minutes (191 commuters, 15.6%).
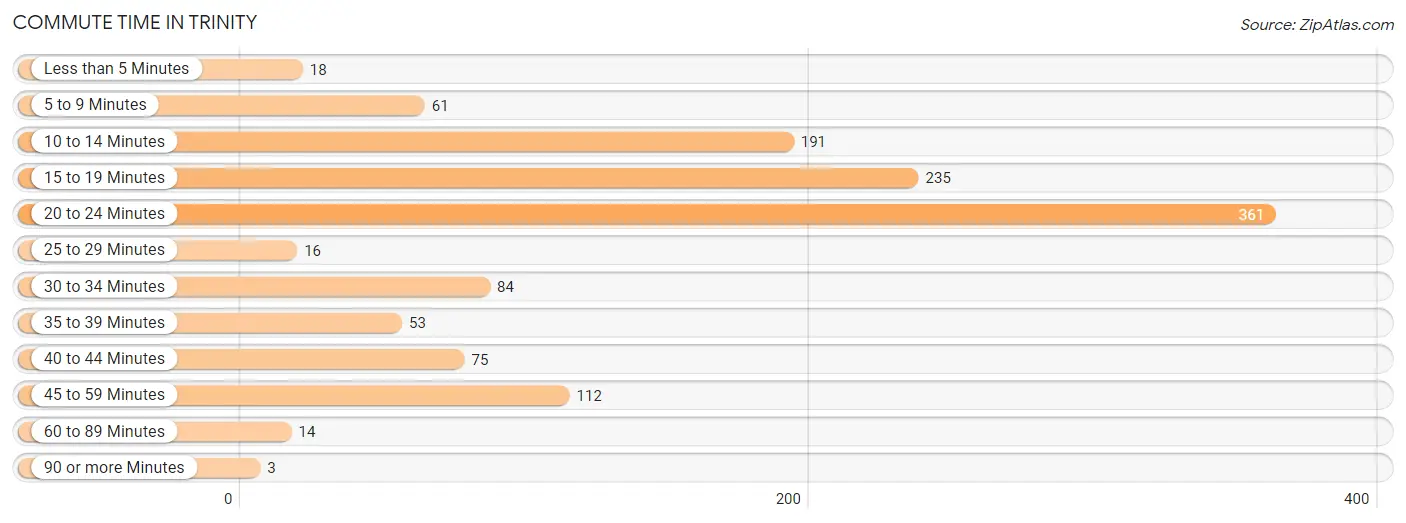
| Commute Time | # Commuters | % Commuters |
| Less than 5 Minutes | 18 | 1.5% |
| 5 to 9 Minutes | 61 | 5.0% |
| 10 to 14 Minutes | 191 | 15.6% |
| 15 to 19 Minutes | 235 | 19.2% |
| 20 to 24 Minutes | 361 | 29.5% |
| 25 to 29 Minutes | 16 | 1.3% |
| 30 to 34 Minutes | 84 | 6.9% |
| 35 to 39 Minutes | 53 | 4.3% |
| 40 to 44 Minutes | 75 | 6.1% |
| 45 to 59 Minutes | 112 | 9.2% |
| 60 to 89 Minutes | 14 | 1.1% |
| 90 or more Minutes | 3 | 0.3% |
Commute Time by Sex in Trinity
The most common commute times in Trinity are 20 to 24 minutes (166 commuters, 26.7%) for males and 20 to 24 minutes (195 commuters, 32.5%) for females.
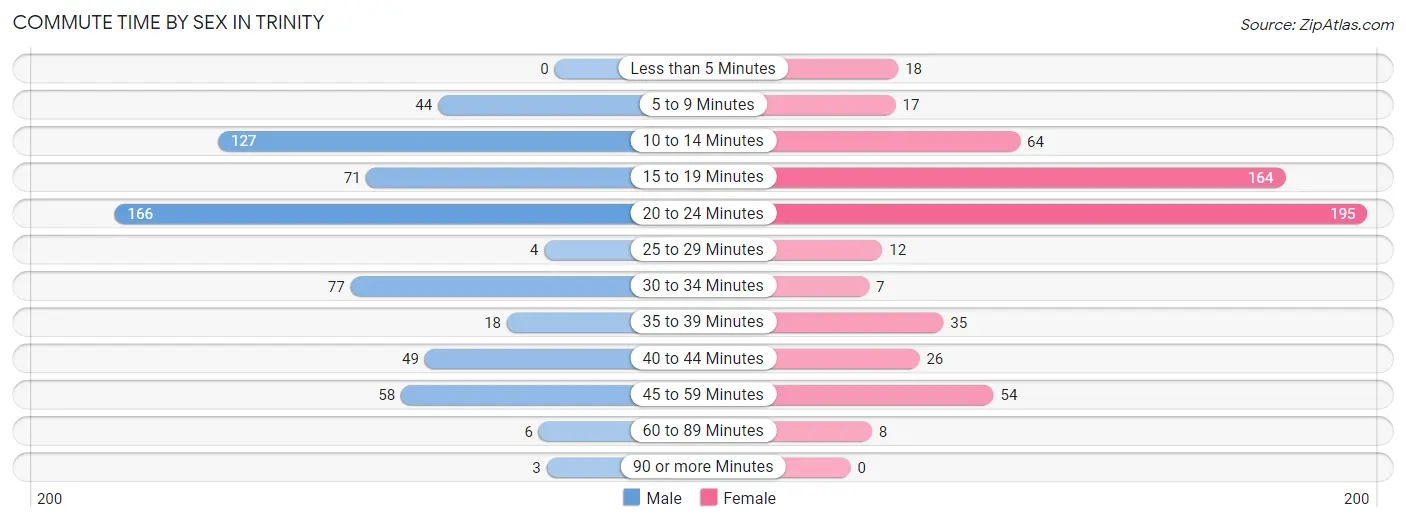
| Commute Time | Male | Female |
| Less than 5 Minutes | 0 (0.0%) | 18 (3.0%) |
| 5 to 9 Minutes | 44 (7.1%) | 17 (2.8%) |
| 10 to 14 Minutes | 127 (20.4%) | 64 (10.7%) |
| 15 to 19 Minutes | 71 (11.4%) | 164 (27.3%) |
| 20 to 24 Minutes | 166 (26.7%) | 195 (32.5%) |
| 25 to 29 Minutes | 4 (0.6%) | 12 (2.0%) |
| 30 to 34 Minutes | 77 (12.4%) | 7 (1.2%) |
| 35 to 39 Minutes | 18 (2.9%) | 35 (5.8%) |
| 40 to 44 Minutes | 49 (7.9%) | 26 (4.3%) |
| 45 to 59 Minutes | 58 (9.3%) | 54 (9.0%) |
| 60 to 89 Minutes | 6 (1.0%) | 8 (1.3%) |
| 90 or more Minutes | 3 (0.5%) | 0 (0.0%) |
Time of Departure to Work by Sex in Trinity
The most frequent times of departure to work in Trinity are 6:00 AM to 6:29 AM (145, 23.3%) for males and 7:30 AM to 7:59 AM (84, 14.0%) for females.
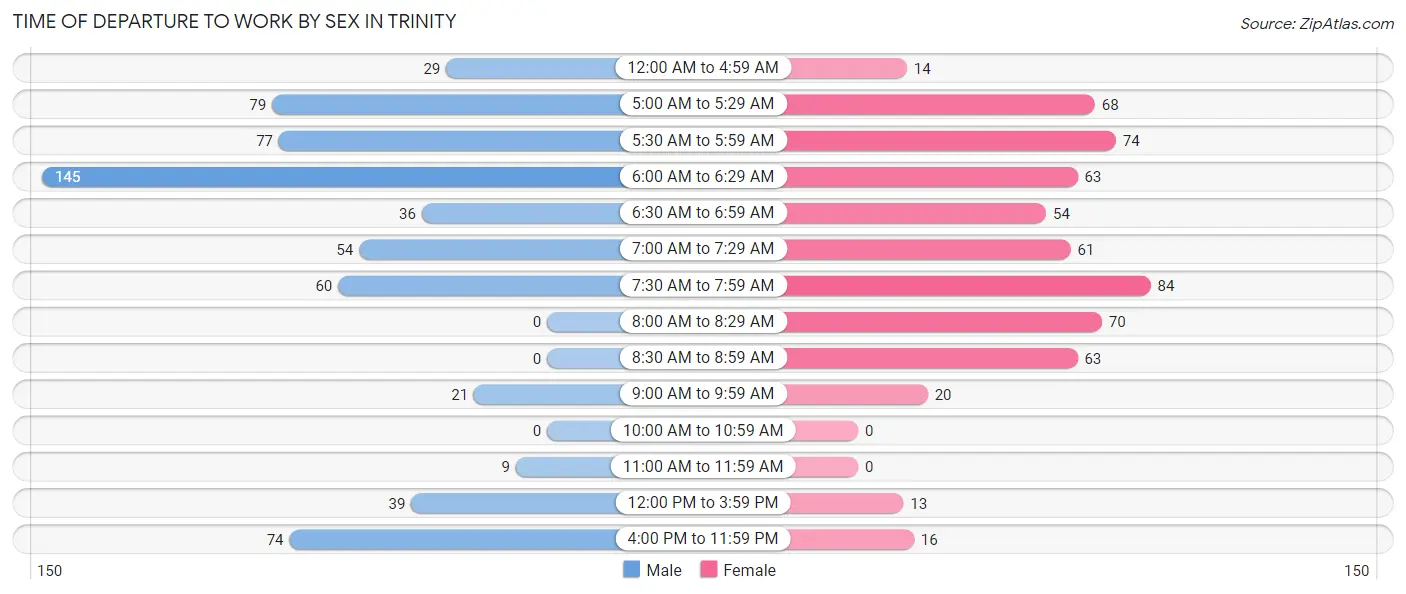
| Time of Departure | Male | Female |
| 12:00 AM to 4:59 AM | 29 (4.6%) | 14 (2.3%) |
| 5:00 AM to 5:29 AM | 79 (12.7%) | 68 (11.3%) |
| 5:30 AM to 5:59 AM | 77 (12.4%) | 74 (12.3%) |
| 6:00 AM to 6:29 AM | 145 (23.3%) | 63 (10.5%) |
| 6:30 AM to 6:59 AM | 36 (5.8%) | 54 (9.0%) |
| 7:00 AM to 7:29 AM | 54 (8.7%) | 61 (10.2%) |
| 7:30 AM to 7:59 AM | 60 (9.6%) | 84 (14.0%) |
| 8:00 AM to 8:29 AM | 0 (0.0%) | 70 (11.7%) |
| 8:30 AM to 8:59 AM | 0 (0.0%) | 63 (10.5%) |
| 9:00 AM to 9:59 AM | 21 (3.4%) | 20 (3.3%) |
| 10:00 AM to 10:59 AM | 0 (0.0%) | 0 (0.0%) |
| 11:00 AM to 11:59 AM | 9 (1.4%) | 0 (0.0%) |
| 12:00 PM to 3:59 PM | 39 (6.3%) | 13 (2.2%) |
| 4:00 PM to 11:59 PM | 74 (11.9%) | 16 (2.7%) |
| Total | 623 (100.0%) | 600 (100.0%) |
Housing Occupancy in Trinity
Occupancy by Ownership in Trinity
Of the total 880 dwellings in Trinity, owner-occupied units account for 792 (90.0%), while renter-occupied units make up 88 (10.0%).
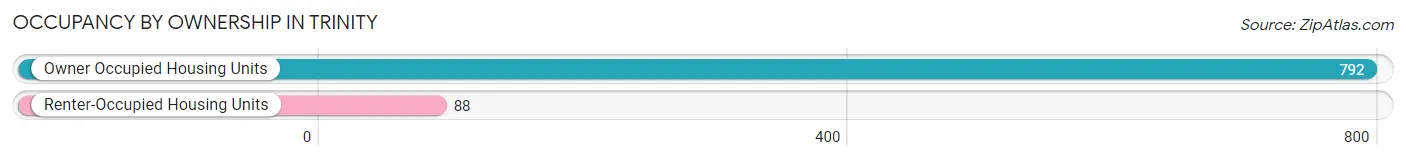
| Occupancy | # Housing Units | % Housing Units |
| Owner Occupied Housing Units | 792 | 90.0% |
| Renter-Occupied Housing Units | 88 | 10.0% |
| Total Occupied Housing Units | 880 | 100.0% |
Occupancy by Household Size in Trinity
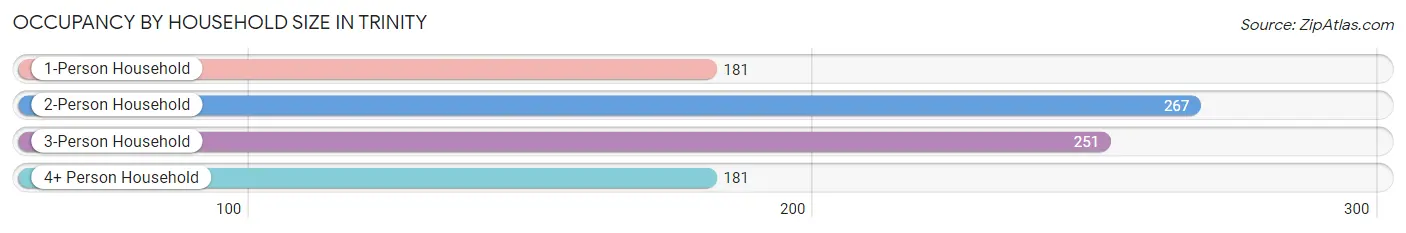
| Household Size | # Housing Units | % Housing Units |
| 1-Person Household | 181 | 20.6% |
| 2-Person Household | 267 | 30.3% |
| 3-Person Household | 251 | 28.5% |
| 4+ Person Household | 181 | 20.6% |
| Total Housing Units | 880 | 100.0% |
Occupancy by Ownership by Household Size in Trinity
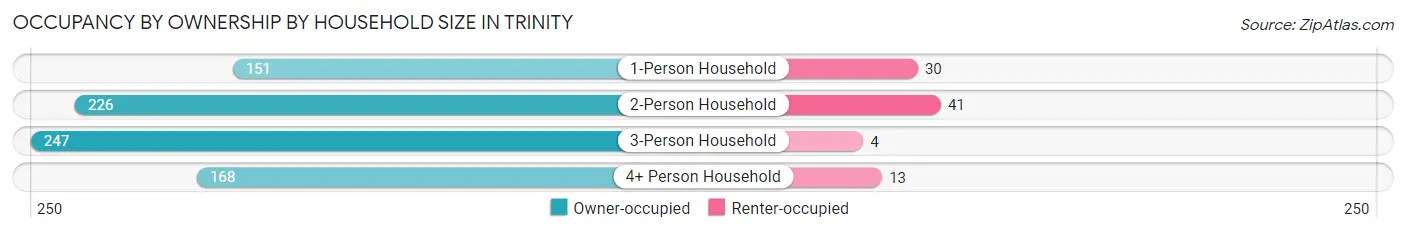
| Household Size | Owner-occupied | Renter-occupied |
| 1-Person Household | 151 (83.4%) | 30 (16.6%) |
| 2-Person Household | 226 (84.6%) | 41 (15.4%) |
| 3-Person Household | 247 (98.4%) | 4 (1.6%) |
| 4+ Person Household | 168 (92.8%) | 13 (7.2%) |
| Total Housing Units | 792 (90.0%) | 88 (10.0%) |
Occupancy by Educational Attainment in Trinity
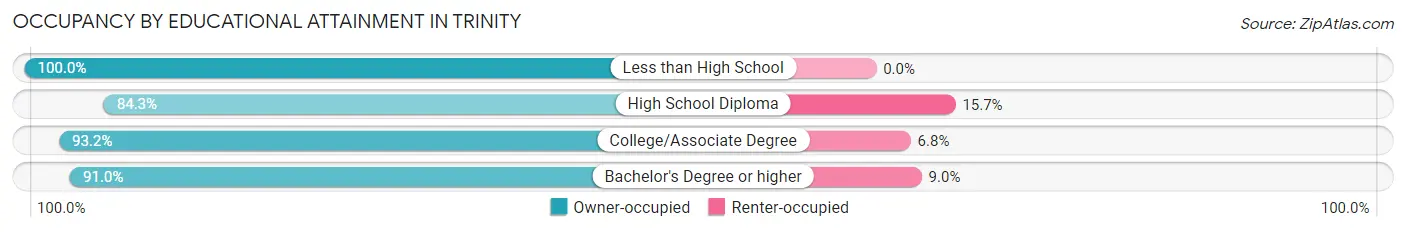
| Household Size | Owner-occupied | Renter-occupied |
| Less than High School | 24 (100.0%) | 0 (0.0%) |
| High School Diploma | 252 (84.3%) | 47 (15.7%) |
| College/Associate Degree | 395 (93.2%) | 29 (6.8%) |
| Bachelor's Degree or higher | 121 (91.0%) | 12 (9.0%) |
Occupancy by Age of Householder in Trinity
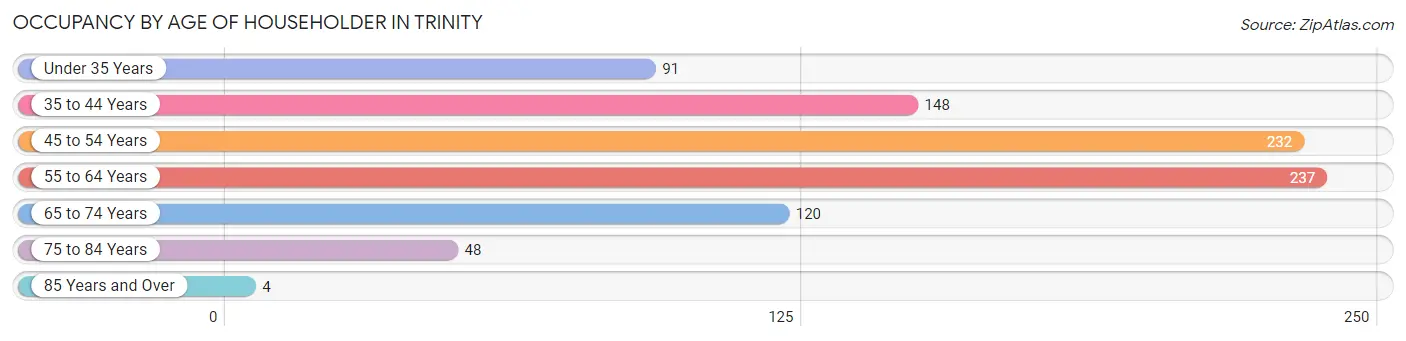
| Age Bracket | # Households | % Households |
| Under 35 Years | 91 | 10.3% |
| 35 to 44 Years | 148 | 16.8% |
| 45 to 54 Years | 232 | 26.4% |
| 55 to 64 Years | 237 | 26.9% |
| 65 to 74 Years | 120 | 13.6% |
| 75 to 84 Years | 48 | 5.4% |
| 85 Years and Over | 4 | 0.4% |
| Total | 880 | 100.0% |
Housing Finances in Trinity
Median Income by Occupancy in Trinity
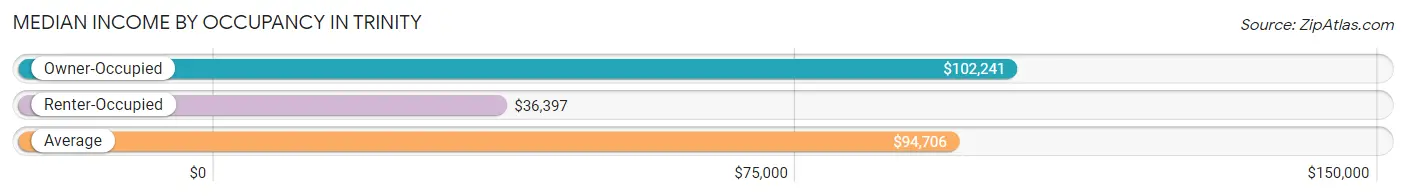
| Occupancy Type | # Households | Median Income |
| Owner-Occupied | 792 (90.0%) | $102,241 |
| Renter-Occupied | 88 (10.0%) | $36,397 |
| Average | 880 (100.0%) | $94,706 |
Occupancy by Householder Income Bracket in Trinity
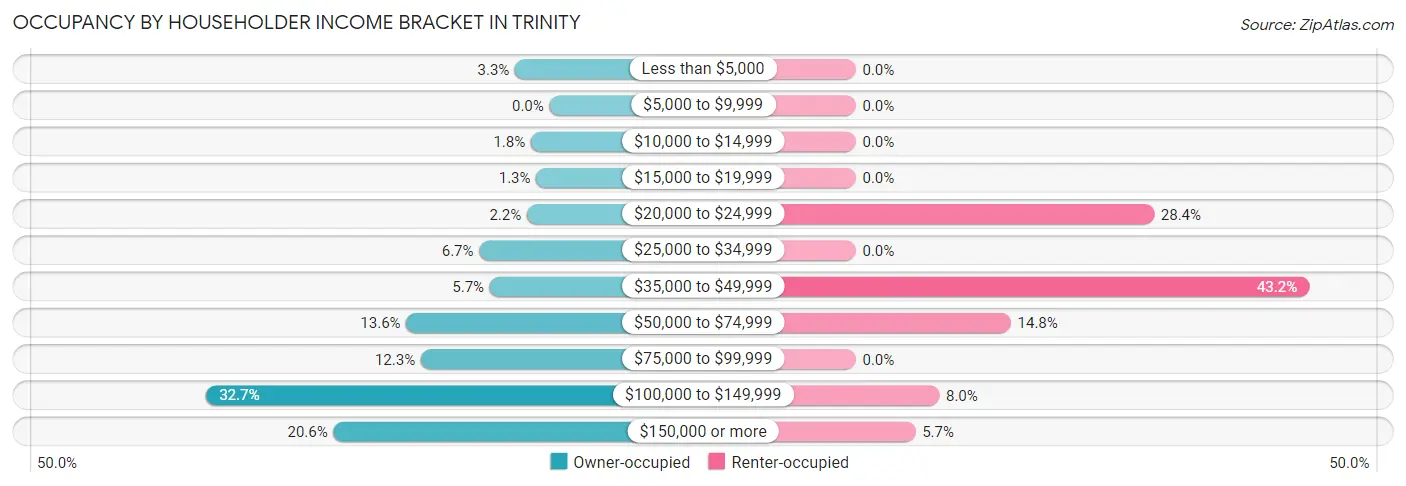
| Income Bracket | Owner-occupied | Renter-occupied |
| Less than $5,000 | 26 (3.3%) | 0 (0.0%) |
| $5,000 to $9,999 | 0 (0.0%) | 0 (0.0%) |
| $10,000 to $14,999 | 14 (1.8%) | 0 (0.0%) |
| $15,000 to $19,999 | 10 (1.3%) | 0 (0.0%) |
| $20,000 to $24,999 | 17 (2.1%) | 25 (28.4%) |
| $25,000 to $34,999 | 53 (6.7%) | 0 (0.0%) |
| $35,000 to $49,999 | 45 (5.7%) | 38 (43.2%) |
| $50,000 to $74,999 | 108 (13.6%) | 13 (14.8%) |
| $75,000 to $99,999 | 97 (12.2%) | 0 (0.0%) |
| $100,000 to $149,999 | 259 (32.7%) | 7 (8.0%) |
| $150,000 or more | 163 (20.6%) | 5 (5.7%) |
| Total | 792 (100.0%) | 88 (100.0%) |
Monthly Housing Cost Tiers in Trinity
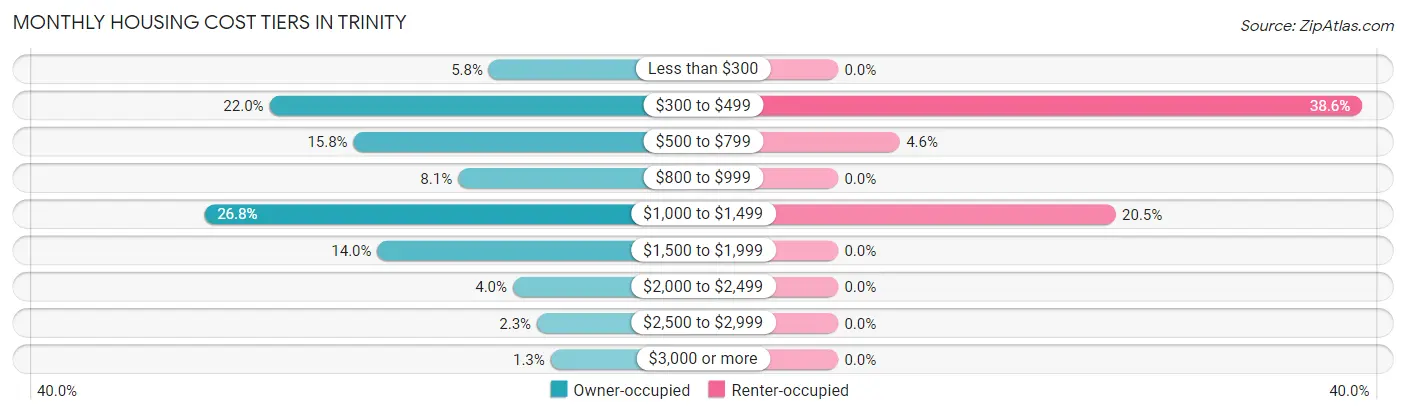
| Monthly Cost | Owner-occupied | Renter-occupied |
| Less than $300 | 46 (5.8%) | 0 (0.0%) |
| $300 to $499 | 174 (22.0%) | 34 (38.6%) |
| $500 to $799 | 125 (15.8%) | 4 (4.5%) |
| $800 to $999 | 64 (8.1%) | 0 (0.0%) |
| $1,000 to $1,499 | 212 (26.8%) | 18 (20.4%) |
| $1,500 to $1,999 | 111 (14.0%) | 0 (0.0%) |
| $2,000 to $2,499 | 32 (4.0%) | 0 (0.0%) |
| $2,500 to $2,999 | 18 (2.3%) | 0 (0.0%) |
| $3,000 or more | 10 (1.3%) | 0 (0.0%) |
| Total | 792 (100.0%) | 88 (100.0%) |
Physical Housing Characteristics in Trinity
Housing Structures in Trinity
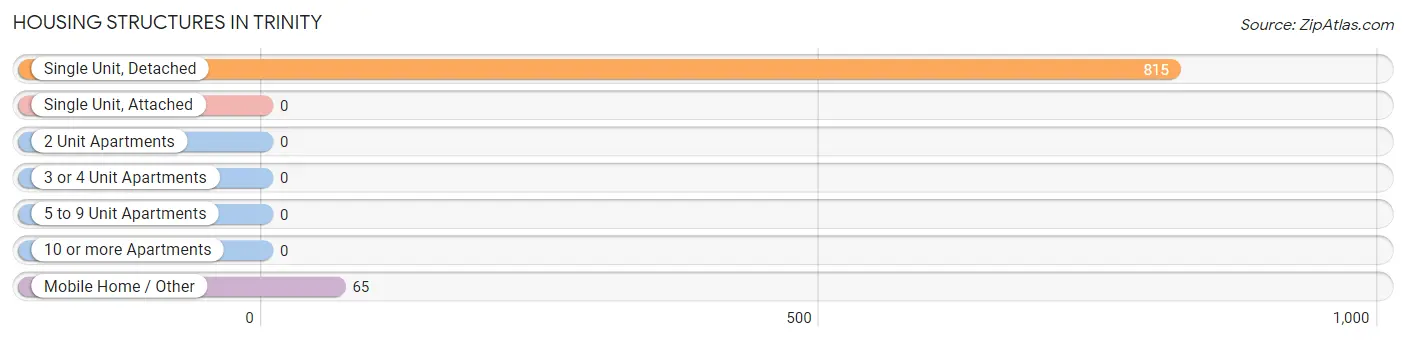
| Structure Type | # Housing Units | % Housing Units |
| Single Unit, Detached | 815 | 92.6% |
| Single Unit, Attached | 0 | 0.0% |
| 2 Unit Apartments | 0 | 0.0% |
| 3 or 4 Unit Apartments | 0 | 0.0% |
| 5 to 9 Unit Apartments | 0 | 0.0% |
| 10 or more Apartments | 0 | 0.0% |
| Mobile Home / Other | 65 | 7.4% |
| Total | 880 | 100.0% |
Housing Structures by Occupancy in Trinity
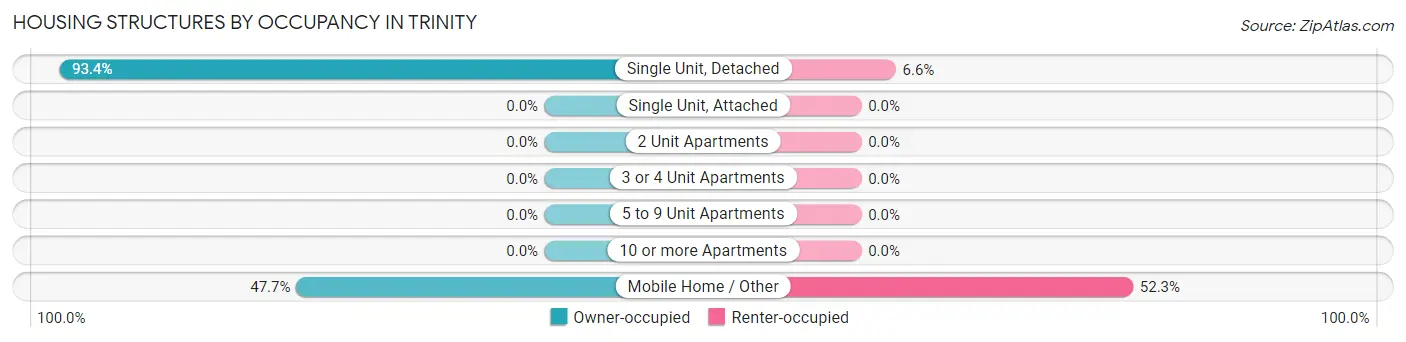
| Structure Type | Owner-occupied | Renter-occupied |
| Single Unit, Detached | 761 (93.4%) | 54 (6.6%) |
| Single Unit, Attached | 0 (0.0%) | 0 (0.0%) |
| 2 Unit Apartments | 0 (0.0%) | 0 (0.0%) |
| 3 or 4 Unit Apartments | 0 (0.0%) | 0 (0.0%) |
| 5 to 9 Unit Apartments | 0 (0.0%) | 0 (0.0%) |
| 10 or more Apartments | 0 (0.0%) | 0 (0.0%) |
| Mobile Home / Other | 31 (47.7%) | 34 (52.3%) |
| Total | 792 (90.0%) | 88 (10.0%) |
Housing Structures by Number of Rooms in Trinity
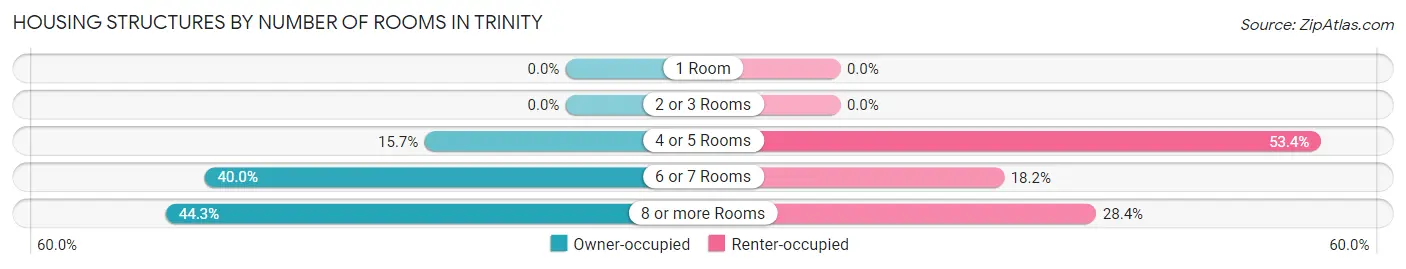
| Number of Rooms | Owner-occupied | Renter-occupied |
| 1 Room | 0 (0.0%) | 0 (0.0%) |
| 2 or 3 Rooms | 0 (0.0%) | 0 (0.0%) |
| 4 or 5 Rooms | 124 (15.7%) | 47 (53.4%) |
| 6 or 7 Rooms | 317 (40.0%) | 16 (18.2%) |
| 8 or more Rooms | 351 (44.3%) | 25 (28.4%) |
| Total | 792 (100.0%) | 88 (100.0%) |
Housing Structure by Heating Type in Trinity
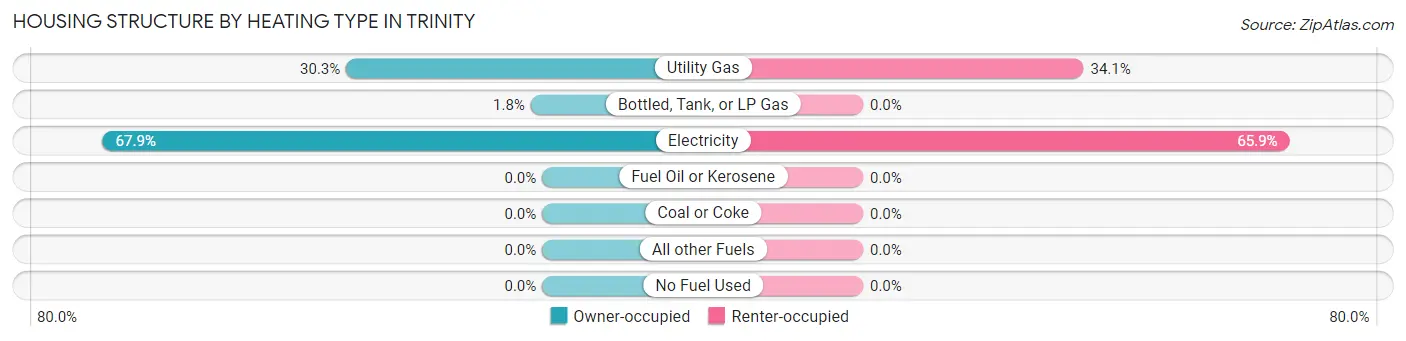
| Heating Type | Owner-occupied | Renter-occupied |
| Utility Gas | 240 (30.3%) | 30 (34.1%) |
| Bottled, Tank, or LP Gas | 14 (1.8%) | 0 (0.0%) |
| Electricity | 538 (67.9%) | 58 (65.9%) |
| Fuel Oil or Kerosene | 0 (0.0%) | 0 (0.0%) |
| Coal or Coke | 0 (0.0%) | 0 (0.0%) |
| All other Fuels | 0 (0.0%) | 0 (0.0%) |
| No Fuel Used | 0 (0.0%) | 0 (0.0%) |
| Total | 792 (100.0%) | 88 (100.0%) |
Household Vehicle Usage in Trinity
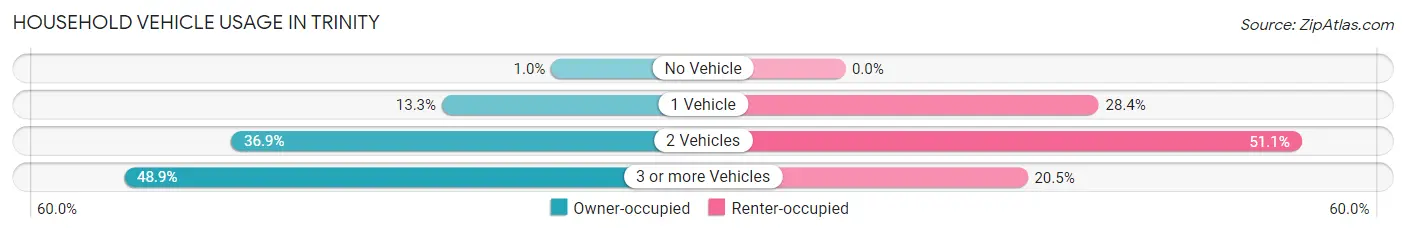
| Vehicles per Household | Owner-occupied | Renter-occupied |
| No Vehicle | 8 (1.0%) | 0 (0.0%) |
| 1 Vehicle | 105 (13.3%) | 25 (28.4%) |
| 2 Vehicles | 292 (36.9%) | 45 (51.1%) |
| 3 or more Vehicles | 387 (48.9%) | 18 (20.4%) |
| Total | 792 (100.0%) | 88 (100.0%) |
Real Estate & Mortgages in Trinity
Real Estate and Mortgage Overview in Trinity
| Characteristic | Without Mortgage | With Mortgage |
| Housing Units | 334 | 458 |
| Median Property Value | $172,200 | $231,500 |
| Median Household Income | $88,214 | $116 |
| Monthly Housing Costs | $423 | $10 |
| Real Estate Taxes | $643 | $35 |
Property Value by Mortgage Status in Trinity
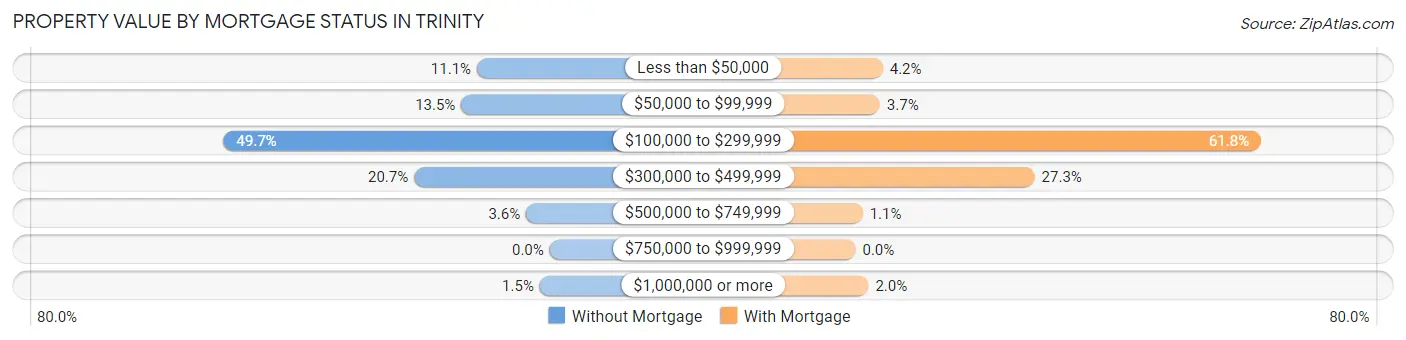
| Property Value | Without Mortgage | With Mortgage |
| Less than $50,000 | 37 (11.1%) | 19 (4.2%) |
| $50,000 to $99,999 | 45 (13.5%) | 17 (3.7%) |
| $100,000 to $299,999 | 166 (49.7%) | 283 (61.8%) |
| $300,000 to $499,999 | 69 (20.7%) | 125 (27.3%) |
| $500,000 to $749,999 | 12 (3.6%) | 5 (1.1%) |
| $750,000 to $999,999 | 0 (0.0%) | 0 (0.0%) |
| $1,000,000 or more | 5 (1.5%) | 9 (2.0%) |
| Total | 334 (100.0%) | 458 (100.0%) |
Household Income by Mortgage Status in Trinity
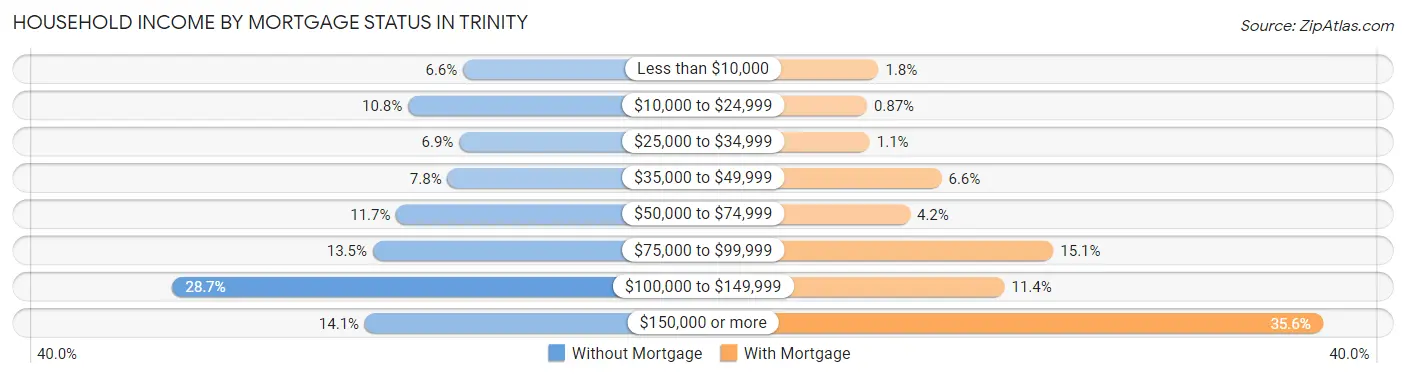
| Household Income | Without Mortgage | With Mortgage |
| Less than $10,000 | 22 (6.6%) | 8 (1.8%) |
| $10,000 to $24,999 | 36 (10.8%) | 4 (0.9%) |
| $25,000 to $34,999 | 23 (6.9%) | 5 (1.1%) |
| $35,000 to $49,999 | 26 (7.8%) | 30 (6.6%) |
| $50,000 to $74,999 | 39 (11.7%) | 19 (4.2%) |
| $75,000 to $99,999 | 45 (13.5%) | 69 (15.1%) |
| $100,000 to $149,999 | 96 (28.7%) | 52 (11.4%) |
| $150,000 or more | 47 (14.1%) | 163 (35.6%) |
| Total | 334 (100.0%) | 458 (100.0%) |
Property Value to Household Income Ratio in Trinity
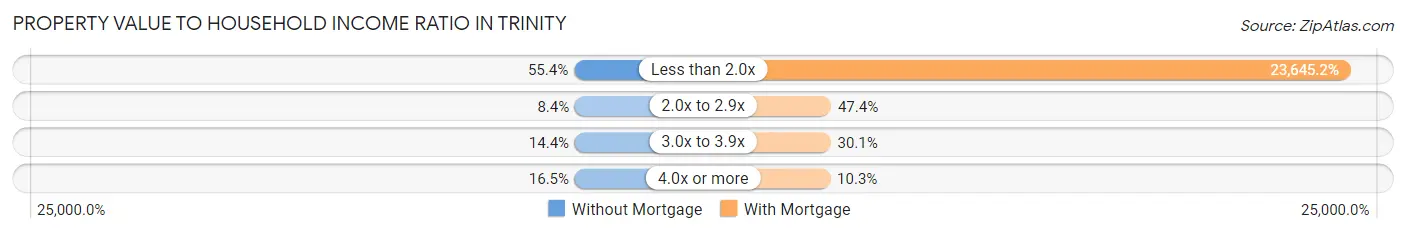
| Value-to-Income Ratio | Without Mortgage | With Mortgage |
| Less than 2.0x | 185 (55.4%) | 108,295 (23,645.2%) |
| 2.0x to 2.9x | 28 (8.4%) | 217 (47.4%) |
| 3.0x to 3.9x | 48 (14.4%) | 138 (30.1%) |
| 4.0x or more | 55 (16.5%) | 47 (10.3%) |
| Total | 334 (100.0%) | 458 (100.0%) |
Real Estate Taxes by Mortgage Status in Trinity
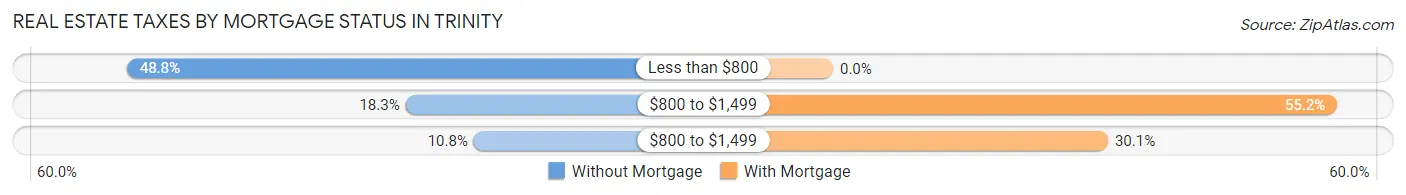
| Property Taxes | Without Mortgage | With Mortgage |
| Less than $800 | 163 (48.8%) | 0 (0.0%) |
| $800 to $1,499 | 61 (18.3%) | 253 (55.2%) |
| $800 to $1,499 | 36 (10.8%) | 138 (30.1%) |
| Total | 334 (100.0%) | 458 (100.0%) |
Health & Disability in Trinity
Health Insurance Coverage by Age in Trinity
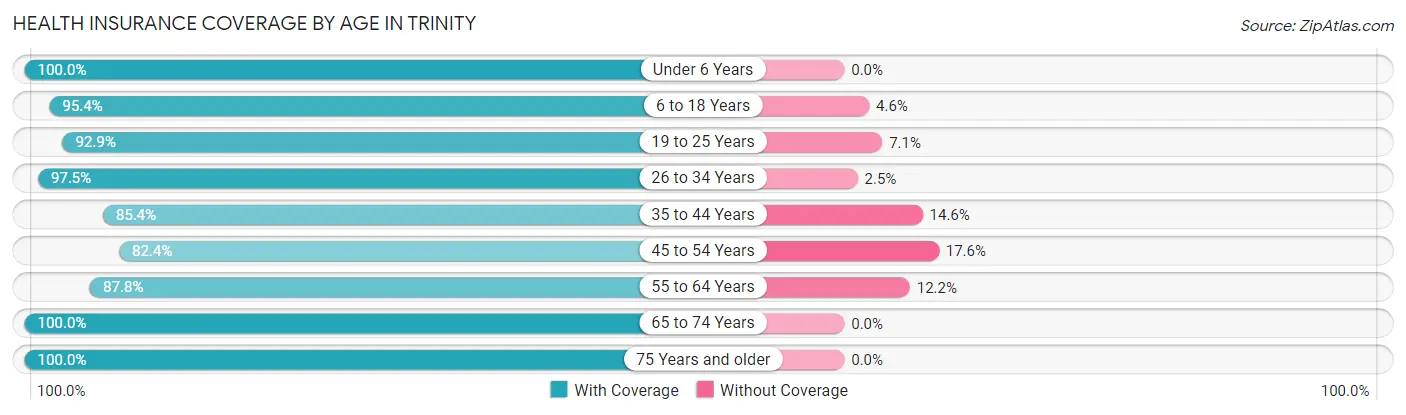
| Age Bracket | With Coverage | Without Coverage |
| Under 6 Years | 155 (100.0%) | 0 (0.0%) |
| 6 to 18 Years | 494 (95.4%) | 24 (4.6%) |
| 19 to 25 Years | 263 (92.9%) | 20 (7.1%) |
| 26 to 34 Years | 197 (97.5%) | 5 (2.5%) |
| 35 to 44 Years | 269 (85.4%) | 46 (14.6%) |
| 45 to 54 Years | 318 (82.4%) | 68 (17.6%) |
| 55 to 64 Years | 316 (87.8%) | 44 (12.2%) |
| 65 to 74 Years | 215 (100.0%) | 0 (0.0%) |
| 75 Years and older | 76 (100.0%) | 0 (0.0%) |
| Total | 2,303 (91.7%) | 207 (8.3%) |
Health Insurance Coverage by Citizenship Status in Trinity
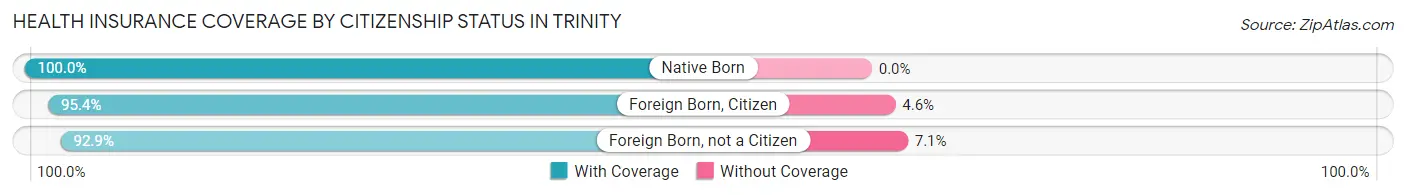
| Citizenship Status | With Coverage | Without Coverage |
| Native Born | 155 (100.0%) | 0 (0.0%) |
| Foreign Born, Citizen | 494 (95.4%) | 24 (4.6%) |
| Foreign Born, not a Citizen | 263 (92.9%) | 20 (7.1%) |
Health Insurance Coverage by Household Income in Trinity
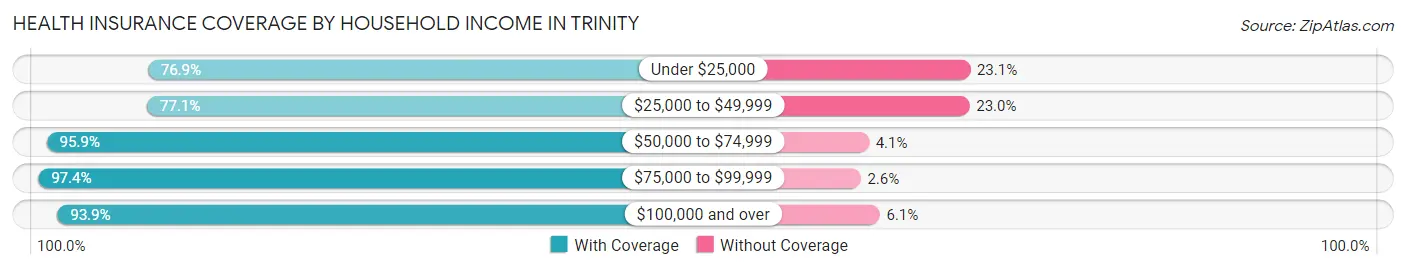
| Household Income | With Coverage | Without Coverage |
| Under $25,000 | 100 (76.9%) | 30 (23.1%) |
| $25,000 to $49,999 | 225 (77.0%) | 67 (23.0%) |
| $50,000 to $74,999 | 397 (95.9%) | 17 (4.1%) |
| $75,000 to $99,999 | 266 (97.4%) | 7 (2.6%) |
| $100,000 and over | 1,315 (93.9%) | 86 (6.1%) |
Public vs Private Health Insurance Coverage by Age in Trinity
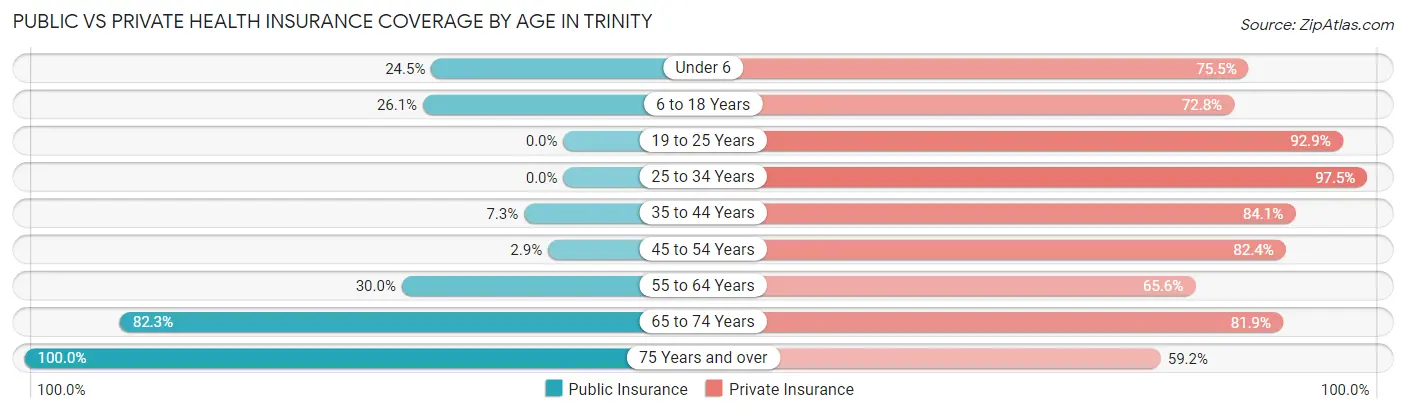
| Age Bracket | Public Insurance | Private Insurance |
| Under 6 | 38 (24.5%) | 117 (75.5%) |
| 6 to 18 Years | 135 (26.1%) | 377 (72.8%) |
| 19 to 25 Years | 0 (0.0%) | 263 (92.9%) |
| 25 to 34 Years | 0 (0.0%) | 197 (97.5%) |
| 35 to 44 Years | 23 (7.3%) | 265 (84.1%) |
| 45 to 54 Years | 11 (2.9%) | 318 (82.4%) |
| 55 to 64 Years | 108 (30.0%) | 236 (65.6%) |
| 65 to 74 Years | 177 (82.3%) | 176 (81.9%) |
| 75 Years and over | 76 (100.0%) | 45 (59.2%) |
| Total | 568 (22.6%) | 1,994 (79.4%) |
Disability Status by Sex by Age in Trinity
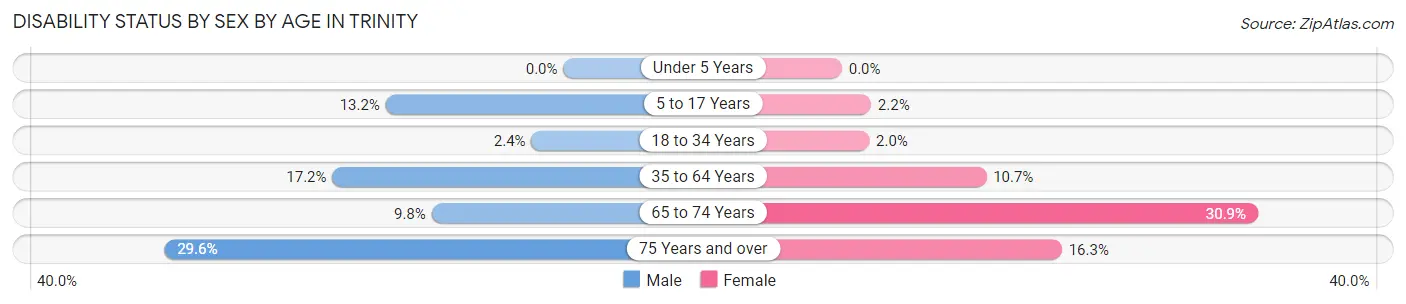
| Age Bracket | Male | Female |
| Under 5 Years | 0 (0.0%) | 0 (0.0%) |
| 5 to 17 Years | 50 (13.2%) | 4 (2.2%) |
| 18 to 34 Years | 6 (2.4%) | 5 (2.0%) |
| 35 to 64 Years | 94 (17.2%) | 55 (10.7%) |
| 65 to 74 Years | 9 (9.8%) | 38 (30.9%) |
| 75 Years and over | 8 (29.6%) | 8 (16.3%) |
Disability Class by Sex by Age in Trinity
Disability Class: Hearing Difficulty
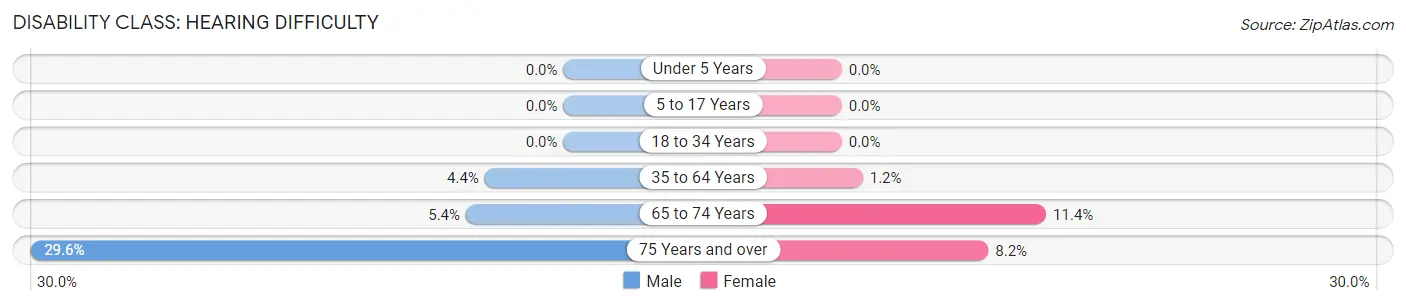
| Age Bracket | Male | Female |
| Under 5 Years | 0 (0.0%) | 0 (0.0%) |
| 5 to 17 Years | 0 (0.0%) | 0 (0.0%) |
| 18 to 34 Years | 0 (0.0%) | 0 (0.0%) |
| 35 to 64 Years | 24 (4.4%) | 6 (1.2%) |
| 65 to 74 Years | 5 (5.4%) | 14 (11.4%) |
| 75 Years and over | 8 (29.6%) | 4 (8.2%) |
Disability Class: Vision Difficulty
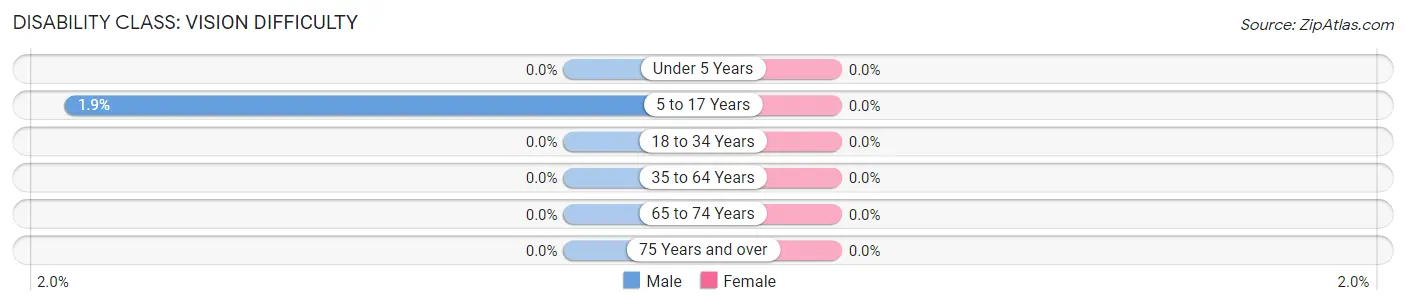
| Age Bracket | Male | Female |
| Under 5 Years | 0 (0.0%) | 0 (0.0%) |
| 5 to 17 Years | 7 (1.8%) | 0 (0.0%) |
| 18 to 34 Years | 0 (0.0%) | 0 (0.0%) |
| 35 to 64 Years | 0 (0.0%) | 0 (0.0%) |
| 65 to 74 Years | 0 (0.0%) | 0 (0.0%) |
| 75 Years and over | 0 (0.0%) | 0 (0.0%) |
Disability Class: Cognitive Difficulty
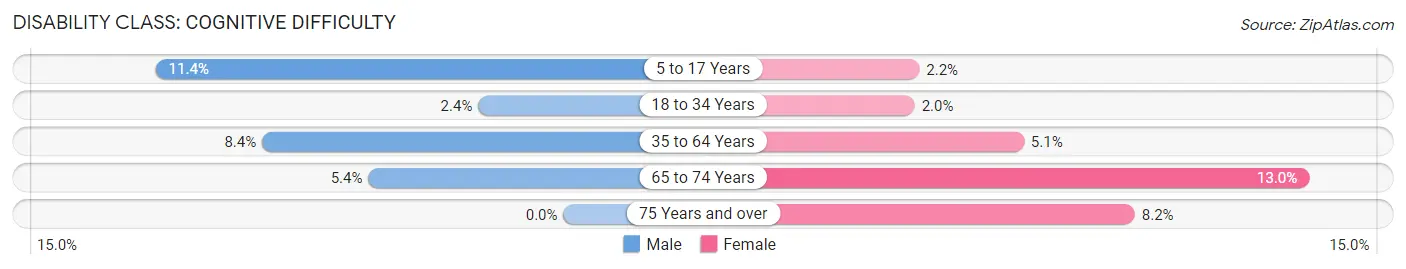
| Age Bracket | Male | Female |
| 5 to 17 Years | 43 (11.4%) | 4 (2.2%) |
| 18 to 34 Years | 6 (2.4%) | 5 (2.0%) |
| 35 to 64 Years | 46 (8.4%) | 26 (5.1%) |
| 65 to 74 Years | 5 (5.4%) | 16 (13.0%) |
| 75 Years and over | 0 (0.0%) | 4 (8.2%) |
Disability Class: Ambulatory Difficulty
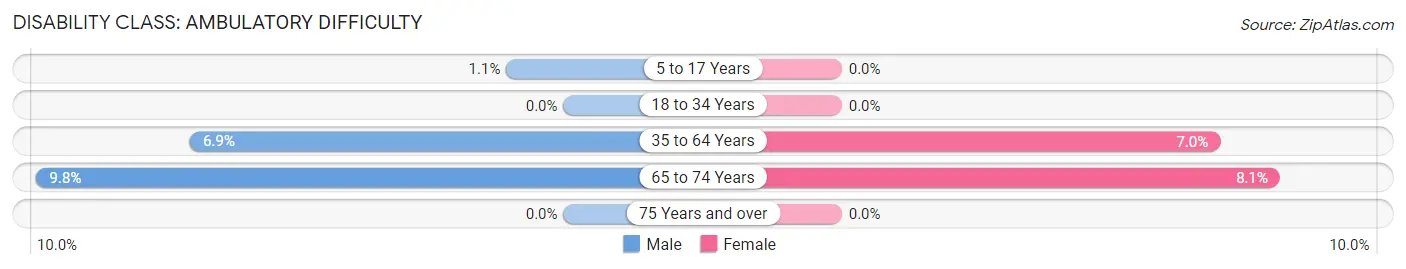
| Age Bracket | Male | Female |
| 5 to 17 Years | 4 (1.1%) | 0 (0.0%) |
| 18 to 34 Years | 0 (0.0%) | 0 (0.0%) |
| 35 to 64 Years | 38 (6.9%) | 36 (7.0%) |
| 65 to 74 Years | 9 (9.8%) | 10 (8.1%) |
| 75 Years and over | 0 (0.0%) | 0 (0.0%) |
Disability Class: Self-Care Difficulty
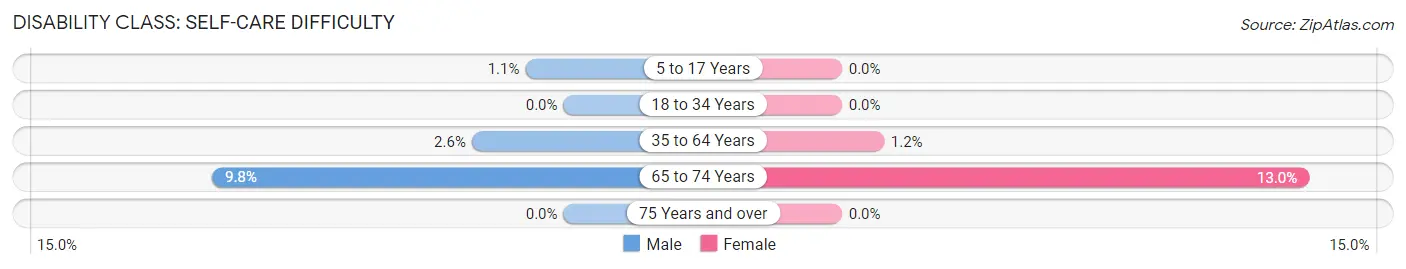
| Age Bracket | Male | Female |
| 5 to 17 Years | 4 (1.1%) | 0 (0.0%) |
| 18 to 34 Years | 0 (0.0%) | 0 (0.0%) |
| 35 to 64 Years | 14 (2.5%) | 6 (1.2%) |
| 65 to 74 Years | 9 (9.8%) | 16 (13.0%) |
| 75 Years and over | 0 (0.0%) | 0 (0.0%) |
Technology Access in Trinity
Computing Device Access in Trinity
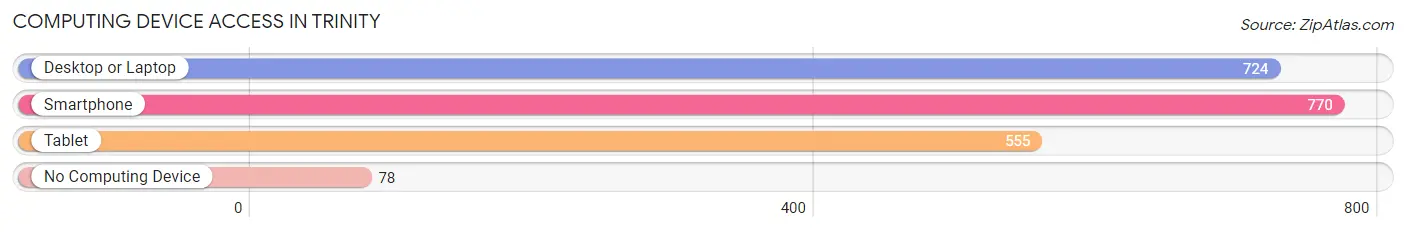
| Device Type | # Households | % Households |
| Desktop or Laptop | 724 | 82.3% |
| Smartphone | 770 | 87.5% |
| Tablet | 555 | 63.1% |
| No Computing Device | 78 | 8.9% |
| Total | 880 | 100.0% |
Internet Access in Trinity
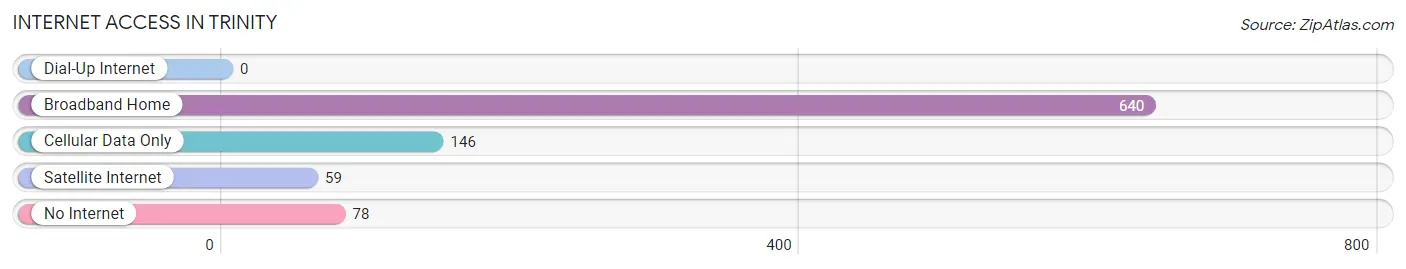
| Internet Type | # Households | % Households |
| Dial-Up Internet | 0 | 0.0% |
| Broadband Home | 640 | 72.7% |
| Cellular Data Only | 146 | 16.6% |
| Satellite Internet | 59 | 6.7% |
| No Internet | 78 | 8.9% |
| Total | 880 | 100.0% |
Trinity Summary
Trinity, Alabama is a small town located in Morgan County, Alabama. It is situated in the foothills of the Appalachian Mountains and is part of the Huntsville-Decatur Combined Statistical Area. The town has a population of approximately 2,000 people and is known for its rural charm and friendly atmosphere.
Geography
Trinity is located in the foothills of the Appalachian Mountains in Morgan County, Alabama. It is situated at the intersection of US Highway 231 and Alabama Highway 24. The town is located approximately 20 miles south of Huntsville and 30 miles north of Decatur. The town is surrounded by rolling hills and lush forests, making it a popular destination for outdoor activities such as hiking, camping, and fishing.
Economy
Trinity’s economy is largely based on agriculture and manufacturing. The town is home to several small businesses, including a feed store, a hardware store, and a grocery store. The town also has a few restaurants and a few small retail stores. The town is also home to a few small manufacturing companies, including a furniture manufacturer and a plastics manufacturer.
Demographics
Trinity is a predominantly white town, with approximately 90% of the population being white. The remaining 10% of the population is made up of African Americans, Hispanics, and other ethnicities. The median household income in Trinity is approximately $35,000, and the median home value is approximately $90,000.
History
Trinity was founded in 1818 by a group of settlers from North Carolina. The town was originally known as “Trinity Crossroads” due to its location at the intersection of two major roads. The town was officially incorporated in 1820 and was named after the Trinity Church, which was built in 1819. The town grew slowly over the years, and by the early 1900s, it had become a thriving agricultural community.
Trinity experienced a period of growth in the 1950s and 1960s, when the town was chosen as the site of a new industrial park. The industrial park brought new jobs and economic growth to the town, and it remains an important part of the local economy today.
Conclusion
Trinity, Alabama is a small town located in Morgan County, Alabama. It is situated in the foothills of the Appalachian Mountains and is part of the Huntsville-Decatur Combined Statistical Area. The town has a population of approximately 2,000 people and is known for its rural charm and friendly atmosphere. The town’s economy is largely based on agriculture and manufacturing, and it is home to several small businesses. The town is predominantly white, with approximately 90% of the population being white. Trinity was founded in 1818 and has experienced periods of growth throughout its history. Today, it remains a popular destination for outdoor activities and is an important part of the local economy.
Common Questions
What is Per Capita Income in Trinity?
Per Capita income in Trinity is $36,623.
What is the Median Family Income in Trinity?
Median Family Income in Trinity is $104,514.
What is the Median Household income in Trinity?
Median Household Income in Trinity is $94,706.
What is Income or Wage Gap in Trinity?
Income or Wage Gap in Trinity is 53.1%.
Women in Trinity earn 46.9 cents for every dollar earned by a man.
What is Inequality or Gini Index in Trinity?
Inequality or Gini Index in Trinity is 0.36.
What is the Total Population of Trinity?
Total Population of Trinity is 2,510.
What is the Total Male Population of Trinity?
Total Male Population of Trinity is 1,346.
What is the Total Female Population of Trinity?
Total Female Population of Trinity is 1,164.
What is the Ratio of Males per 100 Females in Trinity?
There are 115.64 Males per 100 Females in Trinity.
What is the Ratio of Females per 100 Males in Trinity?
There are 86.48 Females per 100 Males in Trinity.
What is the Median Population Age in Trinity?
Median Population Age in Trinity is 38.1 Years.
What is the Average Family Size in Trinity
Average Family Size in Trinity is 3.4 People.
What is the Average Household Size in Trinity
Average Household Size in Trinity is 2.9 People.
How Large is the Labor Force in Trinity?
There are 1,315 People in the Labor Forcein in Trinity.
What is the Percentage of People in the Labor Force in Trinity?
66.3% of People are in the Labor Force in Trinity.
What is the Unemployment Rate in Trinity?
Unemployment Rate in Trinity is 2.4%.