Zip Codes with the Highest Percentage of Households with Income Above $100,000 in Pell City, AL
RELATED REPORTS & OPTIONS
Household Income | $100k+
Pell City
Compare Zip Codes
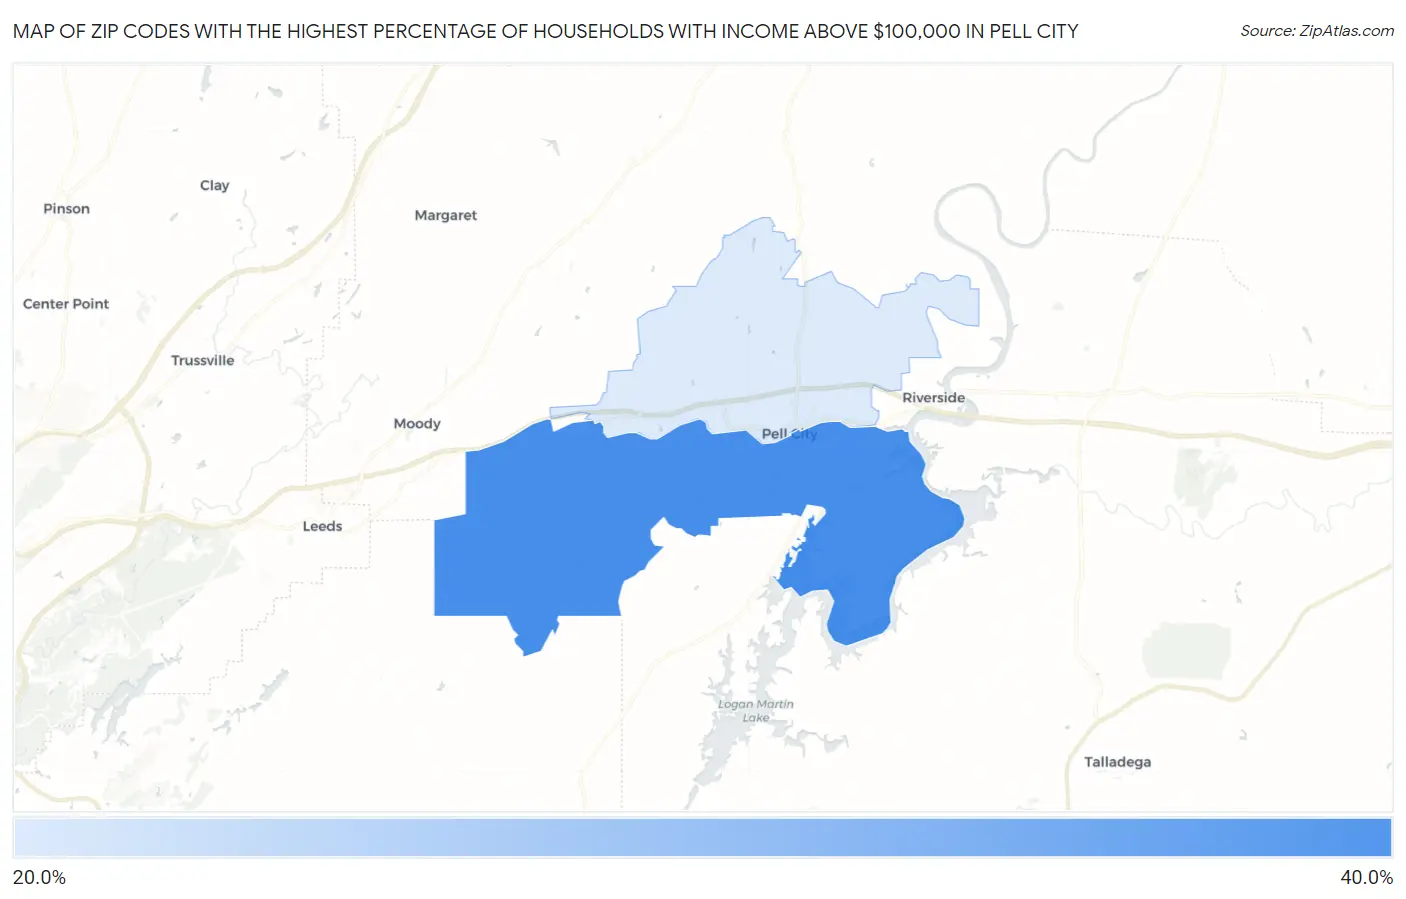
Map of Zip Codes with the Highest Percentage of Households with Income Above $100,000 in Pell City
24.8%
38.5%
Zip Codes with the Highest Percentage of Households with Income Above $100,000 in Pell City, AL
| Zip Code | Households with Income > $100k | vs State | vs National | |
| 1. | 35128 | 38.5% | 27.9%(+10.6)#74 | 37.3%(+1.20)#9,700 |
| 2. | 35125 | 24.8% | 27.9%(-3.10)#233 | 37.3%(-12.5)#19,936 |
1
Common Questions
What are the Top Zip Codes with the Highest Percentage of Households with Income Above $100,000 in Pell City, AL?
Top Zip Codes with the Highest Percentage of Households with Income Above $100,000 in Pell City, AL are:
What zip code has the Highest Percentage of Households with Income Above $100,000 in Pell City, AL?
35128 has the Highest Percentage of Households with Income Above $100,000 in Pell City, AL with 38.5%.
What is the Percentage of Households with Income Above $100,000 in Pell City, AL?
Percentage of Households with Income Above $100,000 in Pell City is 35.9%.
What is the Percentage of Households with Income Above $100,000 in Alabama?
Percentage of Households with Income Above $100,000 in Alabama is 27.9%.
What is the Percentage of Households with Income Above $100,000 in the United States?
Percentage of Households with Income Above $100,000 in the United States is 37.3%.