Zip Codes with the Highest Percentage of Households with Income Above $100,000 in Birmingham, AL
RELATED REPORTS & OPTIONS
Household Income | $100k+
Birmingham
Compare Zip Codes
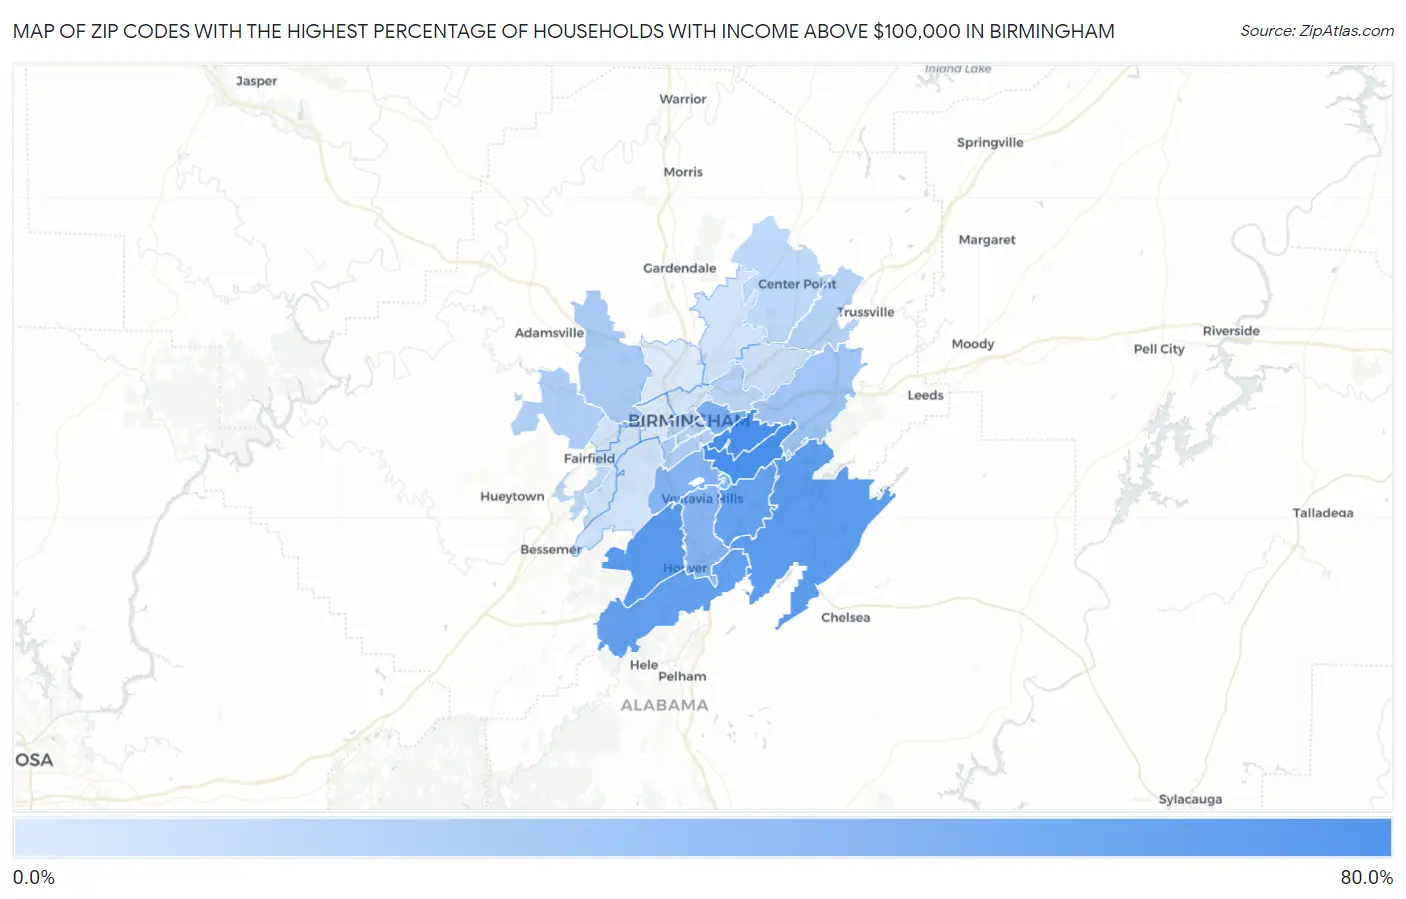
Map of Zip Codes with the Highest Percentage of Households with Income Above $100,000 in Birmingham
6.3%
65.5%
Zip Codes with the Highest Percentage of Households with Income Above $100,000 in Birmingham, AL
| Zip Code | Households with Income > $100k | vs State | vs National | |
| 1. | 35223 | 65.5% | 27.9%(+37.6)#3 | 37.3%(+28.2)#1,465 |
| 2. | 35213 | 64.4% | 27.9%(+36.5)#4 | 37.3%(+27.1)#1,632 |
| 3. | 35226 | 57.7% | 27.9%(+29.8)#16 | 37.3%(+20.4)#2,824 |
| 4. | 35242 | 55.9% | 27.9%(+28.0)#18 | 37.3%(+18.6)#3,201 |
| 5. | 35244 | 52.7% | 27.9%(+24.8)#25 | 37.3%(+15.4)#4,052 |
| 6. | 35243 | 51.2% | 27.9%(+23.3)#30 | 37.3%(+13.9)#4,482 |
| 7. | 35222 | 42.6% | 27.9%(+14.7)#54 | 37.3%(+5.30)#7,628 |
| 8. | 35209 | 39.8% | 27.9%(+11.9)#66 | 37.3%(+2.50)#9,011 |
| 9. | 35216 | 37.5% | 27.9%(+9.60)#88 | 37.3%(+0.200)#10,249 |
| 10. | 35210 | 26.9% | 27.9%(-1.00)#197 | 37.3%(-10.4)#18,069 |
| 11. | 35214 | 24.2% | 27.9%(-3.70)#251 | 37.3%(-13.1)#20,488 |
| 12. | 35205 | 22.0% | 27.9%(-5.90)#304 | 37.3%(-15.3)#22,397 |
| 13. | 35224 | 21.8% | 27.9%(-6.10)#313 | 37.3%(-15.5)#22,593 |
| 14. | 35233 | 19.4% | 27.9%(-8.50)#363 | 37.3%(-17.9)#24,541 |
| 15. | 35235 | 19.3% | 27.9%(-8.60)#365 | 37.3%(-18.0)#24,595 |
| 16. | 35203 | 19.3% | 27.9%(-8.60)#367 | 37.3%(-18.0)#24,614 |
| 17. | 35212 | 16.7% | 27.9%(-11.2)#429 | 37.3%(-20.6)#26,441 |
| 18. | 35215 | 16.4% | 27.9%(-11.5)#439 | 37.3%(-20.9)#26,618 |
| 19. | 35228 | 15.7% | 27.9%(-12.2)#453 | 37.3%(-21.6)#27,118 |
| 20. | 35206 | 11.8% | 27.9%(-16.1)#521 | 37.3%(-25.5)#29,107 |
| 21. | 35221 | 10.7% | 27.9%(-17.2)#531 | 37.3%(-26.6)#29,565 |
| 22. | 35217 | 10.1% | 27.9%(-17.8)#542 | 37.3%(-27.2)#29,795 |
| 23. | 35211 | 10.0% | 27.9%(-17.9)#544 | 37.3%(-27.3)#29,819 |
| 24. | 35208 | 9.8% | 27.9%(-18.1)#546 | 37.3%(-27.5)#29,890 |
| 25. | 35218 | 9.5% | 27.9%(-18.4)#549 | 37.3%(-27.8)#29,985 |
| 26. | 35234 | 8.7% | 27.9%(-19.2)#555 | 37.3%(-28.6)#30,234 |
| 27. | 35204 | 6.6% | 27.9%(-21.3)#572 | 37.3%(-30.7)#30,748 |
| 28. | 35207 | 6.3% | 27.9%(-21.6)#576 | 37.3%(-31.0)#30,802 |
1
Common Questions
What are the Top 10 Zip Codes with the Highest Percentage of Households with Income Above $100,000 in Birmingham, AL?
Top 10 Zip Codes with the Highest Percentage of Households with Income Above $100,000 in Birmingham, AL are:
What zip code has the Highest Percentage of Households with Income Above $100,000 in Birmingham, AL?
35223 has the Highest Percentage of Households with Income Above $100,000 in Birmingham, AL with 65.5%.
What is the Percentage of Households with Income Above $100,000 in Birmingham, AL?
Percentage of Households with Income Above $100,000 in Birmingham is 17.5%.
What is the Percentage of Households with Income Above $100,000 in Alabama?
Percentage of Households with Income Above $100,000 in Alabama is 27.9%.
What is the Percentage of Households with Income Above $100,000 in the United States?
Percentage of Households with Income Above $100,000 in the United States is 37.3%.