Satsuma, AL Map & Demographics
Satsuma Map
Satsuma Overview
$38,181
PER CAPITA INCOME
$100,132
AVG FAMILY INCOME
$87,974
AVG HOUSEHOLD INCOME
49.2%
WAGE / INCOME GAP [ % ]
50.8¢/ $1
WAGE / INCOME GAP [ $ ]
0.38
INEQUALITY / GINI INDEX
6,740
TOTAL POPULATION
3,787
MALE POPULATION
2,953
FEMALE POPULATION
128.24
MALES / 100 FEMALES
77.98
FEMALES / 100 MALES
40.0
MEDIAN AGE
3.1
AVG FAMILY SIZE
2.8
AVG HOUSEHOLD SIZE
3,327
LABOR FORCE [ PEOPLE ]
62.3%
PERCENT IN LABOR FORCE
5.9%
UNEMPLOYMENT RATE
Satsuma Zip Codes
Satsuma Area Codes
Income in Satsuma
Income Overview in Satsuma
Per Capita Income in Satsuma is $38,181, while median incomes of families and households are $100,132 and $87,974 respectively.
| Characteristic | Number | Measure |
| Per Capita Income | 6,740 | $38,181 |
| Median Family Income | 1,912 | $100,132 |
| Mean Family Income | 1,912 | $116,407 |
| Median Household Income | 2,395 | $87,974 |
| Mean Household Income | 2,395 | $103,427 |
| Income Deficit | 1,912 | $0 |
| Wage / Income Gap (%) | 6,740 | 49.17% |
| Wage / Income Gap ($) | 6,740 | 50.83¢ per $1 |
| Gini / Inequality Index | 6,740 | 0.38 |
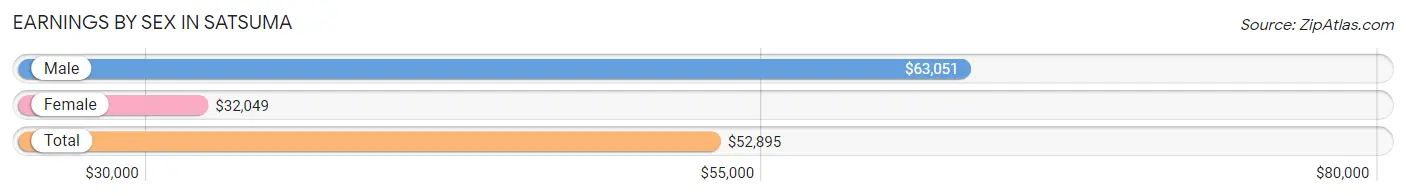
Earnings by Sex in Satsuma
Average Earnings in Satsuma are $52,895, $63,051 for men and $32,049 for women, a difference of 49.2%.
| Sex | Number | Average Earnings |
| Male | 1,922 (55.5%) | $63,051 |
| Female | 1,540 (44.5%) | $32,049 |
| Total | 3,462 (100.0%) | $52,895 |
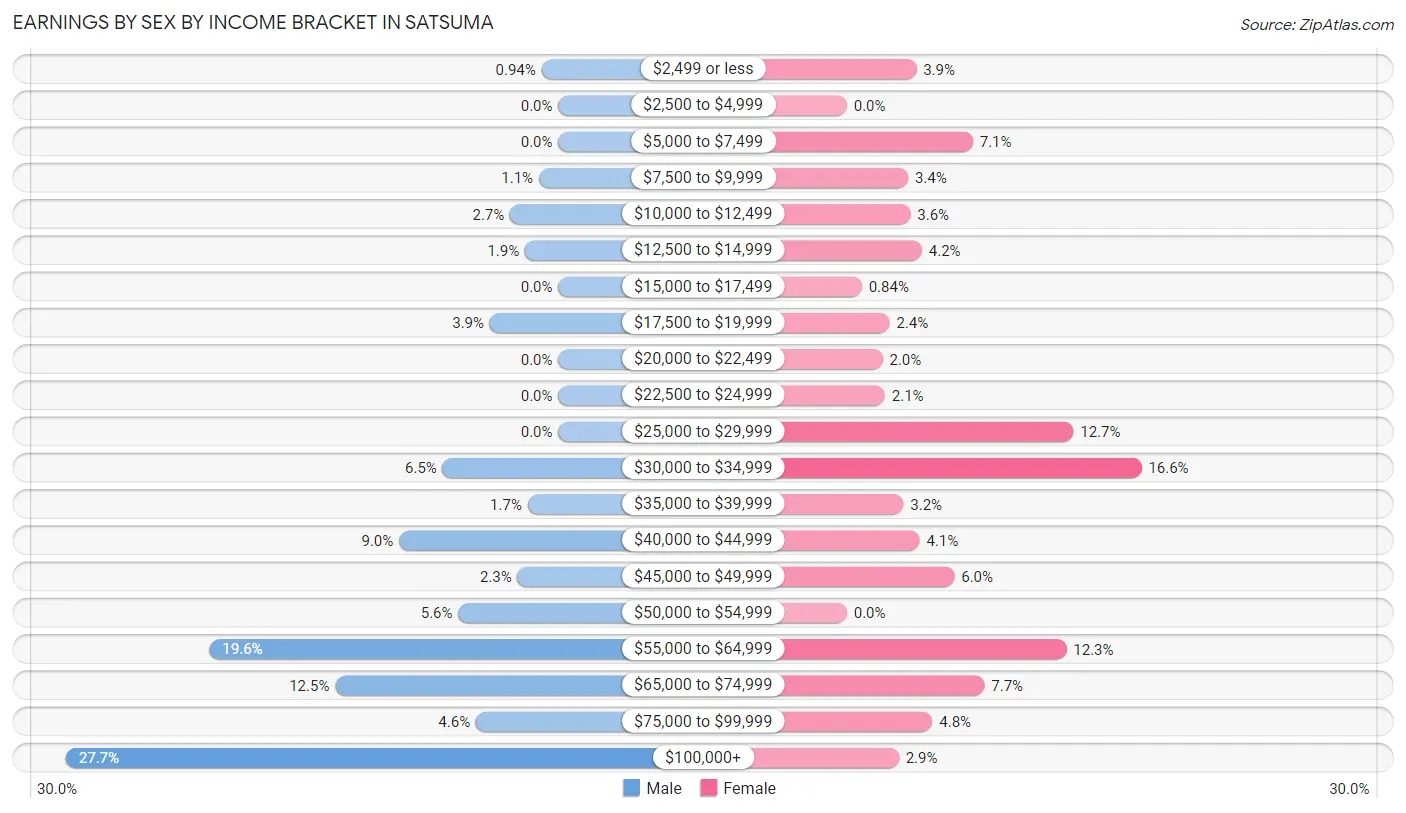
Earnings by Sex by Income Bracket in Satsuma
The most common earnings brackets in Satsuma are $100,000+ for men (532 | 27.7%) and $30,000 to $34,999 for women (255 | 16.6%).
| Income | Male | Female |
| $2,499 or less | 18 (0.9%) | 60 (3.9%) |
| $2,500 to $4,999 | 0 (0.0%) | 0 (0.0%) |
| $5,000 to $7,499 | 0 (0.0%) | 109 (7.1%) |
| $7,500 to $9,999 | 21 (1.1%) | 53 (3.4%) |
| $10,000 to $12,499 | 52 (2.7%) | 55 (3.6%) |
| $12,500 to $14,999 | 36 (1.9%) | 65 (4.2%) |
| $15,000 to $17,499 | 0 (0.0%) | 13 (0.8%) |
| $17,500 to $19,999 | 74 (3.8%) | 37 (2.4%) |
| $20,000 to $22,499 | 0 (0.0%) | 31 (2.0%) |
| $22,500 to $24,999 | 0 (0.0%) | 33 (2.1%) |
| $25,000 to $29,999 | 0 (0.0%) | 196 (12.7%) |
| $30,000 to $34,999 | 125 (6.5%) | 255 (16.6%) |
| $35,000 to $39,999 | 33 (1.7%) | 49 (3.2%) |
| $40,000 to $44,999 | 172 (8.9%) | 63 (4.1%) |
| $45,000 to $49,999 | 44 (2.3%) | 93 (6.0%) |
| $50,000 to $54,999 | 108 (5.6%) | 0 (0.0%) |
| $55,000 to $64,999 | 377 (19.6%) | 190 (12.3%) |
| $65,000 to $74,999 | 241 (12.5%) | 119 (7.7%) |
| $75,000 to $99,999 | 89 (4.6%) | 74 (4.8%) |
| $100,000+ | 532 (27.7%) | 45 (2.9%) |
| Total | 1,922 (100.0%) | 1,540 (100.0%) |
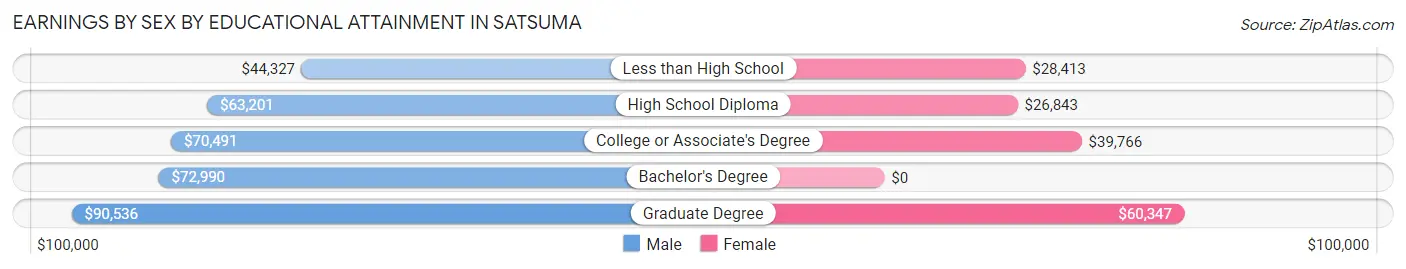
Earnings by Sex by Educational Attainment in Satsuma
Average earnings in Satsuma are $64,242 for men and $34,077 for women, a difference of 47.0%. Men with an educational attainment of graduate degree enjoy the highest average annual earnings of $90,536, while those with less than high school education earn the least with $44,327. Women with an educational attainment of graduate degree earn the most with the average annual earnings of $60,347, while those with high school diploma education have the smallest earnings of $26,843.
| Educational Attainment | Male Income | Female Income |
| Less than High School | $44,327 | $28,413 |
| High School Diploma | $63,201 | $26,843 |
| College or Associate's Degree | $70,491 | $39,766 |
| Bachelor's Degree | $72,990 | $0 |
| Graduate Degree | $90,536 | $60,347 |
| Total | $64,242 | $34,077 |
Family Income in Satsuma
Family Income Brackets in Satsuma
According to the Satsuma family income data, there are 577 families falling into the $100,000 to $149,999 income range, which is the most common income bracket and makes up 30.2% of all families. Conversely, the less than $10,000 income bracket is the least frequent group with only 10 families (0.5%) belonging to this category.
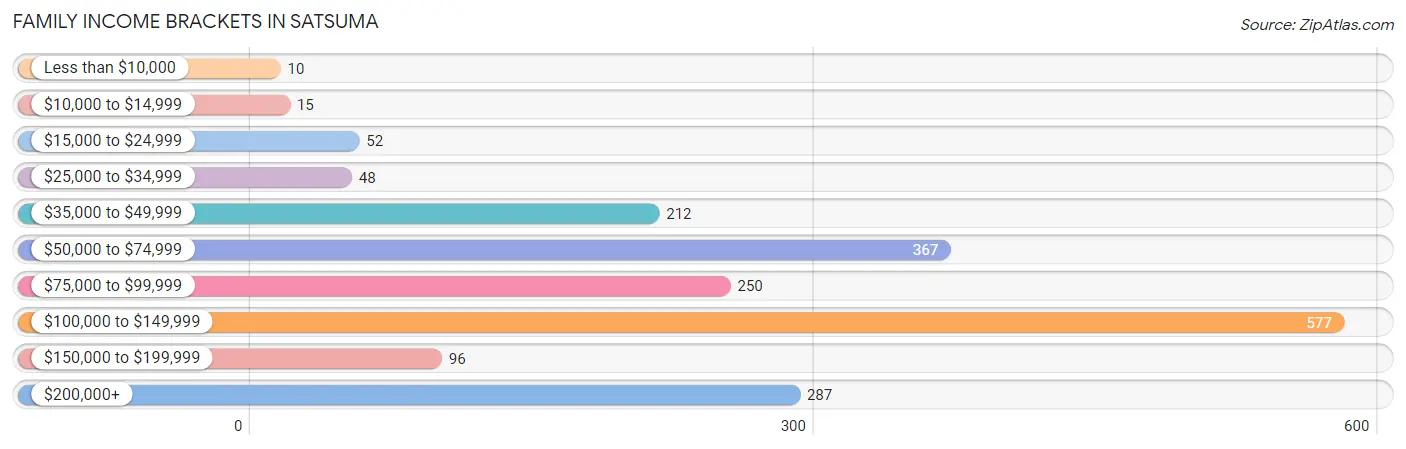
| Income Bracket | # Families | % Families |
| Less than $10,000 | 10 | 0.5% |
| $10,000 to $14,999 | 15 | 0.8% |
| $15,000 to $24,999 | 52 | 2.7% |
| $25,000 to $34,999 | 48 | 2.5% |
| $35,000 to $49,999 | 212 | 11.1% |
| $50,000 to $74,999 | 367 | 19.2% |
| $75,000 to $99,999 | 250 | 13.1% |
| $100,000 to $149,999 | 577 | 30.2% |
| $150,000 to $199,999 | 96 | 5.0% |
| $200,000+ | 287 | 15.0% |
Family Income by Famaliy Size in Satsuma
4-person families (306 | 16.0%) account for the highest median family income in Satsuma with $128,194 per family, while 2-person families (839 | 43.9%) have the highest median income of $47,940 per family member.
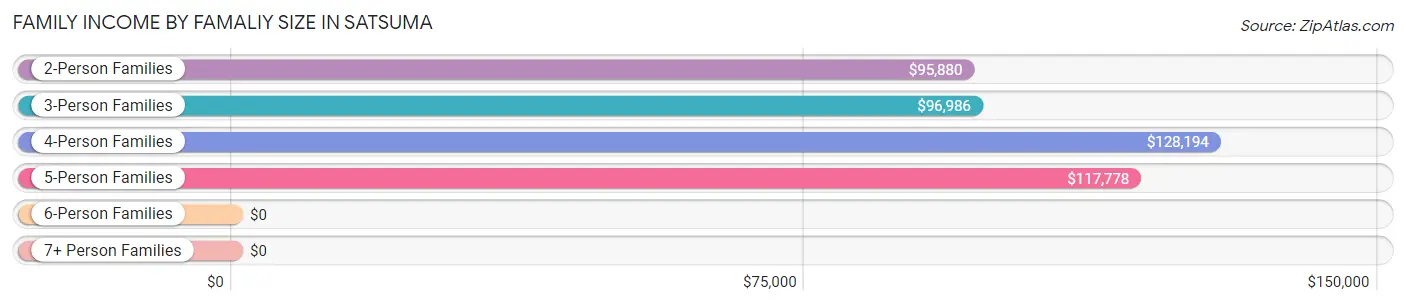
| Income Bracket | # Families | Median Income |
| 2-Person Families | 839 (43.9%) | $95,880 |
| 3-Person Families | 562 (29.4%) | $96,986 |
| 4-Person Families | 306 (16.0%) | $128,194 |
| 5-Person Families | 174 (9.1%) | $117,778 |
| 6-Person Families | 31 (1.6%) | $0 |
| 7+ Person Families | 0 (0.0%) | $0 |
| Total | 1,912 (100.0%) | $100,132 |
Family Income by Number of Earners in Satsuma
The median family income in Satsuma is $100,132, with families comprising 3+ earners (134) having the highest median family income of $225,167, while families with no earners (239) have the lowest median family income of $48,229, accounting for 7.0% and 12.5% of families, respectively.
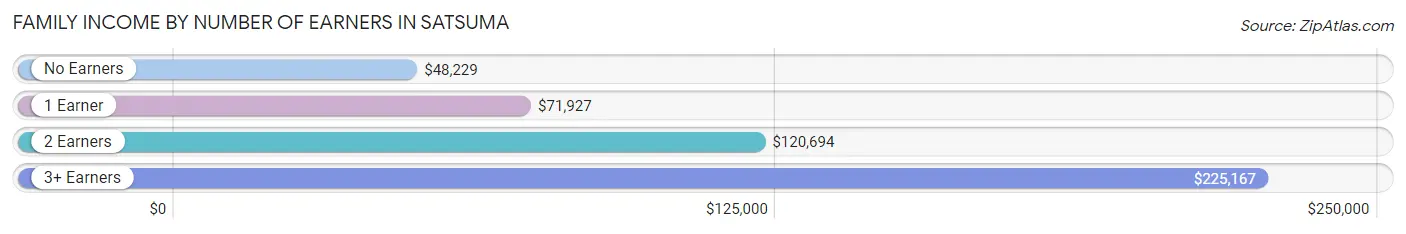
| Number of Earners | # Families | Median Income |
| No Earners | 239 (12.5%) | $48,229 |
| 1 Earner | 564 (29.5%) | $71,927 |
| 2 Earners | 975 (51.0%) | $120,694 |
| 3+ Earners | 134 (7.0%) | $225,167 |
| Total | 1,912 (100.0%) | $100,132 |
Household Income in Satsuma
Household Income Brackets in Satsuma
With 601 households falling in the category, the $100,000 to $149,999 income range is the most frequent in Satsuma, accounting for 25.1% of all households. In contrast, only 41 households (1.7%) fall into the $10,000 to $14,999 income bracket, making it the least populous group.
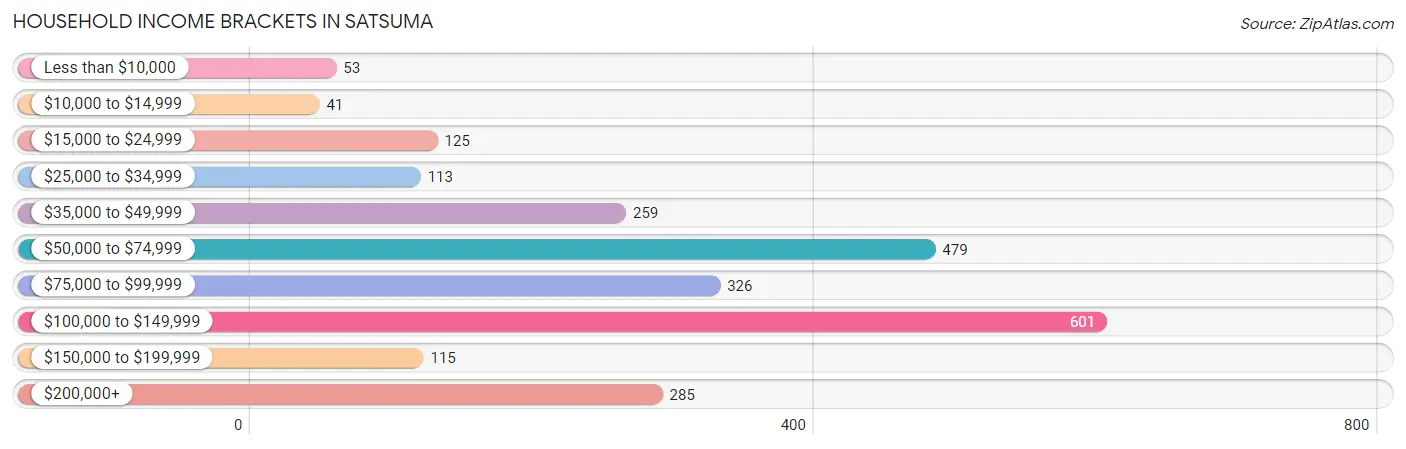
| Income Bracket | # Households | % Households |
| Less than $10,000 | 53 | 2.2% |
| $10,000 to $14,999 | 41 | 1.7% |
| $15,000 to $24,999 | 125 | 5.2% |
| $25,000 to $34,999 | 113 | 4.7% |
| $35,000 to $49,999 | 259 | 10.8% |
| $50,000 to $74,999 | 479 | 20.0% |
| $75,000 to $99,999 | 326 | 13.6% |
| $100,000 to $149,999 | 601 | 25.1% |
| $150,000 to $199,999 | 115 | 4.8% |
| $200,000+ | 285 | 11.9% |
Household Income by Householder Age in Satsuma
The median household income in Satsuma is $87,974, with the highest median household income of $109,653 found in the 45 to 64 years age bracket for the primary householder. A total of 948 households (39.6%) fall into this category. Meanwhile, the 15 to 24 years age bracket for the primary householder has the lowest median household income of $0, with 68 households (2.8%) in this group.
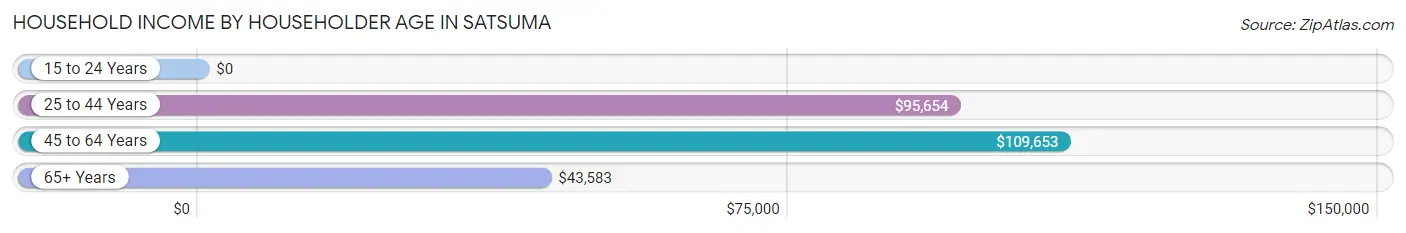
| Income Bracket | # Households | Median Income |
| 15 to 24 Years | 68 (2.8%) | $0 |
| 25 to 44 Years | 784 (32.7%) | $95,654 |
| 45 to 64 Years | 948 (39.6%) | $109,653 |
| 65+ Years | 595 (24.8%) | $43,583 |
| Total | 2,395 (100.0%) | $87,974 |
Poverty in Satsuma
Income Below Poverty by Sex and Age in Satsuma
With 5.0% poverty level for males and 4.2% for females among the residents of Satsuma, 15 year old males and 75 year old and over females are the most vulnerable to poverty, with 95 males (43.4%) and 36 females (16.4%) in their respective age groups living below the poverty level.
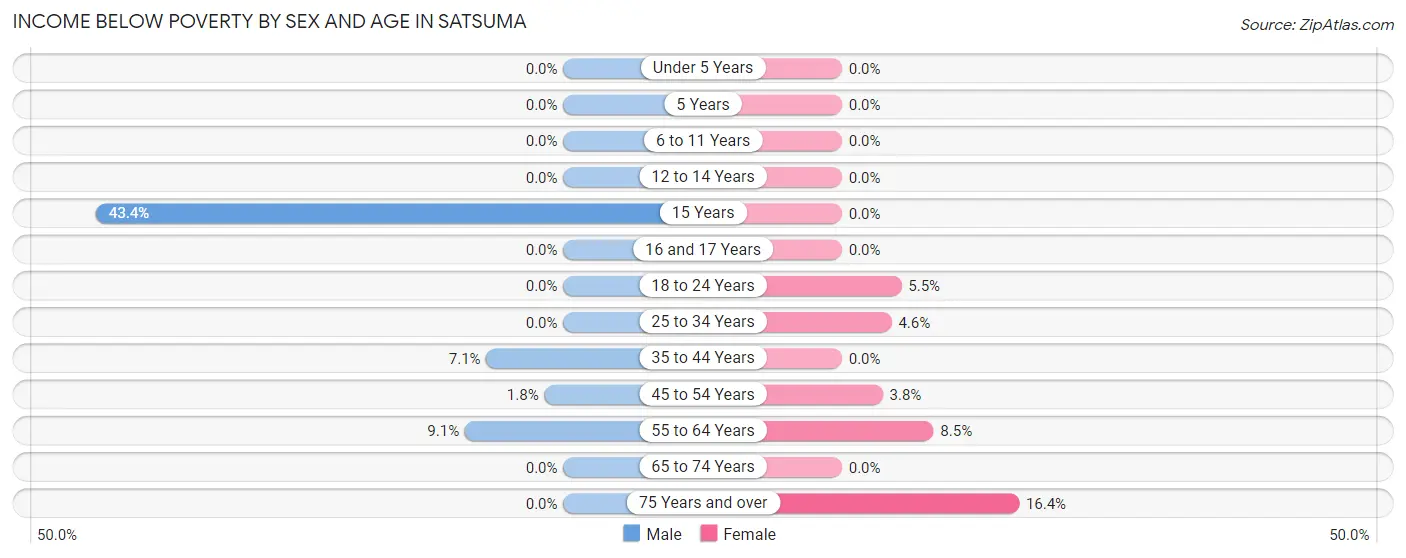
| Age Bracket | Male | Female |
| Under 5 Years | 0 (0.0%) | 0 (0.0%) |
| 5 Years | 0 (0.0%) | 0 (0.0%) |
| 6 to 11 Years | 0 (0.0%) | 0 (0.0%) |
| 12 to 14 Years | 0 (0.0%) | 0 (0.0%) |
| 15 Years | 95 (43.4%) | 0 (0.0%) |
| 16 and 17 Years | 0 (0.0%) | 0 (0.0%) |
| 18 to 24 Years | 0 (0.0%) | 13 (5.5%) |
| 25 to 34 Years | 0 (0.0%) | 23 (4.6%) |
| 35 to 44 Years | 36 (7.1%) | 0 (0.0%) |
| 45 to 54 Years | 10 (1.8%) | 16 (3.8%) |
| 55 to 64 Years | 47 (9.1%) | 34 (8.5%) |
| 65 to 74 Years | 0 (0.0%) | 0 (0.0%) |
| 75 Years and over | 0 (0.0%) | 36 (16.4%) |
| Total | 188 (5.0%) | 122 (4.2%) |
Income Above Poverty by Sex and Age in Satsuma
According to the poverty statistics in Satsuma, males aged under 5 years and females aged under 5 years are the age groups that are most secure financially, with 100.0% of males and 100.0% of females in these age groups living above the poverty line.
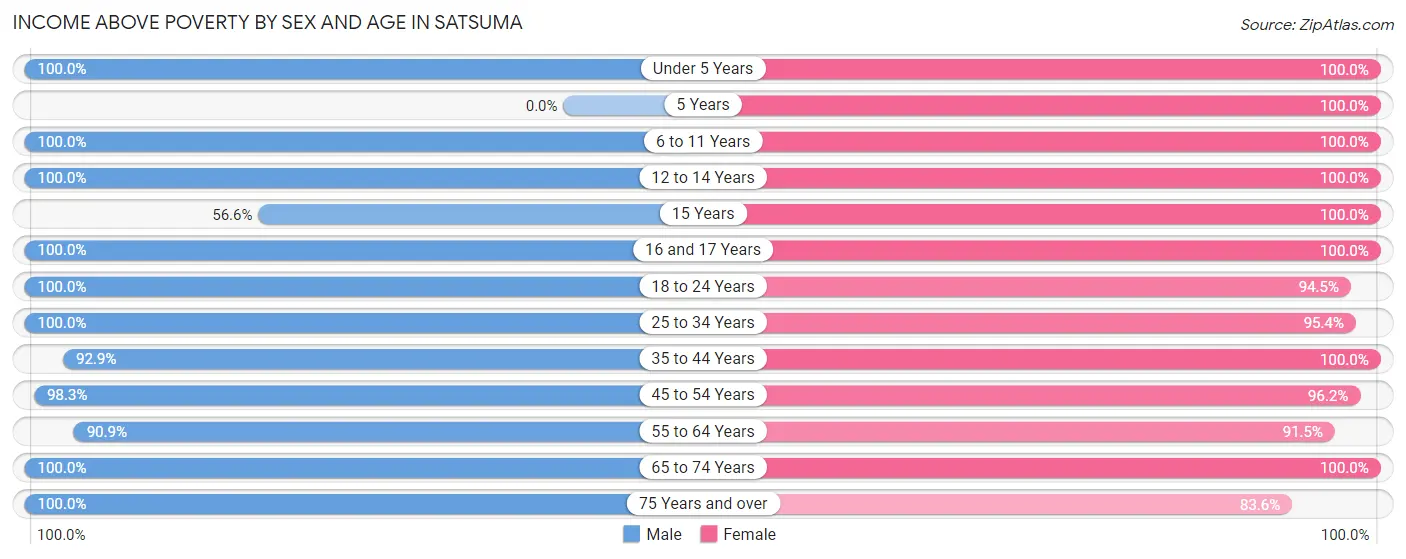
| Age Bracket | Male | Female |
| Under 5 Years | 99 (100.0%) | 177 (100.0%) |
| 5 Years | 0 (0.0%) | 100 (100.0%) |
| 6 to 11 Years | 287 (100.0%) | 68 (100.0%) |
| 12 to 14 Years | 286 (100.0%) | 141 (100.0%) |
| 15 Years | 124 (56.6%) | 22 (100.0%) |
| 16 and 17 Years | 37 (100.0%) | 16 (100.0%) |
| 18 to 24 Years | 162 (100.0%) | 222 (94.5%) |
| 25 to 34 Years | 464 (100.0%) | 476 (95.4%) |
| 35 to 44 Years | 468 (92.9%) | 325 (100.0%) |
| 45 to 54 Years | 562 (98.3%) | 406 (96.2%) |
| 55 to 64 Years | 468 (90.9%) | 366 (91.5%) |
| 65 to 74 Years | 361 (100.0%) | 314 (100.0%) |
| 75 Years and over | 239 (100.0%) | 183 (83.6%) |
| Total | 3,557 (95.0%) | 2,816 (95.9%) |
Income Below Poverty Among Married-Couple Families in Satsuma
The poverty statistics for married-couple families in Satsuma show that 0.6% or 10 of the total 1,658 families live below the poverty line. Families with no children have the highest poverty rate of 1.1%, comprising of 10 families. On the other hand, families with 1 or 2 children have the lowest poverty rate of 0.0%, which includes 0 families.
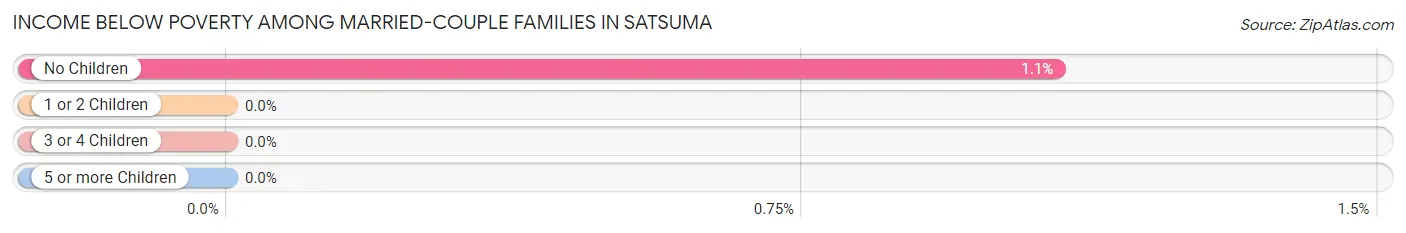
| Children | Above Poverty | Below Poverty |
| No Children | 914 (98.9%) | 10 (1.1%) |
| 1 or 2 Children | 584 (100.0%) | 0 (0.0%) |
| 3 or 4 Children | 150 (100.0%) | 0 (0.0%) |
| 5 or more Children | 0 (0.0%) | 0 (0.0%) |
| Total | 1,648 (99.4%) | 10 (0.6%) |
Income Below Poverty Among Single-Parent Households in Satsuma
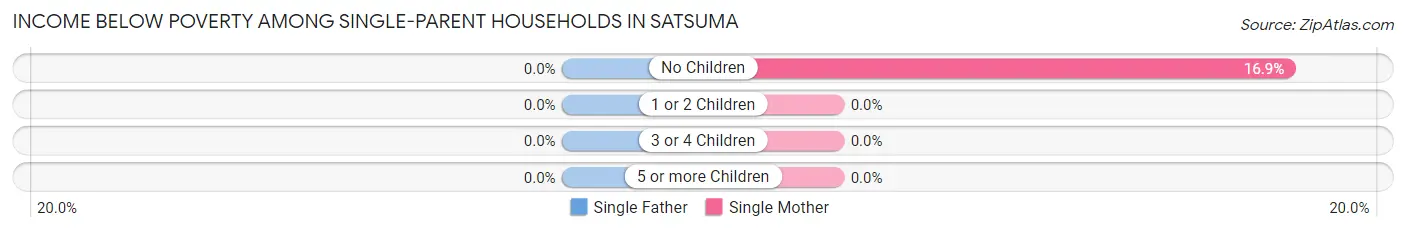
| Children | Single Father | Single Mother |
| No Children | 0 (0.0%) | 15 (16.9%) |
| 1 or 2 Children | 0 (0.0%) | 0 (0.0%) |
| 3 or 4 Children | 0 (0.0%) | 0 (0.0%) |
| 5 or more Children | 0 (0.0%) | 0 (0.0%) |
| Total | 0 (0.0%) | 15 (13.4%) |
Income Below Poverty Among Married-Couple vs Single-Parent Households in Satsuma
The poverty data for Satsuma shows that 10 of the married-couple family households (0.6%) and 15 of the single-parent households (5.9%) are living below the poverty level. Within the married-couple family households, those with no children have the highest poverty rate, with 10 households (1.1%) falling below the poverty line. Among the single-parent households, those with no children have the highest poverty rate, with 15 household (7.1%) living below poverty.
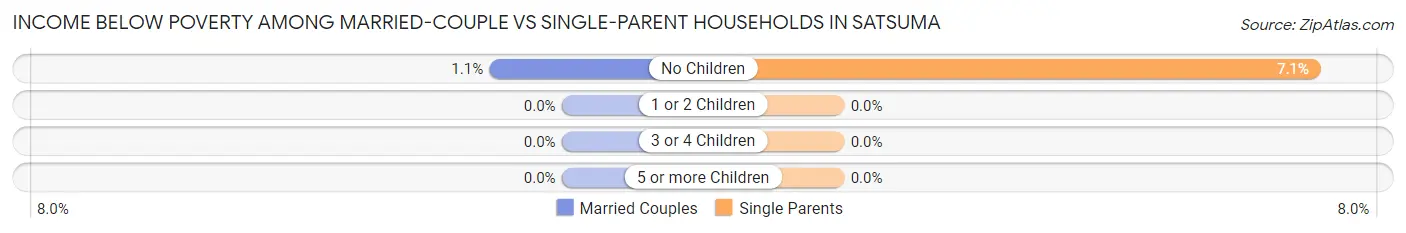
| Children | Married-Couple Families | Single-Parent Households |
| No Children | 10 (1.1%) | 15 (7.1%) |
| 1 or 2 Children | 0 (0.0%) | 0 (0.0%) |
| 3 or 4 Children | 0 (0.0%) | 0 (0.0%) |
| 5 or more Children | 0 (0.0%) | 0 (0.0%) |
| Total | 10 (0.6%) | 15 (5.9%) |
Race in Satsuma
The most populous races in Satsuma are White / Caucasian (5,552 | 82.4%), Black / African American (638 | 9.5%), and Two or more Races (279 | 4.1%).
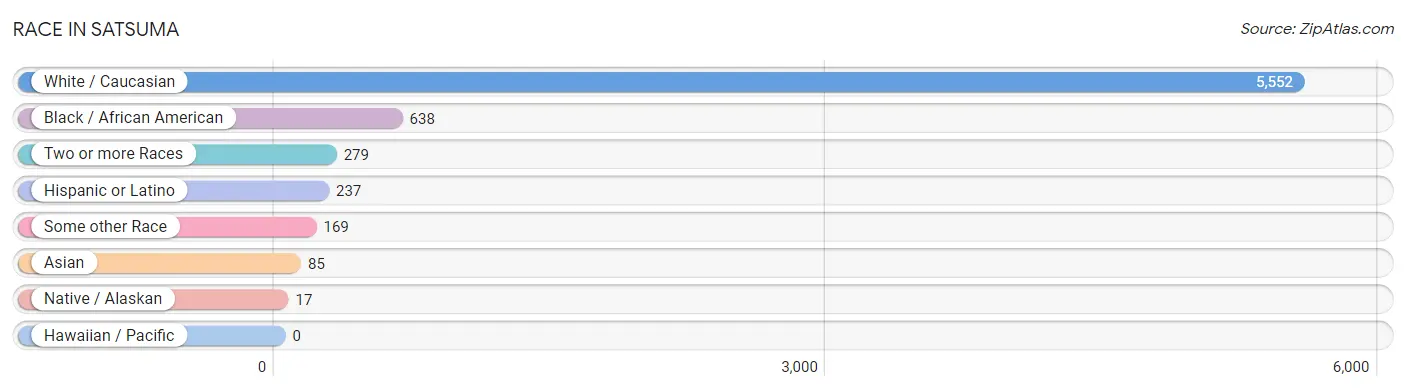
| Race | # Population | % Population |
| Asian | 85 | 1.3% |
| Black / African American | 638 | 9.5% |
| Hawaiian / Pacific | 0 | 0.0% |
| Hispanic or Latino | 237 | 3.5% |
| Native / Alaskan | 17 | 0.3% |
| White / Caucasian | 5,552 | 82.4% |
| Two or more Races | 279 | 4.1% |
| Some other Race | 169 | 2.5% |
| Total | 6,740 | 100.0% |
Ancestry in Satsuma
The most populous ancestries reported in Satsuma are American (930 | 13.8%), English (878 | 13.0%), Irish (708 | 10.5%), German (566 | 8.4%), and Central American (225 | 3.3%), together accounting for 49.1% of all Satsuma residents.
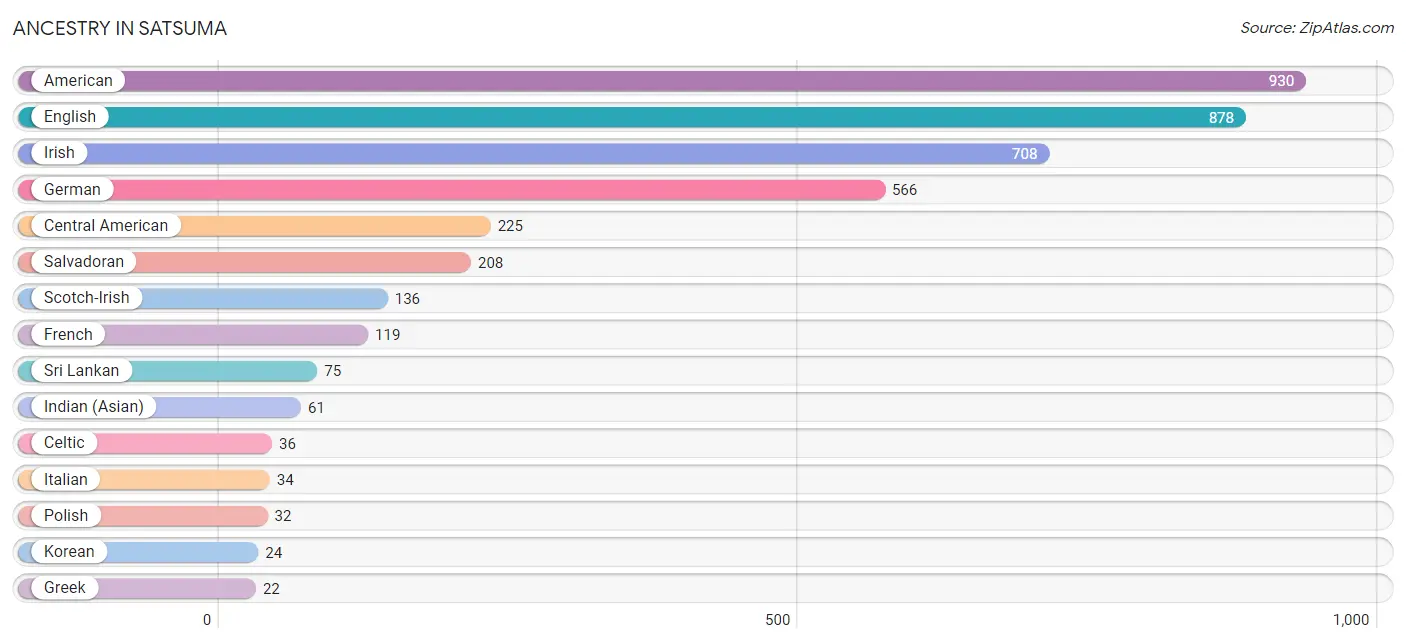
| Ancestry | # Population | % Population |
| American | 930 | 13.8% |
| Arab | 17 | 0.3% |
| Blackfeet | 13 | 0.2% |
| Celtic | 36 | 0.5% |
| Central American | 225 | 3.3% |
| Cherokee | 5 | 0.1% |
| Choctaw | 12 | 0.2% |
| English | 878 | 13.0% |
| French | 119 | 1.8% |
| French Canadian | 9 | 0.1% |
| German | 566 | 8.4% |
| Greek | 22 | 0.3% |
| Indian (Asian) | 61 | 0.9% |
| Irish | 708 | 10.5% |
| Italian | 34 | 0.5% |
| Korean | 24 | 0.4% |
| Nicaraguan | 17 | 0.3% |
| Polish | 32 | 0.5% |
| Salvadoran | 208 | 3.1% |
| Scotch-Irish | 136 | 2.0% |
| Scottish | 11 | 0.2% |
| South American | 12 | 0.2% |
| Sri Lankan | 75 | 1.1% |
| Swedish | 14 | 0.2% |
| Venezuelan | 12 | 0.2% |
| Welsh | 22 | 0.3% | View All 26 Rows |
Immigrants in Satsuma
The most numerous immigrant groups reported in Satsuma came from Latin America (225 | 3.3%), Central America (186 | 2.8%), El Salvador (169 | 2.5%), Asia (64 | 0.9%), and China (40 | 0.6%), together accounting for 10.1% of all Satsuma residents.
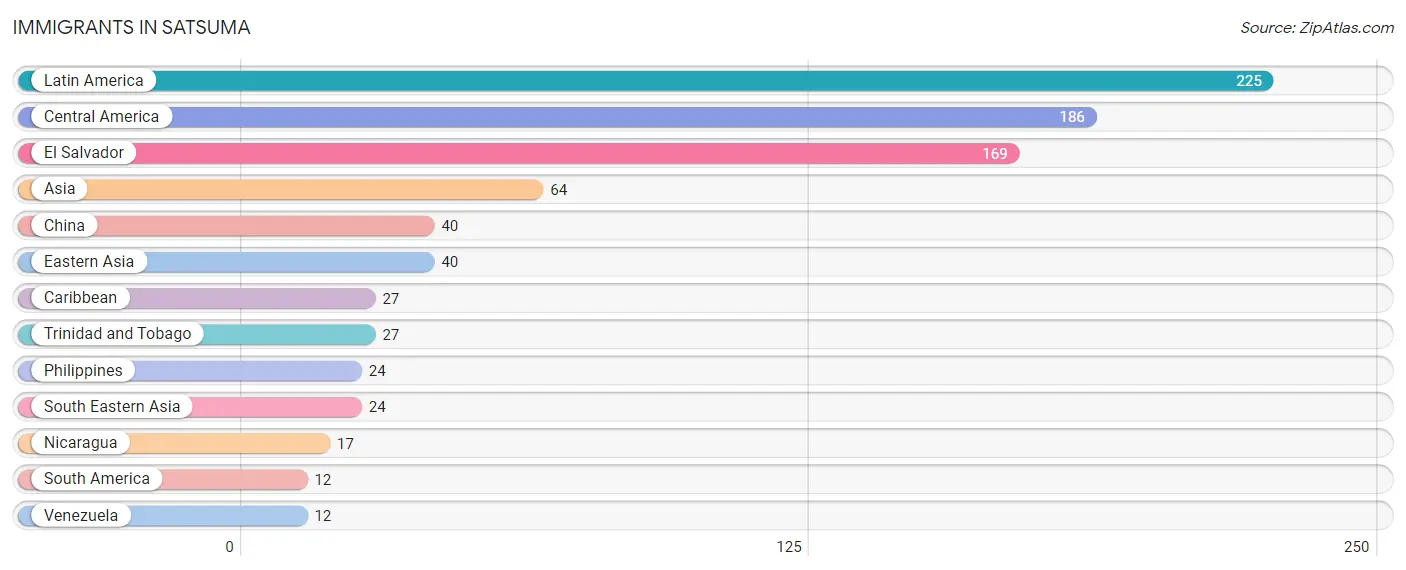
| Immigration Origin | # Population | % Population |
| Asia | 64 | 0.9% |
| Caribbean | 27 | 0.4% |
| Central America | 186 | 2.8% |
| China | 40 | 0.6% |
| Eastern Asia | 40 | 0.6% |
| El Salvador | 169 | 2.5% |
| Latin America | 225 | 3.3% |
| Nicaragua | 17 | 0.3% |
| Philippines | 24 | 0.4% |
| South America | 12 | 0.2% |
| South Eastern Asia | 24 | 0.4% |
| Trinidad and Tobago | 27 | 0.4% |
| Venezuela | 12 | 0.2% | View All 13 Rows |
Sex and Age in Satsuma
Sex and Age in Satsuma
The most populous age groups in Satsuma are 50 to 54 Years (422 | 11.1%) for men and 25 to 29 Years (347 | 11.7%) for women.
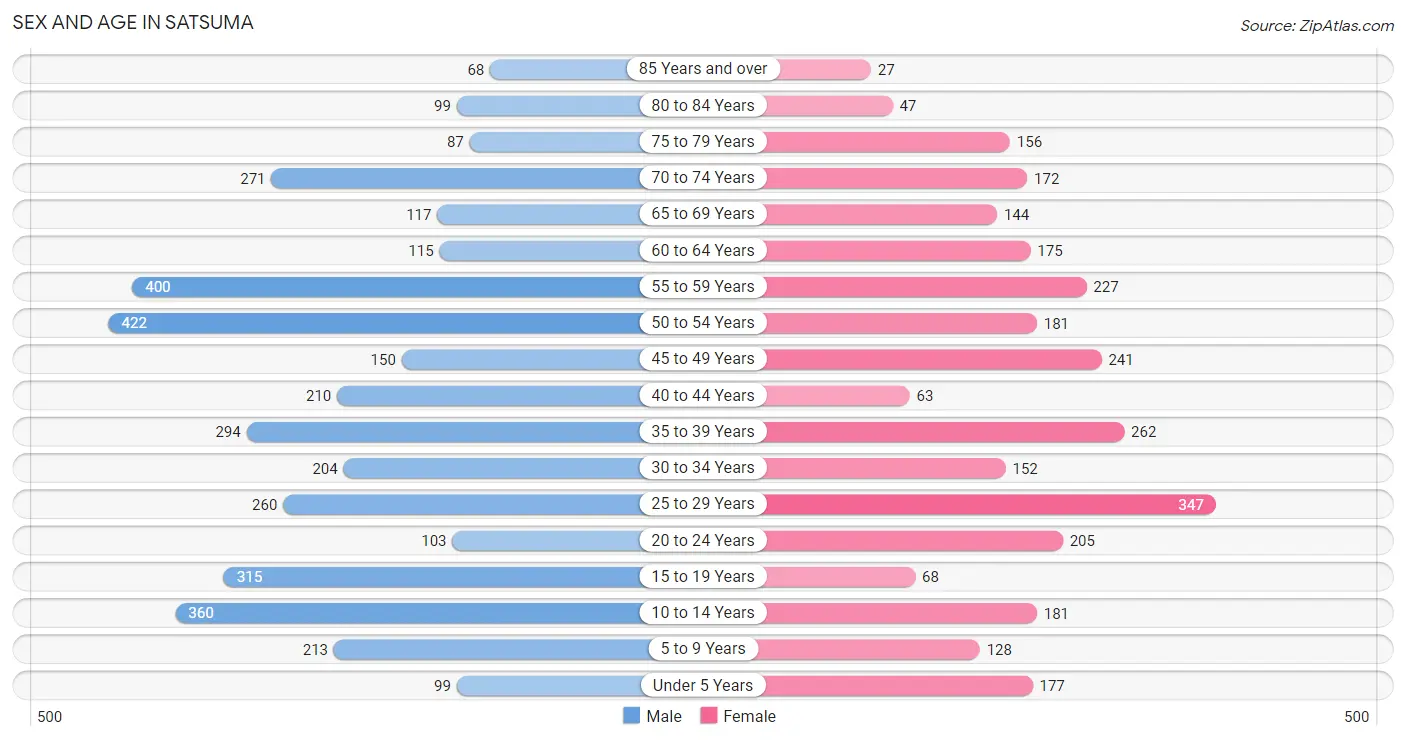
| Age Bracket | Male | Female |
| Under 5 Years | 99 (2.6%) | 177 (6.0%) |
| 5 to 9 Years | 213 (5.6%) | 128 (4.3%) |
| 10 to 14 Years | 360 (9.5%) | 181 (6.1%) |
| 15 to 19 Years | 315 (8.3%) | 68 (2.3%) |
| 20 to 24 Years | 103 (2.7%) | 205 (6.9%) |
| 25 to 29 Years | 260 (6.9%) | 347 (11.7%) |
| 30 to 34 Years | 204 (5.4%) | 152 (5.1%) |
| 35 to 39 Years | 294 (7.8%) | 262 (8.9%) |
| 40 to 44 Years | 210 (5.6%) | 63 (2.1%) |
| 45 to 49 Years | 150 (4.0%) | 241 (8.2%) |
| 50 to 54 Years | 422 (11.1%) | 181 (6.1%) |
| 55 to 59 Years | 400 (10.6%) | 227 (7.7%) |
| 60 to 64 Years | 115 (3.0%) | 175 (5.9%) |
| 65 to 69 Years | 117 (3.1%) | 144 (4.9%) |
| 70 to 74 Years | 271 (7.2%) | 172 (5.8%) |
| 75 to 79 Years | 87 (2.3%) | 156 (5.3%) |
| 80 to 84 Years | 99 (2.6%) | 47 (1.6%) |
| 85 Years and over | 68 (1.8%) | 27 (0.9%) |
| Total | 3,787 (100.0%) | 2,953 (100.0%) |
Families and Households in Satsuma
Median Family Size in Satsuma
The median family size in Satsuma is 3.14 persons per family, with married-couple families (1,658 | 86.7%) accounting for the largest median family size of 3.2 persons per family. On the other hand, single male/father families (142 | 7.4%) represent the smallest median family size with 2.50 persons per family.
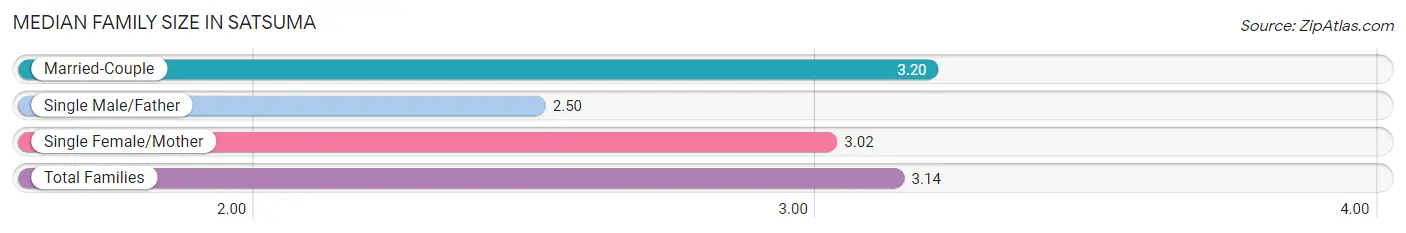
| Family Type | # Families | Family Size |
| Married-Couple | 1,658 (86.7%) | 3.20 |
| Single Male/Father | 142 (7.4%) | 2.50 |
| Single Female/Mother | 112 (5.9%) | 3.02 |
| Total Families | 1,912 (100.0%) | 3.14 |
Median Household Size in Satsuma
The median household size in Satsuma is 2.79 persons per household, with single male/father households (142 | 5.9%) accounting for the largest median household size of 3.33 persons per household. non-family households (483 | 20.2%) represent the smallest median household size with 1.10 persons per household.
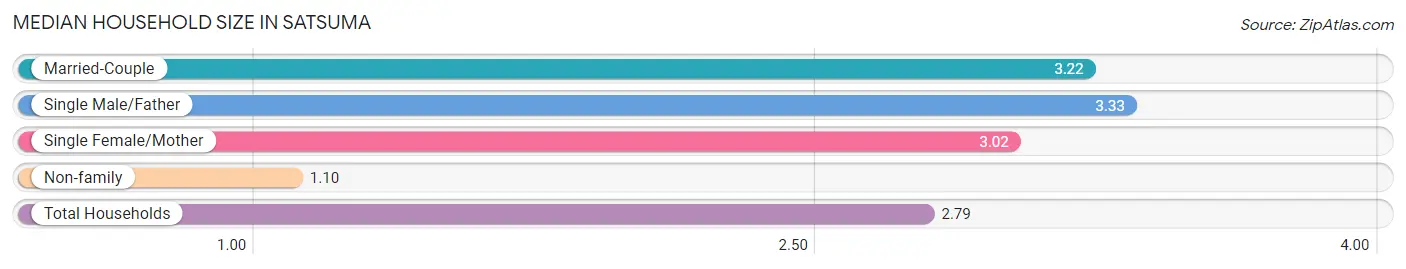
| Household Type | # Households | Household Size |
| Married-Couple | 1,658 (69.2%) | 3.22 |
| Single Male/Father | 142 (5.9%) | 3.33 |
| Single Female/Mother | 112 (4.7%) | 3.02 |
| Non-family | 483 (20.2%) | 1.10 |
| Total Households | 2,395 (100.0%) | 2.79 |
Household Size by Marriage Status in Satsuma
Out of a total of 2,395 households in Satsuma, 1,912 (79.8%) are family households, while 483 (20.2%) are nonfamily households. The most numerous type of family households are 2-person households, comprising 721, and the most common type of nonfamily households are 1-person households, comprising 446.
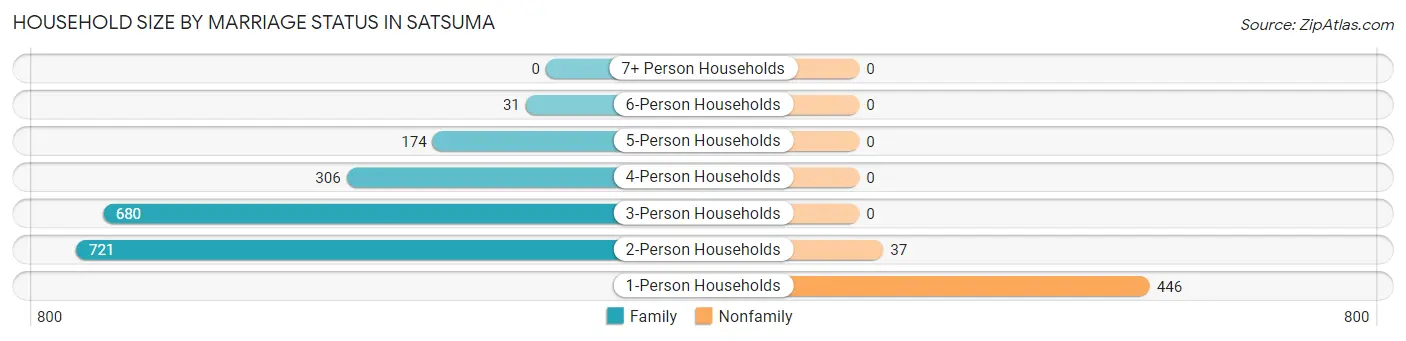
| Household Size | Family Households | Nonfamily Households |
| 1-Person Households | - | 446 (18.6%) |
| 2-Person Households | 721 (30.1%) | 37 (1.5%) |
| 3-Person Households | 680 (28.4%) | 0 (0.0%) |
| 4-Person Households | 306 (12.8%) | 0 (0.0%) |
| 5-Person Households | 174 (7.3%) | 0 (0.0%) |
| 6-Person Households | 31 (1.3%) | 0 (0.0%) |
| 7+ Person Households | 0 (0.0%) | 0 (0.0%) |
| Total | 1,912 (79.8%) | 483 (20.2%) |
Female Fertility in Satsuma
Fertility by Age in Satsuma
Average fertility rate in Satsuma is 15.0 births per 1,000 women. Women in the age bracket of 20 to 34 years have the highest fertility rate with 28.0 births per 1,000 women. Women in the age bracket of 20 to 34 years acount for 100.0% of all women with births.
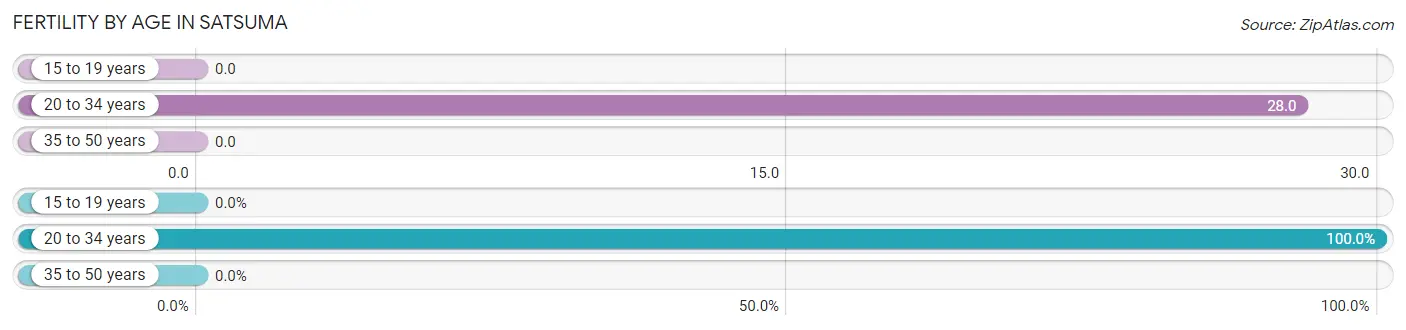
| Age Bracket | Women with Births | Births / 1,000 Women |
| 15 to 19 years | 0 (0.0%) | 0.0 |
| 20 to 34 years | 20 (100.0%) | 28.0 |
| 35 to 50 years | 0 (0.0%) | 0.0 |
| Total | 20 (100.0%) | 15.0 |
Fertility by Age by Marriage Status in Satsuma
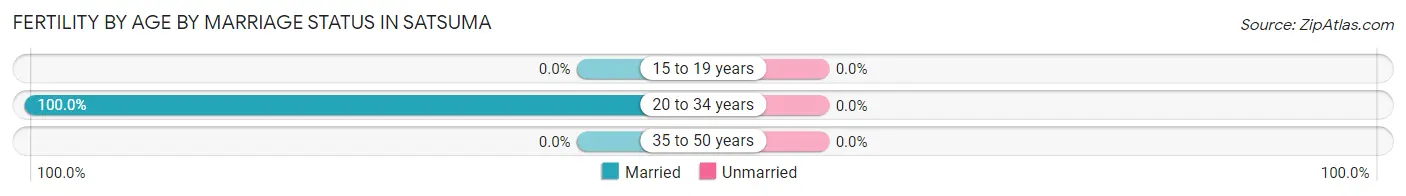
| Age Bracket | Married | Unmarried |
| 15 to 19 years | 0 (0.0%) | 0 (0.0%) |
| 20 to 34 years | 20 (100.0%) | 0 (0.0%) |
| 35 to 50 years | 0 (0.0%) | 0 (0.0%) |
| Total | 20 (100.0%) | 0 (0.0%) |
Fertility by Education in Satsuma
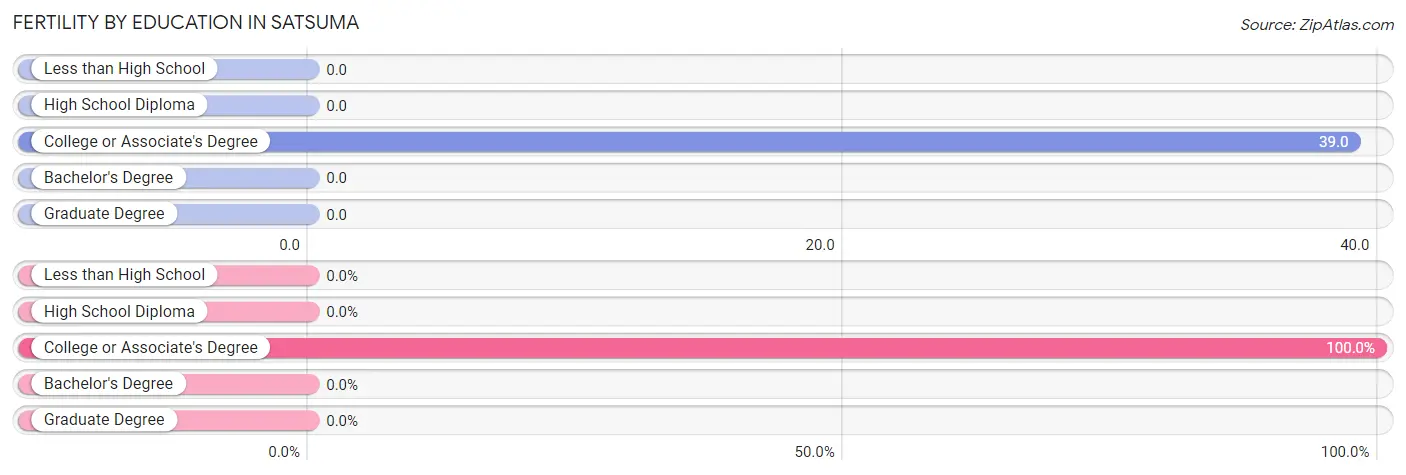
| Educational Attainment | Women with Births | Births / 1,000 Women |
| Less than High School | 0 (0.0%) | 0.0 |
| High School Diploma | 0 (0.0%) | 0.0 |
| College or Associate's Degree | 20 (100.0%) | 39.0 |
| Bachelor's Degree | 0 (0.0%) | 0.0 |
| Graduate Degree | 0 (0.0%) | 0.0 |
| Total | 20 (100.0%) | 15.0 |
Fertility by Education by Marriage Status in Satsuma
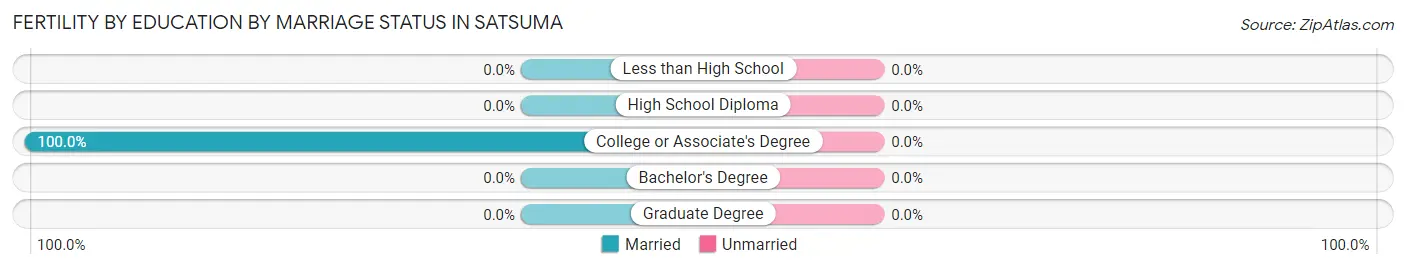
| Educational Attainment | Married | Unmarried |
| Less than High School | 0 (0.0%) | 0 (0.0%) |
| High School Diploma | 0 (0.0%) | 0 (0.0%) |
| College or Associate's Degree | 20 (100.0%) | 0 (0.0%) |
| Bachelor's Degree | 0 (0.0%) | 0 (0.0%) |
| Graduate Degree | 0 (0.0%) | 0 (0.0%) |
| Total | 20 (100.0%) | 0 (0.0%) |
Employment Characteristics in Satsuma
Employment by Class of Employer in Satsuma
Among the 3,108 employed individuals in Satsuma, private company employees (2,318 | 74.6%), local government employees (243 | 7.8%), and state government employees (166 | 5.3%) make up the most common classes of employment.
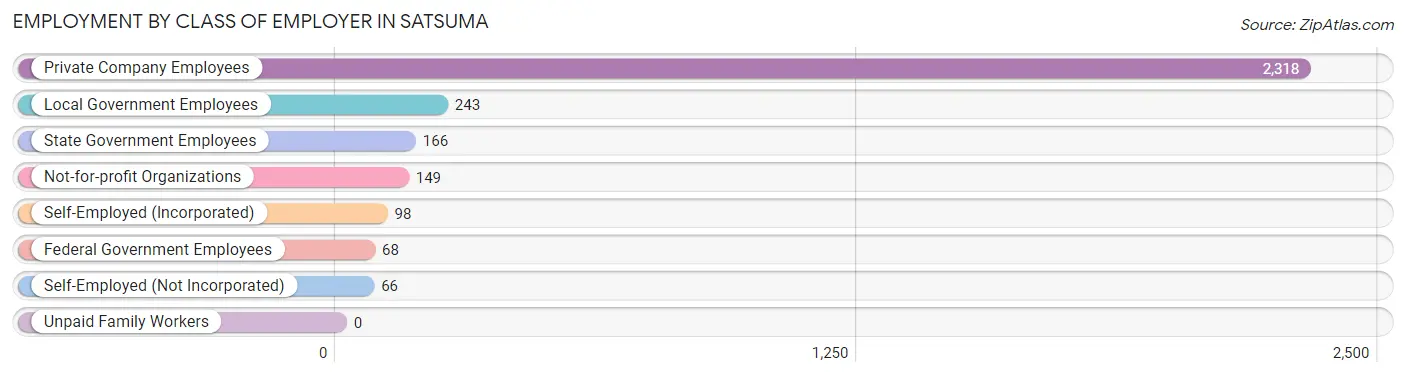
| Employer Class | # Employees | % Employees |
| Private Company Employees | 2,318 | 74.6% |
| Self-Employed (Incorporated) | 98 | 3.2% |
| Self-Employed (Not Incorporated) | 66 | 2.1% |
| Not-for-profit Organizations | 149 | 4.8% |
| Local Government Employees | 243 | 7.8% |
| State Government Employees | 166 | 5.3% |
| Federal Government Employees | 68 | 2.2% |
| Unpaid Family Workers | 0 | 0.0% |
| Total | 3,108 | 100.0% |
Employment Status by Age in Satsuma
According to the labor force statistics for Satsuma, out of the total population over 16 years of age (5,341), 62.3% or 3,327 individuals are in the labor force, with 5.9% or 196 of them unemployed. The age group with the highest labor force participation rate is 30 to 34 years, with 93.0% or 331 individuals in the labor force. Within the labor force, the 25 to 29 years age range has the highest percentage of unemployed individuals, with 14.9% or 77 of them being unemployed.
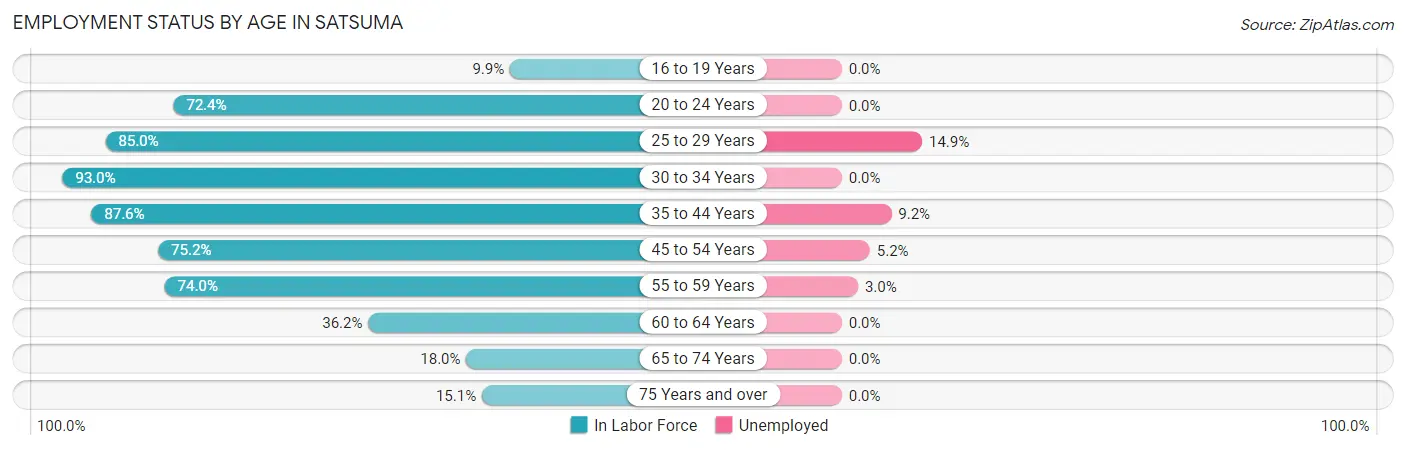
| Age Bracket | In Labor Force | Unemployed |
| 16 to 19 Years | 14 (9.9%) | 0 (0.0%) |
| 20 to 24 Years | 223 (72.4%) | 0 (0.0%) |
| 25 to 29 Years | 516 (85.0%) | 77 (14.9%) |
| 30 to 34 Years | 331 (93.0%) | 0 (0.0%) |
| 35 to 44 Years | 726 (87.6%) | 67 (9.2%) |
| 45 to 54 Years | 747 (75.2%) | 39 (5.2%) |
| 55 to 59 Years | 464 (74.0%) | 14 (3.0%) |
| 60 to 64 Years | 105 (36.2%) | 0 (0.0%) |
| 65 to 74 Years | 127 (18.0%) | 0 (0.0%) |
| 75 Years and over | 73 (15.1%) | 0 (0.0%) |
| Total | 3,327 (62.3%) | 196 (5.9%) |
Employment Status by Educational Attainment in Satsuma
According to labor force statistics for Satsuma, 78.0% of individuals (2,888) out of the total population between 25 and 64 years of age (3,703) are in the labor force, with 6.8% or 196 of them being unemployed. The group with the highest labor force participation rate are those with the educational attainment of bachelor's degree or higher, with 84.3% or 996 individuals in the labor force. Within the labor force, individuals with less than high school education have the highest percentage of unemployment, with 13.1% or 21 of them being unemployed.
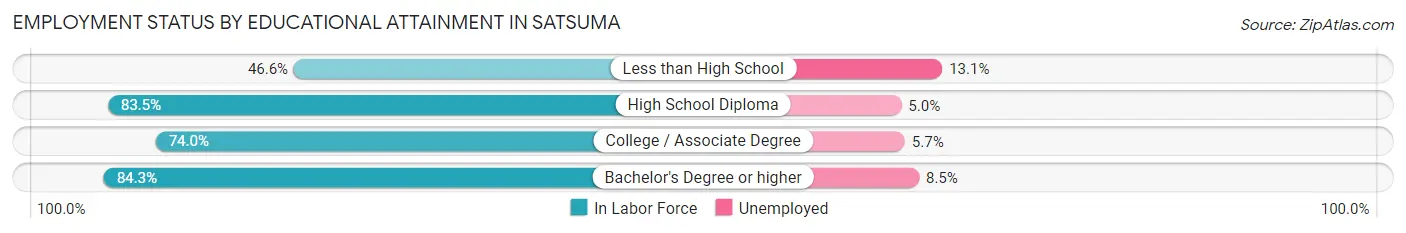
| Educational Attainment | In Labor Force | Unemployed |
| Less than High School | 160 (46.6%) | 45 (13.1%) |
| High School Diploma | 1,064 (83.5%) | 64 (5.0%) |
| College / Associate Degree | 670 (74.0%) | 52 (5.7%) |
| Bachelor's Degree or higher | 996 (84.3%) | 100 (8.5%) |
| Total | 2,888 (78.0%) | 252 (6.8%) |
Employment Occupations by Sex in Satsuma
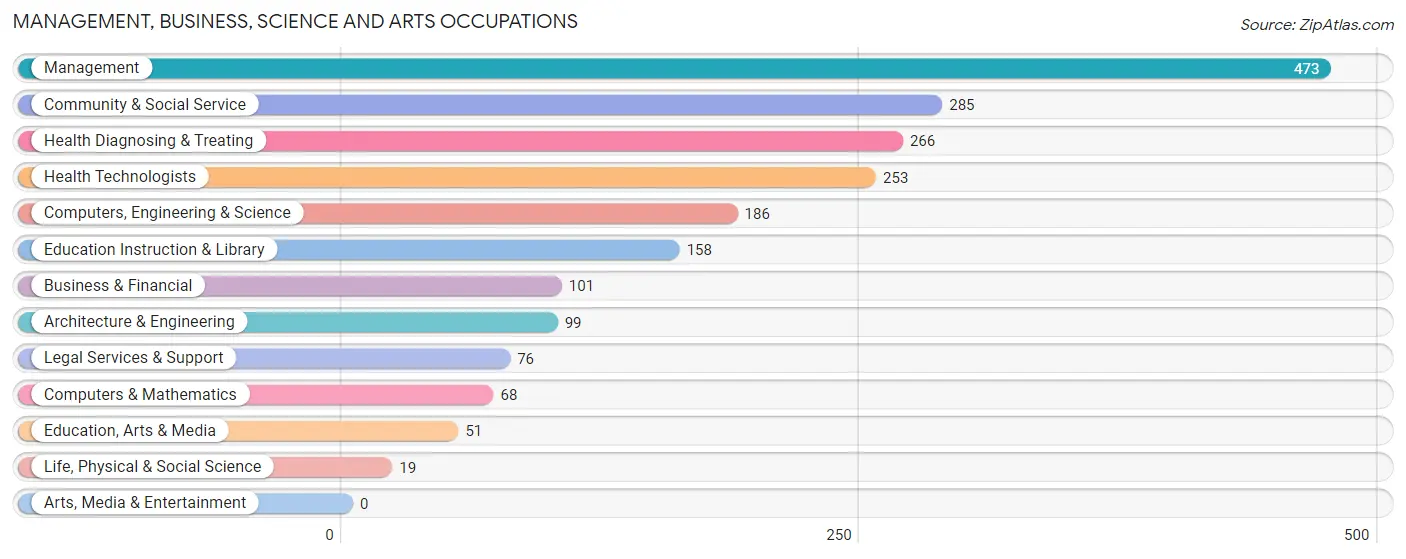
Management, Business, Science and Arts Occupations
The most common Management, Business, Science and Arts occupations in Satsuma are Management (473 | 15.1%), Community & Social Service (285 | 9.1%), Health Diagnosing & Treating (266 | 8.5%), Health Technologists (253 | 8.1%), and Computers, Engineering & Science (186 | 5.9%).
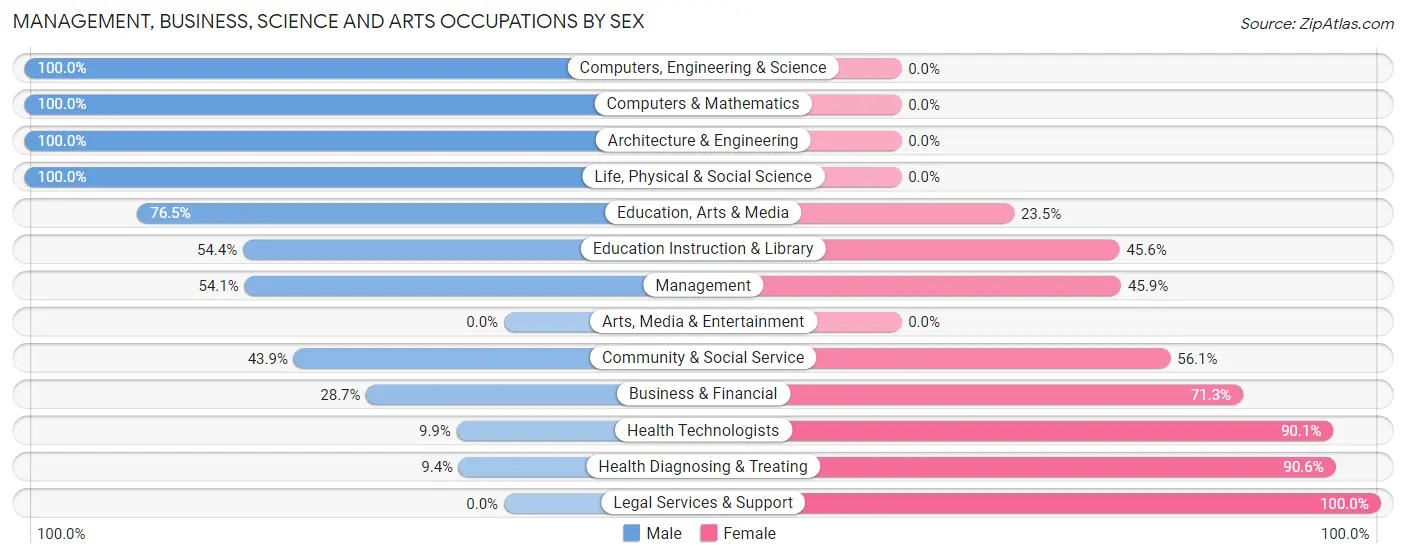
Management, Business, Science and Arts Occupations by Sex
Within the Management, Business, Science and Arts occupations in Satsuma, the most male-oriented occupations are Computers, Engineering & Science (100.0%), Computers & Mathematics (100.0%), and Architecture & Engineering (100.0%), while the most female-oriented occupations are Legal Services & Support (100.0%), Health Diagnosing & Treating (90.6%), and Health Technologists (90.1%).
| Occupation | Male | Female |
| Management | 256 (54.1%) | 217 (45.9%) |
| Business & Financial | 29 (28.7%) | 72 (71.3%) |
| Computers, Engineering & Science | 186 (100.0%) | 0 (0.0%) |
| Computers & Mathematics | 68 (100.0%) | 0 (0.0%) |
| Architecture & Engineering | 99 (100.0%) | 0 (0.0%) |
| Life, Physical & Social Science | 19 (100.0%) | 0 (0.0%) |
| Community & Social Service | 125 (43.9%) | 160 (56.1%) |
| Education, Arts & Media | 39 (76.5%) | 12 (23.5%) |
| Legal Services & Support | 0 (0.0%) | 76 (100.0%) |
| Education Instruction & Library | 86 (54.4%) | 72 (45.6%) |
| Arts, Media & Entertainment | 0 (0.0%) | 0 (0.0%) |
| Health Diagnosing & Treating | 25 (9.4%) | 241 (90.6%) |
| Health Technologists | 25 (9.9%) | 228 (90.1%) |
| Total (Category) | 621 (47.4%) | 690 (52.6%) |
| Total (Overall) | 1,701 (54.4%) | 1,428 (45.6%) |
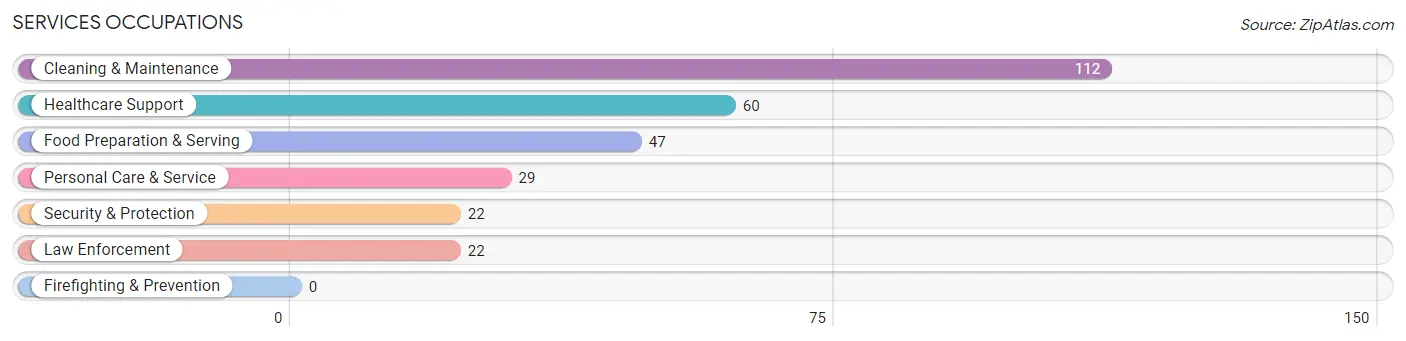
Services Occupations
The most common Services occupations in Satsuma are Cleaning & Maintenance (112 | 3.6%), Healthcare Support (60 | 1.9%), Food Preparation & Serving (47 | 1.5%), Personal Care & Service (29 | 0.9%), and Security & Protection (22 | 0.7%).
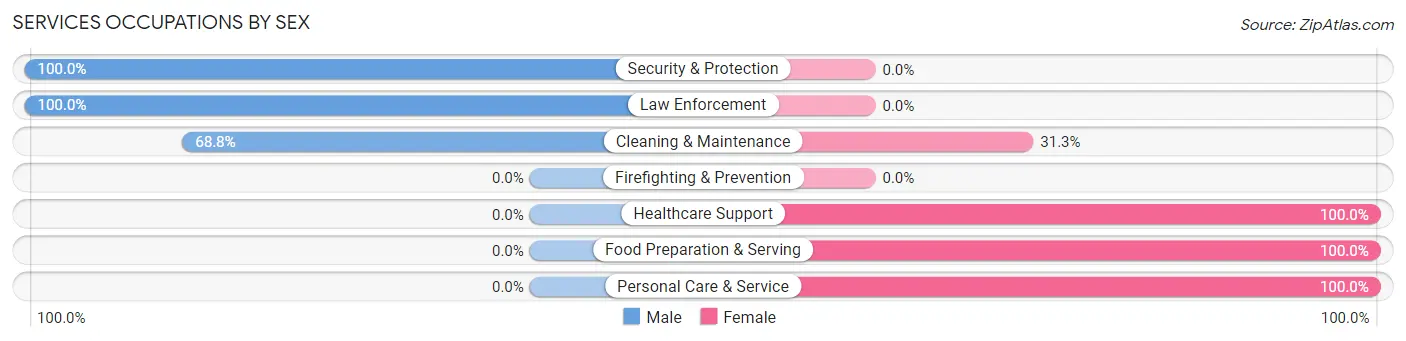
Services Occupations by Sex
Within the Services occupations in Satsuma, the most male-oriented occupations are Security & Protection (100.0%), Law Enforcement (100.0%), and Cleaning & Maintenance (68.8%), while the most female-oriented occupations are Healthcare Support (100.0%), Food Preparation & Serving (100.0%), and Personal Care & Service (100.0%).
| Occupation | Male | Female |
| Healthcare Support | 0 (0.0%) | 60 (100.0%) |
| Security & Protection | 22 (100.0%) | 0 (0.0%) |
| Firefighting & Prevention | 0 (0.0%) | 0 (0.0%) |
| Law Enforcement | 22 (100.0%) | 0 (0.0%) |
| Food Preparation & Serving | 0 (0.0%) | 47 (100.0%) |
| Cleaning & Maintenance | 77 (68.8%) | 35 (31.2%) |
| Personal Care & Service | 0 (0.0%) | 29 (100.0%) |
| Total (Category) | 99 (36.7%) | 171 (63.3%) |
| Total (Overall) | 1,701 (54.4%) | 1,428 (45.6%) |
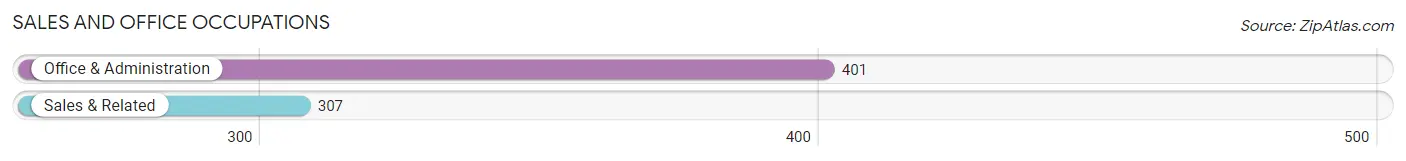
Sales and Office Occupations
The most common Sales and Office occupations in Satsuma are Office & Administration (401 | 12.8%), and Sales & Related (307 | 9.8%).
Sales and Office Occupations by Sex
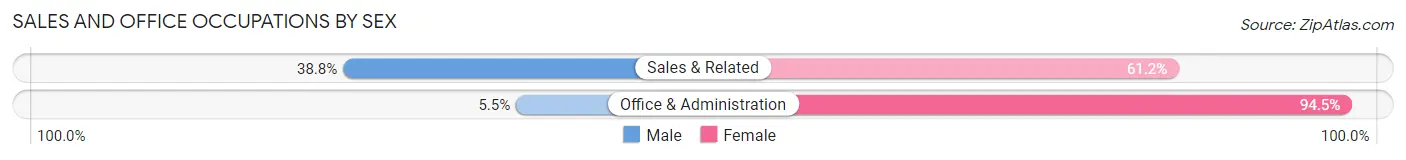
| Occupation | Male | Female |
| Sales & Related | 119 (38.8%) | 188 (61.2%) |
| Office & Administration | 22 (5.5%) | 379 (94.5%) |
| Total (Category) | 141 (19.9%) | 567 (80.1%) |
| Total (Overall) | 1,701 (54.4%) | 1,428 (45.6%) |
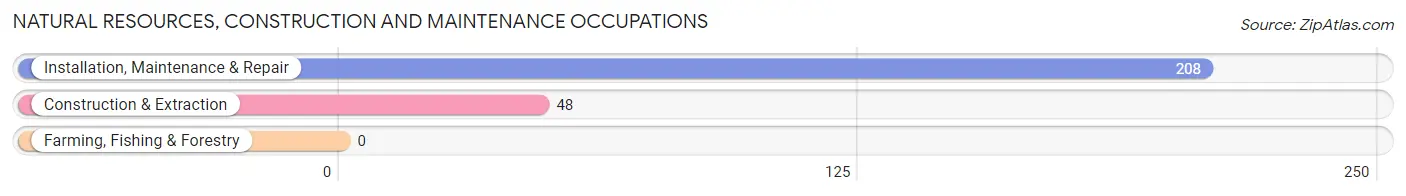
Natural Resources, Construction and Maintenance Occupations
The most common Natural Resources, Construction and Maintenance occupations in Satsuma are Installation, Maintenance & Repair (208 | 6.7%), and Construction & Extraction (48 | 1.5%).
Natural Resources, Construction and Maintenance Occupations by Sex
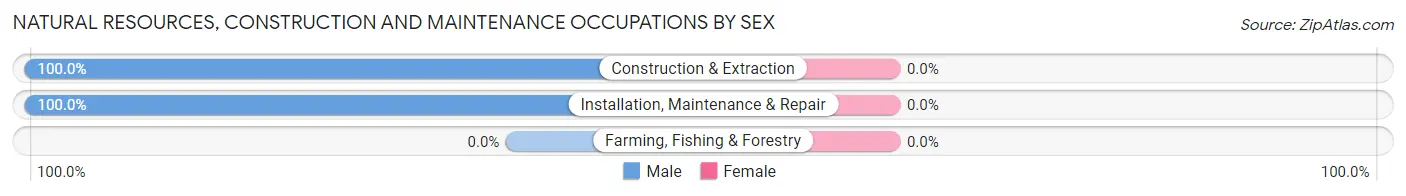
| Occupation | Male | Female |
| Farming, Fishing & Forestry | 0 (0.0%) | 0 (0.0%) |
| Construction & Extraction | 48 (100.0%) | 0 (0.0%) |
| Installation, Maintenance & Repair | 208 (100.0%) | 0 (0.0%) |
| Total (Category) | 256 (100.0%) | 0 (0.0%) |
| Total (Overall) | 1,701 (54.4%) | 1,428 (45.6%) |
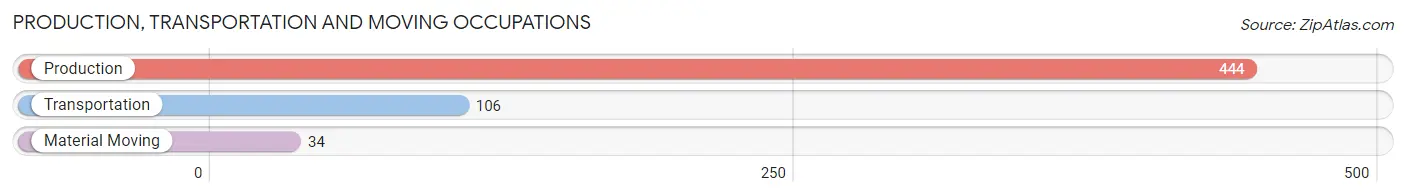
Production, Transportation and Moving Occupations
The most common Production, Transportation and Moving occupations in Satsuma are Production (444 | 14.2%), Transportation (106 | 3.4%), and Material Moving (34 | 1.1%).
Production, Transportation and Moving Occupations by Sex
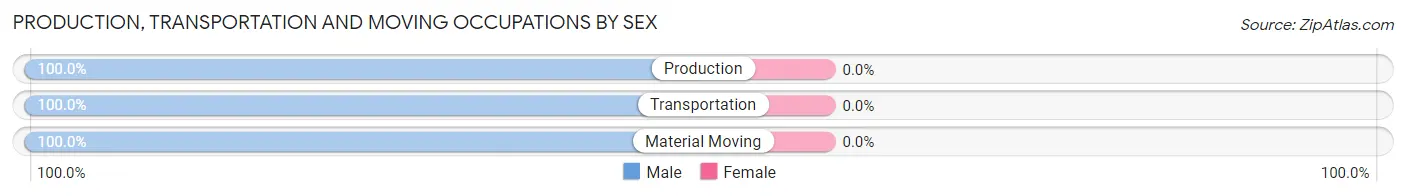
| Occupation | Male | Female |
| Production | 444 (100.0%) | 0 (0.0%) |
| Transportation | 106 (100.0%) | 0 (0.0%) |
| Material Moving | 34 (100.0%) | 0 (0.0%) |
| Total (Category) | 584 (100.0%) | 0 (0.0%) |
| Total (Overall) | 1,701 (54.4%) | 1,428 (45.6%) |
Employment Industries by Sex in Satsuma
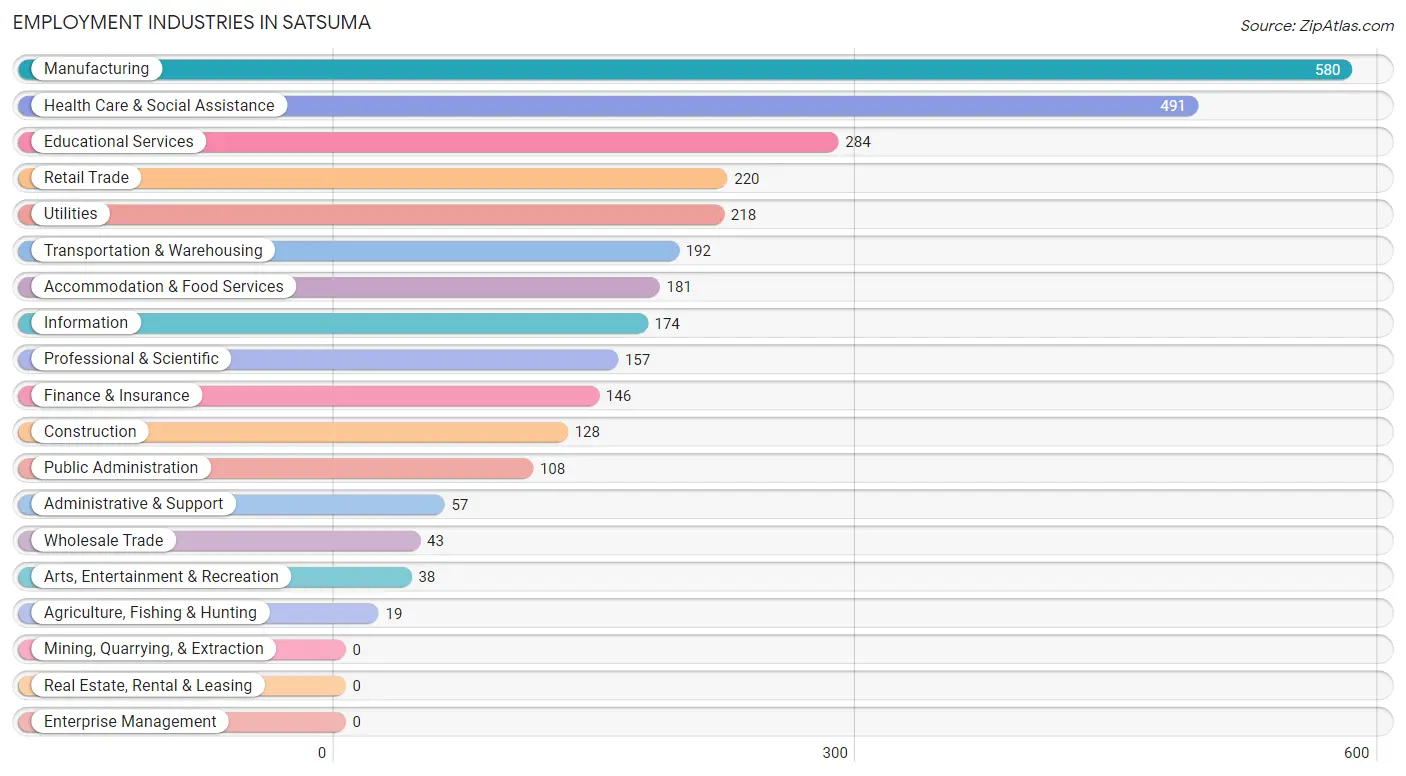
Employment Industries in Satsuma
The major employment industries in Satsuma include Manufacturing (580 | 18.5%), Health Care & Social Assistance (491 | 15.7%), Educational Services (284 | 9.1%), Retail Trade (220 | 7.0%), and Utilities (218 | 7.0%).
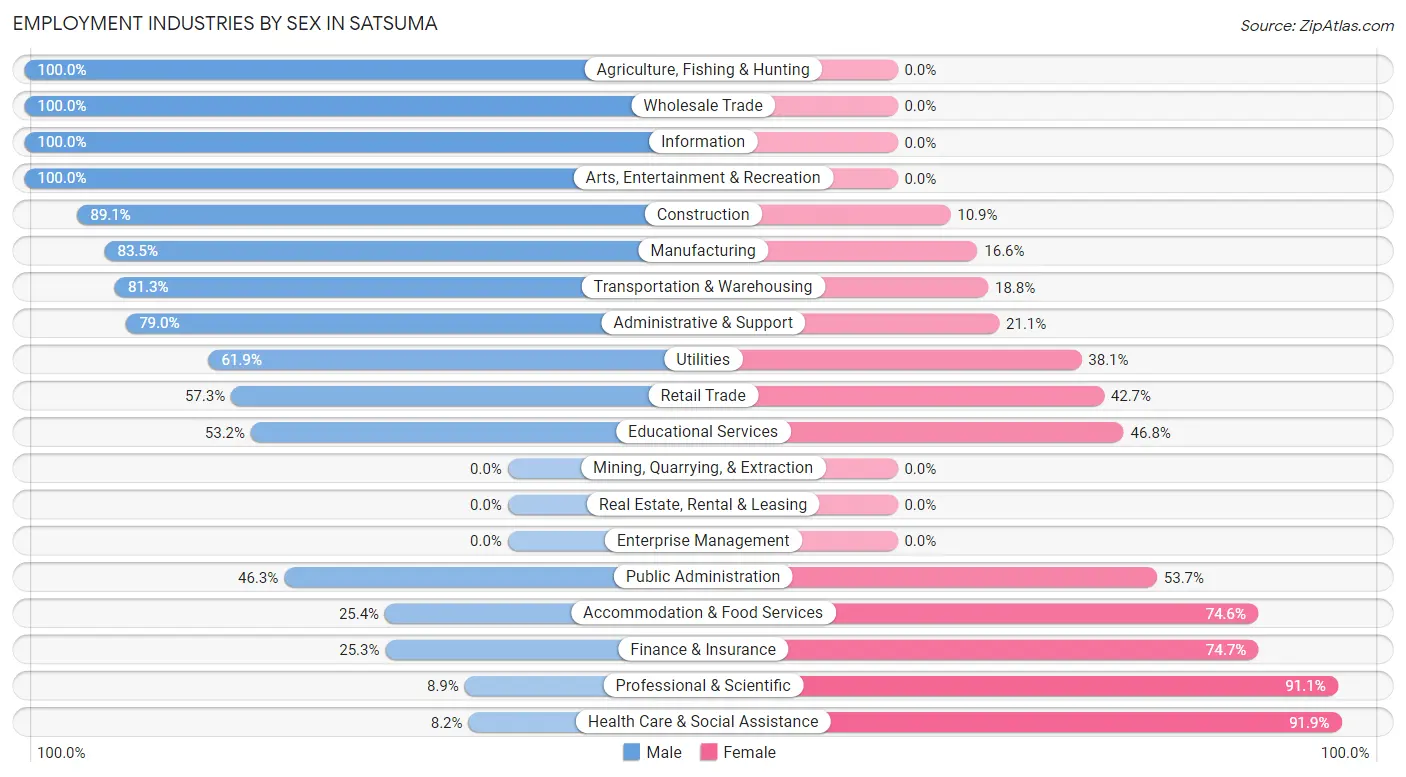
Employment Industries by Sex in Satsuma
The Satsuma industries that see more men than women are Agriculture, Fishing & Hunting (100.0%), Wholesale Trade (100.0%), and Information (100.0%), whereas the industries that tend to have a higher number of women are Health Care & Social Assistance (91.8%), Professional & Scientific (91.1%), and Finance & Insurance (74.7%).
| Industry | Male | Female |
| Agriculture, Fishing & Hunting | 19 (100.0%) | 0 (0.0%) |
| Mining, Quarrying, & Extraction | 0 (0.0%) | 0 (0.0%) |
| Construction | 114 (89.1%) | 14 (10.9%) |
| Manufacturing | 484 (83.5%) | 96 (16.6%) |
| Wholesale Trade | 43 (100.0%) | 0 (0.0%) |
| Retail Trade | 126 (57.3%) | 94 (42.7%) |
| Transportation & Warehousing | 156 (81.2%) | 36 (18.8%) |
| Utilities | 135 (61.9%) | 83 (38.1%) |
| Information | 174 (100.0%) | 0 (0.0%) |
| Finance & Insurance | 37 (25.3%) | 109 (74.7%) |
| Real Estate, Rental & Leasing | 0 (0.0%) | 0 (0.0%) |
| Professional & Scientific | 14 (8.9%) | 143 (91.1%) |
| Enterprise Management | 0 (0.0%) | 0 (0.0%) |
| Administrative & Support | 45 (78.9%) | 12 (21.0%) |
| Educational Services | 151 (53.2%) | 133 (46.8%) |
| Health Care & Social Assistance | 40 (8.2%) | 451 (91.8%) |
| Arts, Entertainment & Recreation | 38 (100.0%) | 0 (0.0%) |
| Accommodation & Food Services | 46 (25.4%) | 135 (74.6%) |
| Public Administration | 50 (46.3%) | 58 (53.7%) |
| Total | 1,701 (54.4%) | 1,428 (45.6%) |
Education in Satsuma
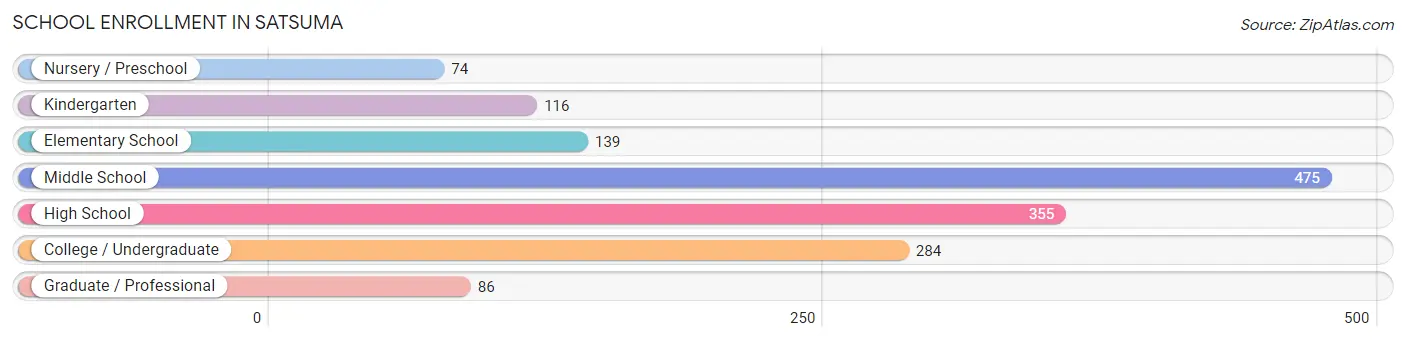
School Enrollment in Satsuma
The most common levels of schooling among the 1,529 students in Satsuma are middle school (475 | 31.1%), high school (355 | 23.2%), and college / undergraduate (284 | 18.6%).
| School Level | # Students | % Students |
| Nursery / Preschool | 74 | 4.8% |
| Kindergarten | 116 | 7.6% |
| Elementary School | 139 | 9.1% |
| Middle School | 475 | 31.1% |
| High School | 355 | 23.2% |
| College / Undergraduate | 284 | 18.6% |
| Graduate / Professional | 86 | 5.6% |
| Total | 1,529 | 100.0% |
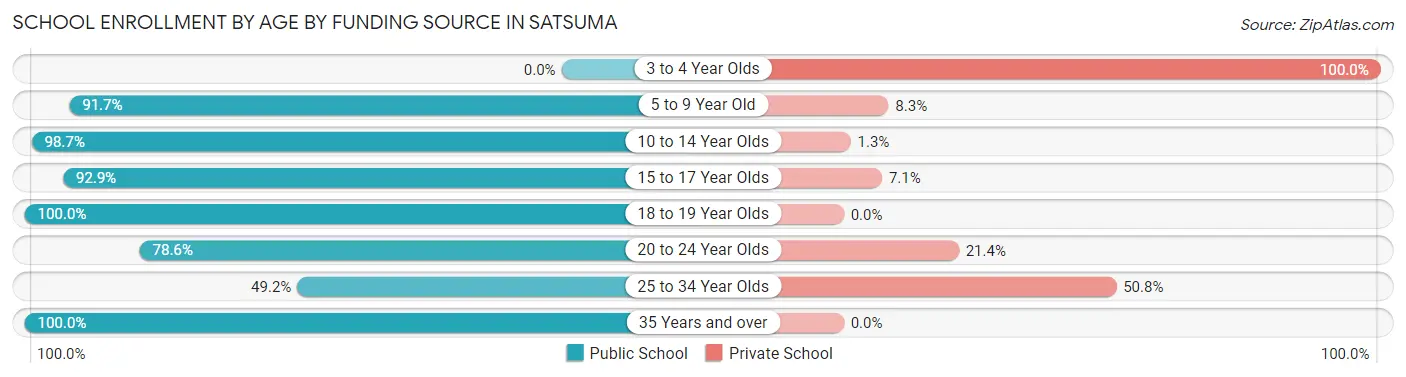
School Enrollment by Age by Funding Source in Satsuma
Out of a total of 1,529 students who are enrolled in schools in Satsuma, 219 (14.3%) attend a private institution, while the remaining 1,310 (85.7%) are enrolled in public schools. The age group of 3 to 4 year olds has the highest likelihood of being enrolled in private schools, with 74 (100.0% in the age bracket) enrolled. Conversely, the age group of 18 to 19 year olds has the lowest likelihood of being enrolled in a private school, with 50 (100.0% in the age bracket) attending a public institution.
| Age Bracket | Public School | Private School |
| 3 to 4 Year Olds | 0 (0.0%) | 74 (100.0%) |
| 5 to 9 Year Old | 198 (91.7%) | 18 (8.3%) |
| 10 to 14 Year Olds | 534 (98.7%) | 7 (1.3%) |
| 15 to 17 Year Olds | 273 (92.9%) | 21 (7.1%) |
| 18 to 19 Year Olds | 50 (100.0%) | 0 (0.0%) |
| 20 to 24 Year Olds | 121 (78.6%) | 33 (21.4%) |
| 25 to 34 Year Olds | 64 (49.2%) | 66 (50.8%) |
| 35 Years and over | 70 (100.0%) | 0 (0.0%) |
| Total | 1,310 (85.7%) | 219 (14.3%) |
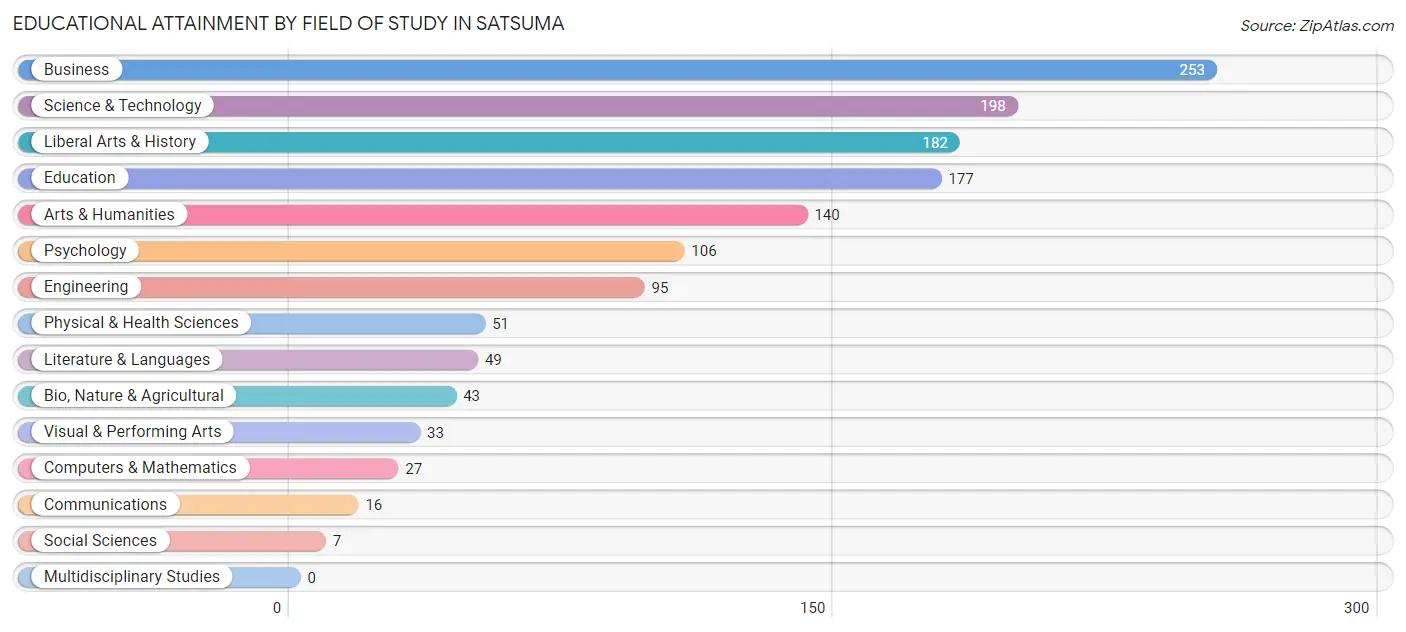
Educational Attainment by Field of Study in Satsuma
Business (253 | 18.4%), science & technology (198 | 14.4%), liberal arts & history (182 | 13.2%), education (177 | 12.9%), and arts & humanities (140 | 10.2%) are the most common fields of study among 1,377 individuals in Satsuma who have obtained a bachelor's degree or higher.
| Field of Study | # Graduates | % Graduates |
| Computers & Mathematics | 27 | 2.0% |
| Bio, Nature & Agricultural | 43 | 3.1% |
| Physical & Health Sciences | 51 | 3.7% |
| Psychology | 106 | 7.7% |
| Social Sciences | 7 | 0.5% |
| Engineering | 95 | 6.9% |
| Multidisciplinary Studies | 0 | 0.0% |
| Science & Technology | 198 | 14.4% |
| Business | 253 | 18.4% |
| Education | 177 | 12.9% |
| Literature & Languages | 49 | 3.6% |
| Liberal Arts & History | 182 | 13.2% |
| Visual & Performing Arts | 33 | 2.4% |
| Communications | 16 | 1.2% |
| Arts & Humanities | 140 | 10.2% |
| Total | 1,377 | 100.0% |
Transportation & Commute in Satsuma
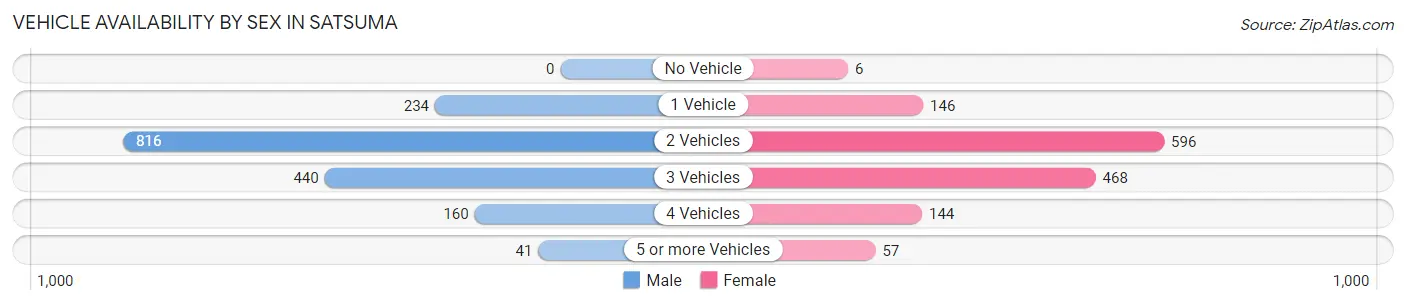
Vehicle Availability by Sex in Satsuma
The most prevalent vehicle ownership categories in Satsuma are males with 2 vehicles (816, accounting for 48.3%) and females with 2 vehicles (596, making up 57.6%).
| Vehicles Available | Male | Female |
| No Vehicle | 0 (0.0%) | 6 (0.4%) |
| 1 Vehicle | 234 (13.8%) | 146 (10.3%) |
| 2 Vehicles | 816 (48.3%) | 596 (42.1%) |
| 3 Vehicles | 440 (26.0%) | 468 (33.0%) |
| 4 Vehicles | 160 (9.5%) | 144 (10.2%) |
| 5 or more Vehicles | 41 (2.4%) | 57 (4.0%) |
| Total | 1,691 (100.0%) | 1,417 (100.0%) |
Commute Time in Satsuma
The most frequently occuring commute durations in Satsuma are 20 to 24 minutes (644 commuters, 21.9%), 30 to 34 minutes (597 commuters, 20.3%), and 15 to 19 minutes (313 commuters, 10.6%).
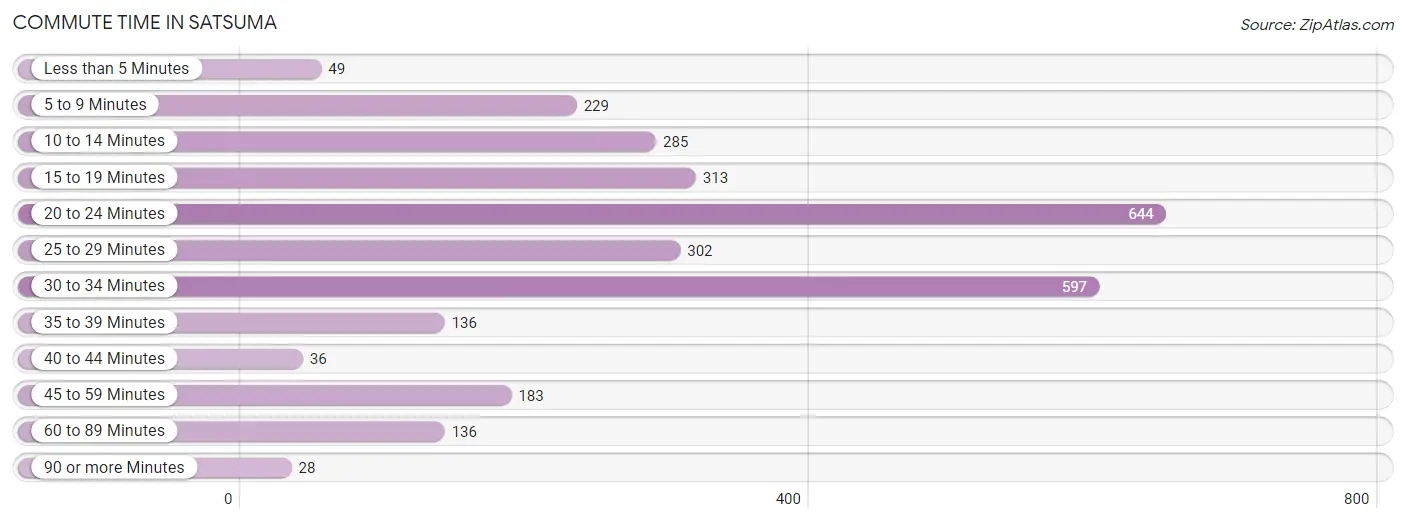
| Commute Time | # Commuters | % Commuters |
| Less than 5 Minutes | 49 | 1.7% |
| 5 to 9 Minutes | 229 | 7.8% |
| 10 to 14 Minutes | 285 | 9.7% |
| 15 to 19 Minutes | 313 | 10.6% |
| 20 to 24 Minutes | 644 | 21.9% |
| 25 to 29 Minutes | 302 | 10.3% |
| 30 to 34 Minutes | 597 | 20.3% |
| 35 to 39 Minutes | 136 | 4.6% |
| 40 to 44 Minutes | 36 | 1.2% |
| 45 to 59 Minutes | 183 | 6.2% |
| 60 to 89 Minutes | 136 | 4.6% |
| 90 or more Minutes | 28 | 0.9% |
Commute Time by Sex in Satsuma
The most common commute times in Satsuma are 30 to 34 minutes (397 commuters, 25.9%) for males and 20 to 24 minutes (362 commuters, 25.8%) for females.
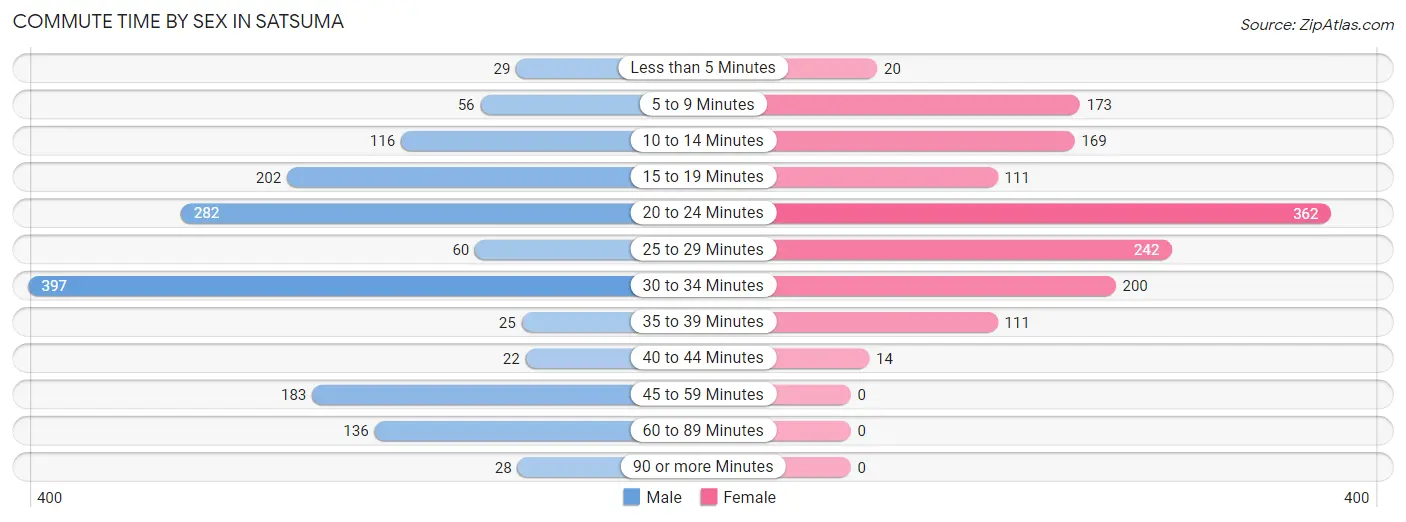
| Commute Time | Male | Female |
| Less than 5 Minutes | 29 (1.9%) | 20 (1.4%) |
| 5 to 9 Minutes | 56 (3.6%) | 173 (12.3%) |
| 10 to 14 Minutes | 116 (7.5%) | 169 (12.0%) |
| 15 to 19 Minutes | 202 (13.2%) | 111 (7.9%) |
| 20 to 24 Minutes | 282 (18.4%) | 362 (25.8%) |
| 25 to 29 Minutes | 60 (3.9%) | 242 (17.3%) |
| 30 to 34 Minutes | 397 (25.9%) | 200 (14.3%) |
| 35 to 39 Minutes | 25 (1.6%) | 111 (7.9%) |
| 40 to 44 Minutes | 22 (1.4%) | 14 (1.0%) |
| 45 to 59 Minutes | 183 (11.9%) | 0 (0.0%) |
| 60 to 89 Minutes | 136 (8.8%) | 0 (0.0%) |
| 90 or more Minutes | 28 (1.8%) | 0 (0.0%) |
Time of Departure to Work by Sex in Satsuma
The most frequent times of departure to work in Satsuma are 6:30 AM to 6:59 AM (303, 19.7%) for males and 7:00 AM to 7:29 AM (454, 32.4%) for females.
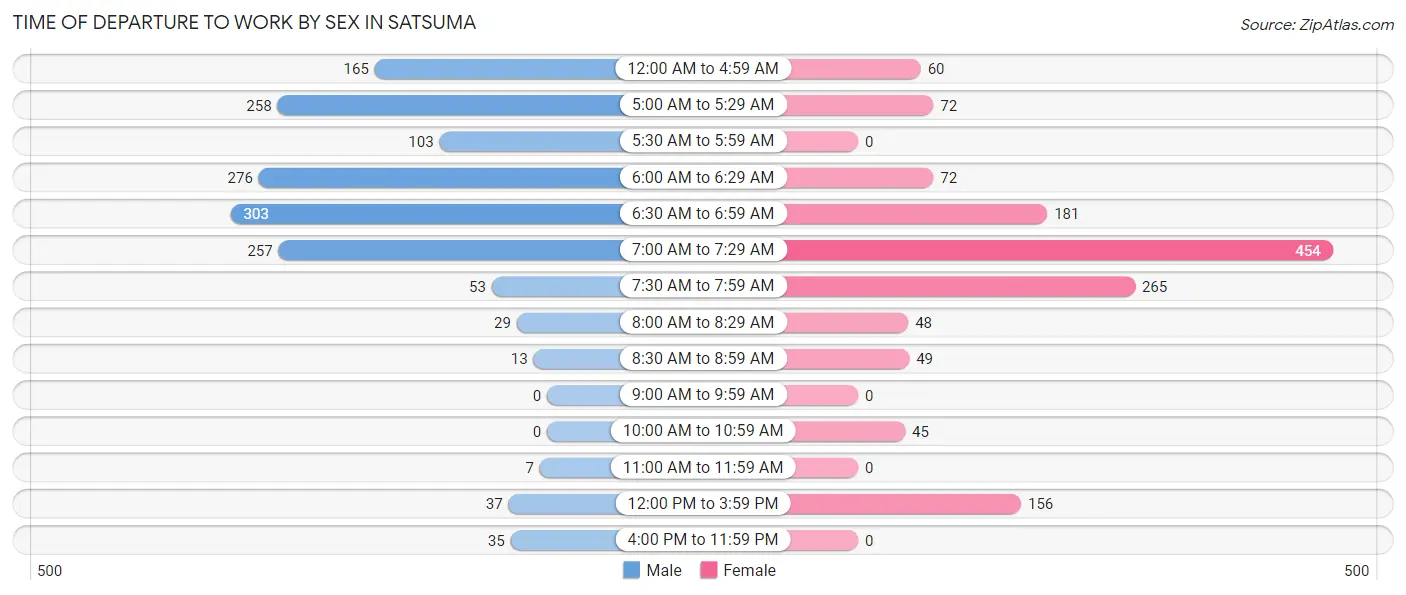
| Time of Departure | Male | Female |
| 12:00 AM to 4:59 AM | 165 (10.7%) | 60 (4.3%) |
| 5:00 AM to 5:29 AM | 258 (16.8%) | 72 (5.1%) |
| 5:30 AM to 5:59 AM | 103 (6.7%) | 0 (0.0%) |
| 6:00 AM to 6:29 AM | 276 (18.0%) | 72 (5.1%) |
| 6:30 AM to 6:59 AM | 303 (19.7%) | 181 (12.9%) |
| 7:00 AM to 7:29 AM | 257 (16.7%) | 454 (32.4%) |
| 7:30 AM to 7:59 AM | 53 (3.5%) | 265 (18.9%) |
| 8:00 AM to 8:29 AM | 29 (1.9%) | 48 (3.4%) |
| 8:30 AM to 8:59 AM | 13 (0.9%) | 49 (3.5%) |
| 9:00 AM to 9:59 AM | 0 (0.0%) | 0 (0.0%) |
| 10:00 AM to 10:59 AM | 0 (0.0%) | 45 (3.2%) |
| 11:00 AM to 11:59 AM | 7 (0.5%) | 0 (0.0%) |
| 12:00 PM to 3:59 PM | 37 (2.4%) | 156 (11.1%) |
| 4:00 PM to 11:59 PM | 35 (2.3%) | 0 (0.0%) |
| Total | 1,536 (100.0%) | 1,402 (100.0%) |
Housing Occupancy in Satsuma
Occupancy by Ownership in Satsuma
Of the total 2,395 dwellings in Satsuma, owner-occupied units account for 1,958 (81.8%), while renter-occupied units make up 437 (18.2%).
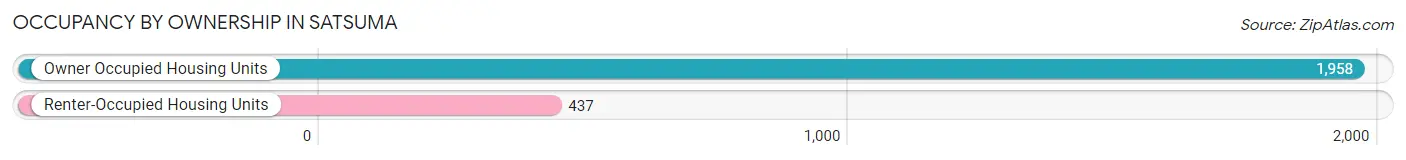
| Occupancy | # Housing Units | % Housing Units |
| Owner Occupied Housing Units | 1,958 | 81.8% |
| Renter-Occupied Housing Units | 437 | 18.2% |
| Total Occupied Housing Units | 2,395 | 100.0% |
Occupancy by Household Size in Satsuma
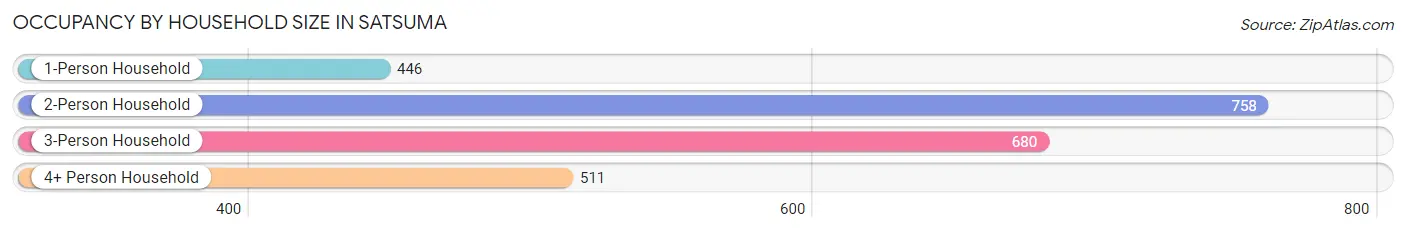
| Household Size | # Housing Units | % Housing Units |
| 1-Person Household | 446 | 18.6% |
| 2-Person Household | 758 | 31.7% |
| 3-Person Household | 680 | 28.4% |
| 4+ Person Household | 511 | 21.3% |
| Total Housing Units | 2,395 | 100.0% |
Occupancy by Ownership by Household Size in Satsuma
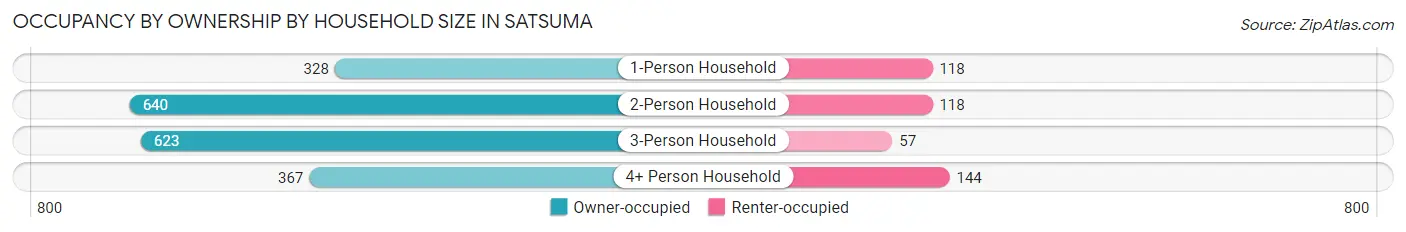
| Household Size | Owner-occupied | Renter-occupied |
| 1-Person Household | 328 (73.5%) | 118 (26.5%) |
| 2-Person Household | 640 (84.4%) | 118 (15.6%) |
| 3-Person Household | 623 (91.6%) | 57 (8.4%) |
| 4+ Person Household | 367 (71.8%) | 144 (28.2%) |
| Total Housing Units | 1,958 (81.8%) | 437 (18.2%) |
Occupancy by Educational Attainment in Satsuma
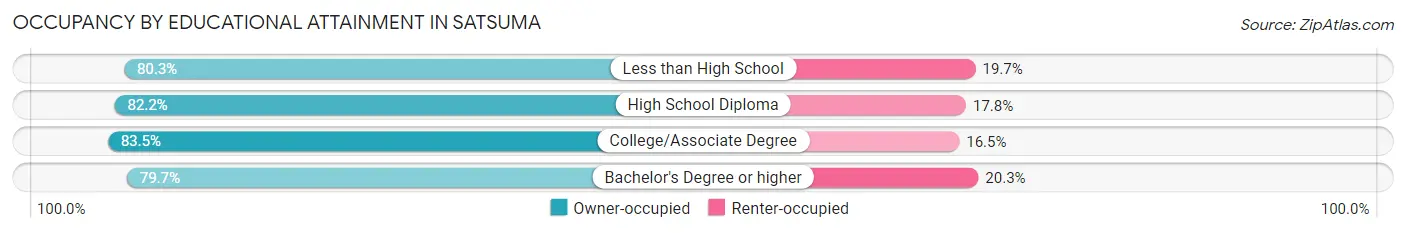
| Household Size | Owner-occupied | Renter-occupied |
| Less than High School | 106 (80.3%) | 26 (19.7%) |
| High School Diploma | 793 (82.2%) | 172 (17.8%) |
| College/Associate Degree | 532 (83.5%) | 105 (16.5%) |
| Bachelor's Degree or higher | 527 (79.7%) | 134 (20.3%) |
Occupancy by Age of Householder in Satsuma
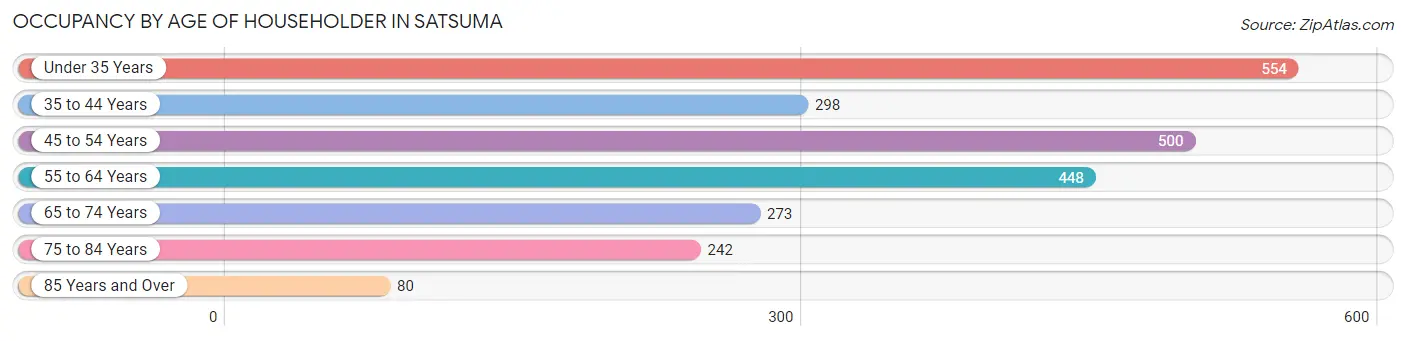
| Age Bracket | # Households | % Households |
| Under 35 Years | 554 | 23.1% |
| 35 to 44 Years | 298 | 12.4% |
| 45 to 54 Years | 500 | 20.9% |
| 55 to 64 Years | 448 | 18.7% |
| 65 to 74 Years | 273 | 11.4% |
| 75 to 84 Years | 242 | 10.1% |
| 85 Years and Over | 80 | 3.3% |
| Total | 2,395 | 100.0% |
Housing Finances in Satsuma
Median Income by Occupancy in Satsuma
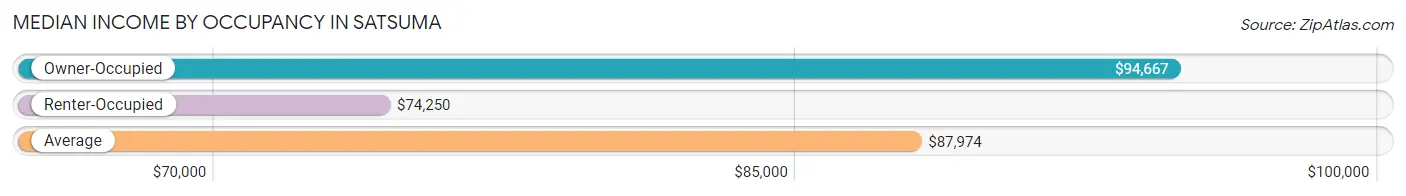
| Occupancy Type | # Households | Median Income |
| Owner-Occupied | 1,958 (81.8%) | $94,667 |
| Renter-Occupied | 437 (18.2%) | $74,250 |
| Average | 2,395 (100.0%) | $87,974 |
Occupancy by Householder Income Bracket in Satsuma
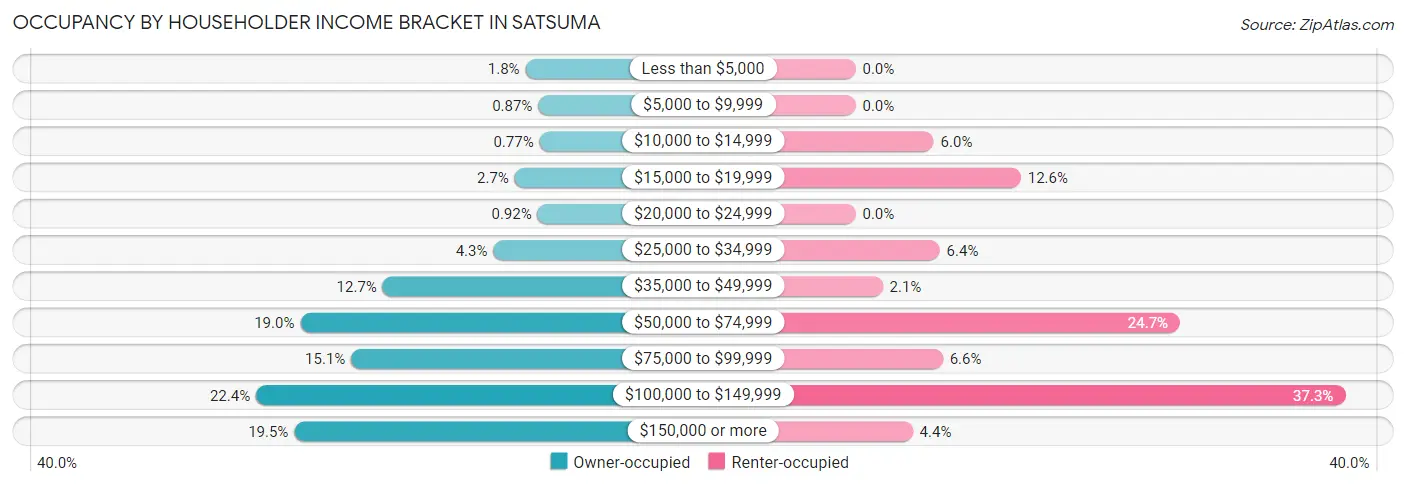
| Income Bracket | Owner-occupied | Renter-occupied |
| Less than $5,000 | 36 (1.8%) | 0 (0.0%) |
| $5,000 to $9,999 | 17 (0.9%) | 0 (0.0%) |
| $10,000 to $14,999 | 15 (0.8%) | 26 (5.9%) |
| $15,000 to $19,999 | 52 (2.7%) | 55 (12.6%) |
| $20,000 to $24,999 | 18 (0.9%) | 0 (0.0%) |
| $25,000 to $34,999 | 84 (4.3%) | 28 (6.4%) |
| $35,000 to $49,999 | 249 (12.7%) | 9 (2.1%) |
| $50,000 to $74,999 | 372 (19.0%) | 108 (24.7%) |
| $75,000 to $99,999 | 296 (15.1%) | 29 (6.6%) |
| $100,000 to $149,999 | 438 (22.4%) | 163 (37.3%) |
| $150,000 or more | 381 (19.5%) | 19 (4.3%) |
| Total | 1,958 (100.0%) | 437 (100.0%) |
Monthly Housing Cost Tiers in Satsuma
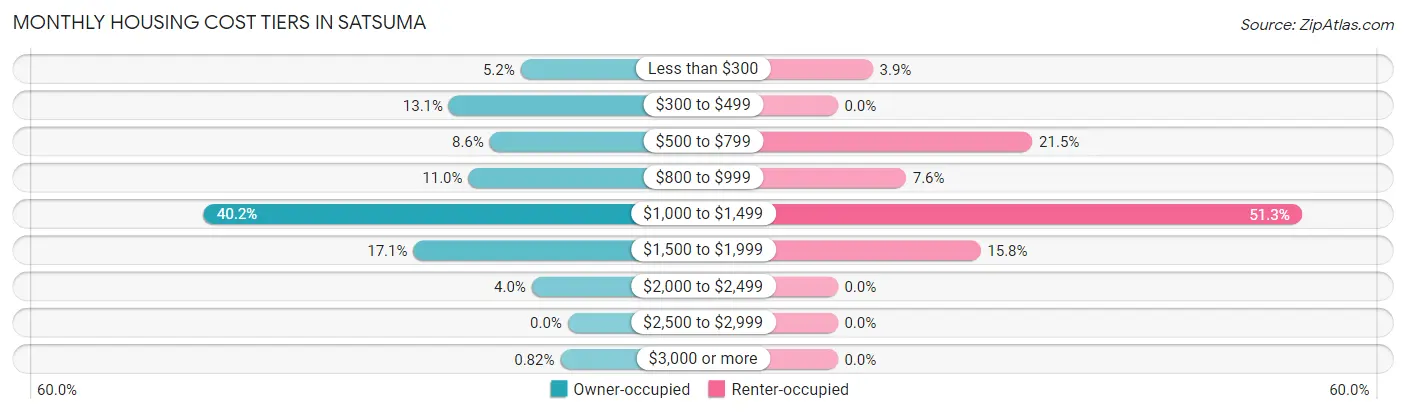
| Monthly Cost | Owner-occupied | Renter-occupied |
| Less than $300 | 102 (5.2%) | 17 (3.9%) |
| $300 to $499 | 257 (13.1%) | 0 (0.0%) |
| $500 to $799 | 169 (8.6%) | 94 (21.5%) |
| $800 to $999 | 215 (11.0%) | 33 (7.5%) |
| $1,000 to $1,499 | 787 (40.2%) | 224 (51.3%) |
| $1,500 to $1,999 | 334 (17.1%) | 69 (15.8%) |
| $2,000 to $2,499 | 78 (4.0%) | 0 (0.0%) |
| $2,500 to $2,999 | 0 (0.0%) | 0 (0.0%) |
| $3,000 or more | 16 (0.8%) | 0 (0.0%) |
| Total | 1,958 (100.0%) | 437 (100.0%) |
Physical Housing Characteristics in Satsuma
Housing Structures in Satsuma
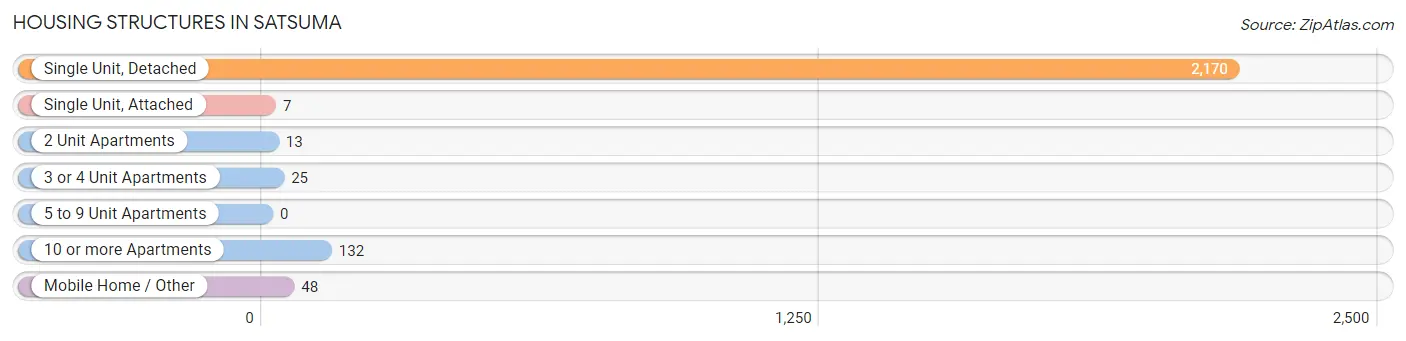
| Structure Type | # Housing Units | % Housing Units |
| Single Unit, Detached | 2,170 | 90.6% |
| Single Unit, Attached | 7 | 0.3% |
| 2 Unit Apartments | 13 | 0.5% |
| 3 or 4 Unit Apartments | 25 | 1.0% |
| 5 to 9 Unit Apartments | 0 | 0.0% |
| 10 or more Apartments | 132 | 5.5% |
| Mobile Home / Other | 48 | 2.0% |
| Total | 2,395 | 100.0% |
Housing Structures by Occupancy in Satsuma
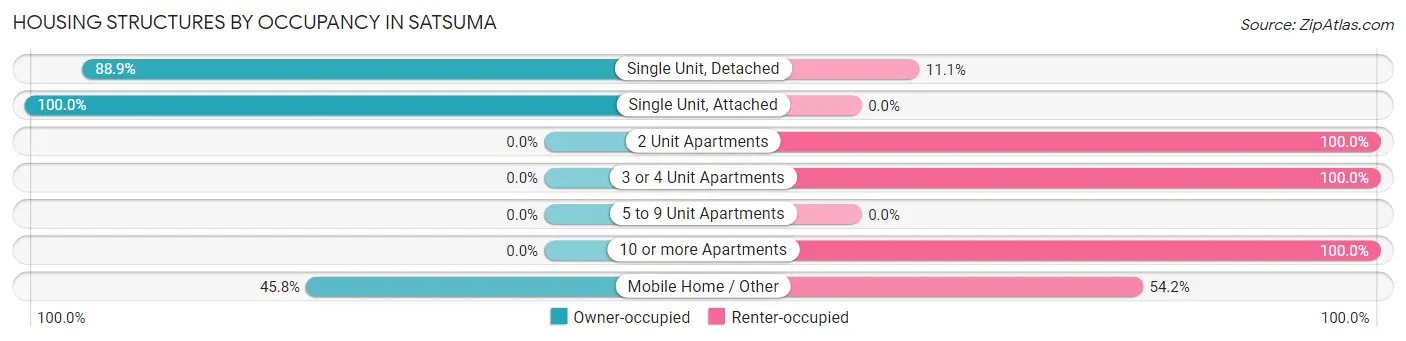
| Structure Type | Owner-occupied | Renter-occupied |
| Single Unit, Detached | 1,929 (88.9%) | 241 (11.1%) |
| Single Unit, Attached | 7 (100.0%) | 0 (0.0%) |
| 2 Unit Apartments | 0 (0.0%) | 13 (100.0%) |
| 3 or 4 Unit Apartments | 0 (0.0%) | 25 (100.0%) |
| 5 to 9 Unit Apartments | 0 (0.0%) | 0 (0.0%) |
| 10 or more Apartments | 0 (0.0%) | 132 (100.0%) |
| Mobile Home / Other | 22 (45.8%) | 26 (54.2%) |
| Total | 1,958 (81.8%) | 437 (18.2%) |
Housing Structures by Number of Rooms in Satsuma
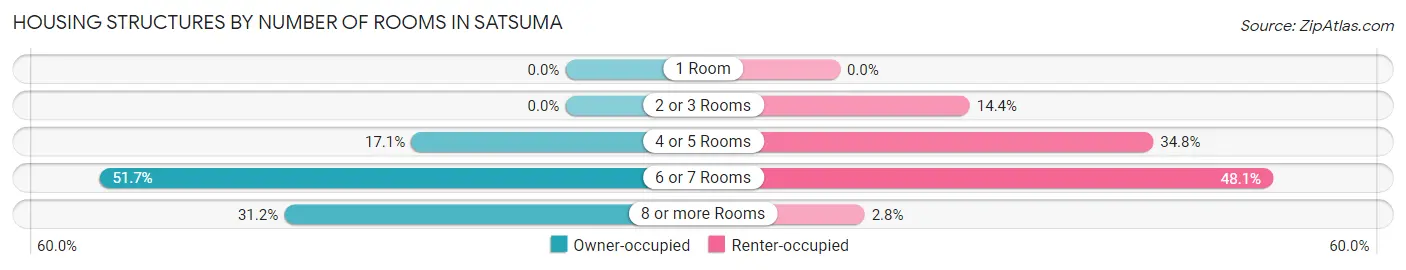
| Number of Rooms | Owner-occupied | Renter-occupied |
| 1 Room | 0 (0.0%) | 0 (0.0%) |
| 2 or 3 Rooms | 0 (0.0%) | 63 (14.4%) |
| 4 or 5 Rooms | 335 (17.1%) | 152 (34.8%) |
| 6 or 7 Rooms | 1,012 (51.7%) | 210 (48.0%) |
| 8 or more Rooms | 611 (31.2%) | 12 (2.8%) |
| Total | 1,958 (100.0%) | 437 (100.0%) |
Housing Structure by Heating Type in Satsuma
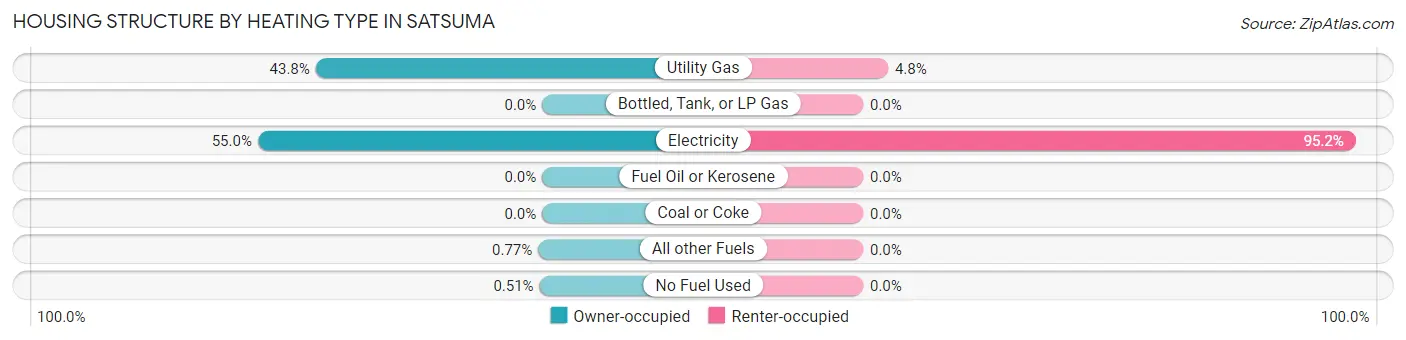
| Heating Type | Owner-occupied | Renter-occupied |
| Utility Gas | 857 (43.8%) | 21 (4.8%) |
| Bottled, Tank, or LP Gas | 0 (0.0%) | 0 (0.0%) |
| Electricity | 1,076 (54.9%) | 416 (95.2%) |
| Fuel Oil or Kerosene | 0 (0.0%) | 0 (0.0%) |
| Coal or Coke | 0 (0.0%) | 0 (0.0%) |
| All other Fuels | 15 (0.8%) | 0 (0.0%) |
| No Fuel Used | 10 (0.5%) | 0 (0.0%) |
| Total | 1,958 (100.0%) | 437 (100.0%) |
Household Vehicle Usage in Satsuma
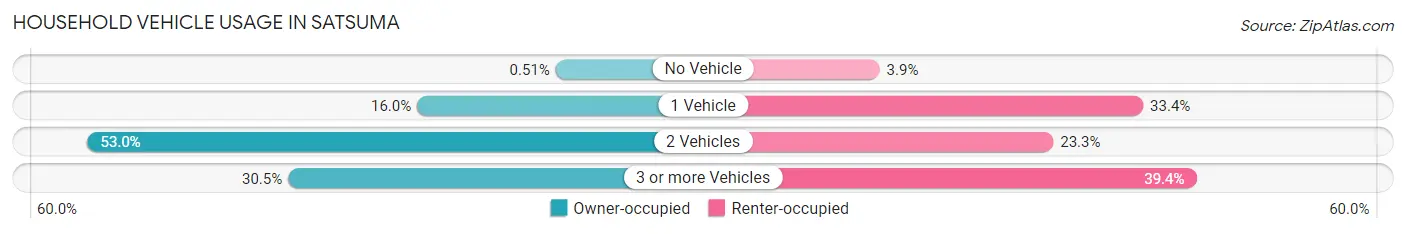
| Vehicles per Household | Owner-occupied | Renter-occupied |
| No Vehicle | 10 (0.5%) | 17 (3.9%) |
| 1 Vehicle | 314 (16.0%) | 146 (33.4%) |
| 2 Vehicles | 1,037 (53.0%) | 102 (23.3%) |
| 3 or more Vehicles | 597 (30.5%) | 172 (39.4%) |
| Total | 1,958 (100.0%) | 437 (100.0%) |
Real Estate & Mortgages in Satsuma
Real Estate and Mortgage Overview in Satsuma
| Characteristic | Without Mortgage | With Mortgage |
| Housing Units | 523 | 1,435 |
| Median Property Value | $205,800 | $175,900 |
| Median Household Income | $63,750 | $306 |
| Monthly Housing Costs | $435 | $16 |
| Real Estate Taxes | $939 | $86 |
Property Value by Mortgage Status in Satsuma
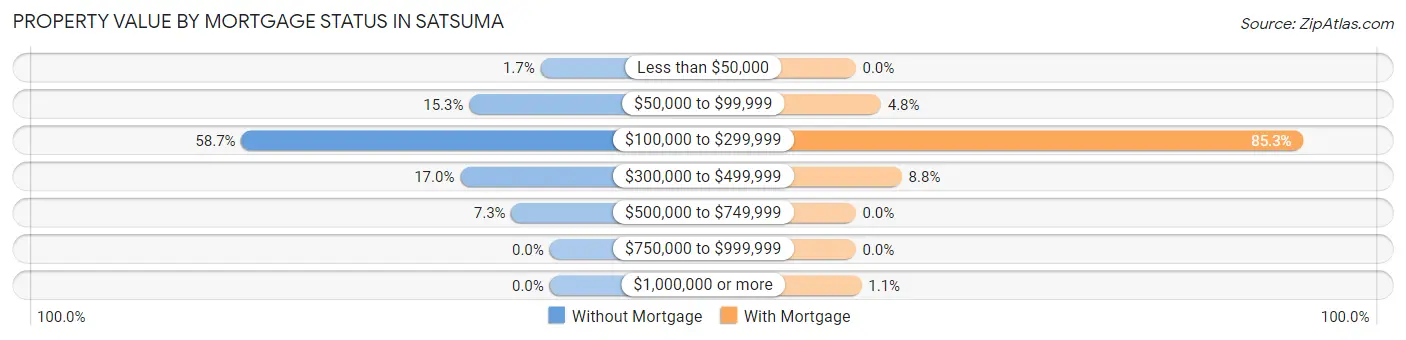
| Property Value | Without Mortgage | With Mortgage |
| Less than $50,000 | 9 (1.7%) | 0 (0.0%) |
| $50,000 to $99,999 | 80 (15.3%) | 69 (4.8%) |
| $100,000 to $299,999 | 307 (58.7%) | 1,224 (85.3%) |
| $300,000 to $499,999 | 89 (17.0%) | 126 (8.8%) |
| $500,000 to $749,999 | 38 (7.3%) | 0 (0.0%) |
| $750,000 to $999,999 | 0 (0.0%) | 0 (0.0%) |
| $1,000,000 or more | 0 (0.0%) | 16 (1.1%) |
| Total | 523 (100.0%) | 1,435 (100.0%) |
Household Income by Mortgage Status in Satsuma
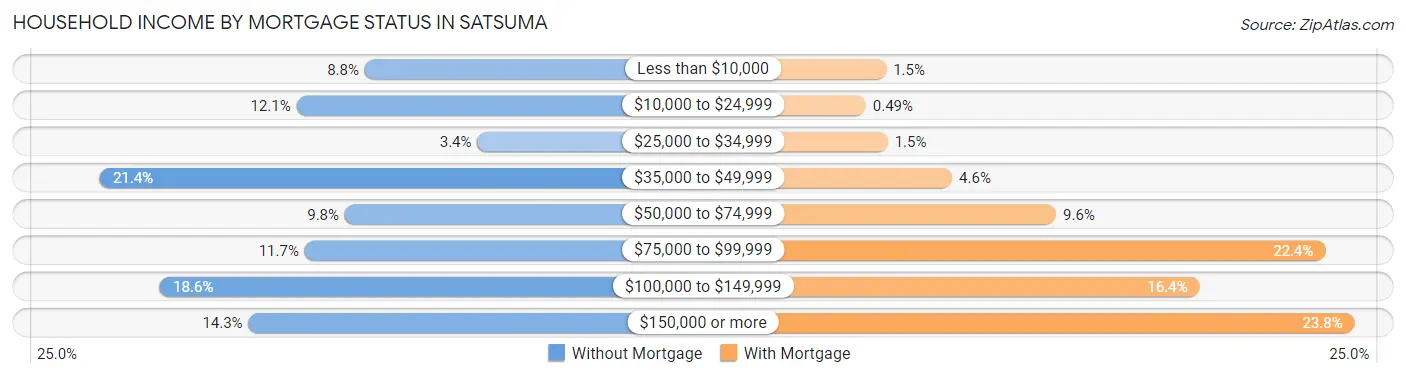
| Household Income | Without Mortgage | With Mortgage |
| Less than $10,000 | 46 (8.8%) | 21 (1.5%) |
| $10,000 to $24,999 | 63 (12.0%) | 7 (0.5%) |
| $25,000 to $34,999 | 18 (3.4%) | 22 (1.5%) |
| $35,000 to $49,999 | 112 (21.4%) | 66 (4.6%) |
| $50,000 to $74,999 | 51 (9.8%) | 137 (9.6%) |
| $75,000 to $99,999 | 61 (11.7%) | 321 (22.4%) |
| $100,000 to $149,999 | 97 (18.5%) | 235 (16.4%) |
| $150,000 or more | 75 (14.3%) | 341 (23.8%) |
| Total | 523 (100.0%) | 1,435 (100.0%) |
Property Value to Household Income Ratio in Satsuma
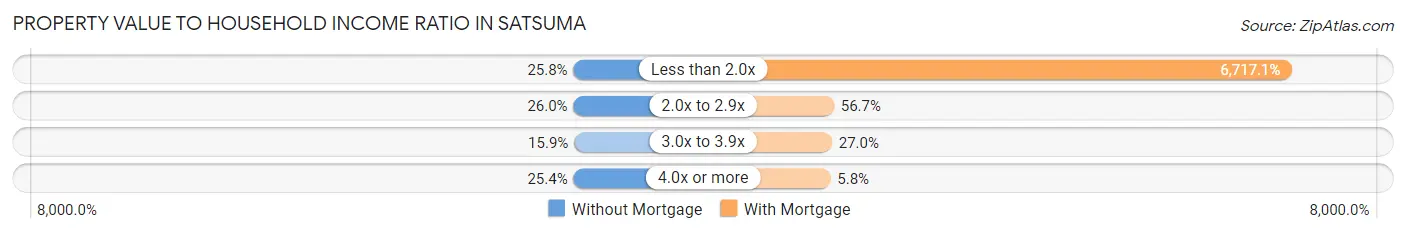
| Value-to-Income Ratio | Without Mortgage | With Mortgage |
| Less than 2.0x | 135 (25.8%) | 96,390 (6,717.1%) |
| 2.0x to 2.9x | 136 (26.0%) | 813 (56.7%) |
| 3.0x to 3.9x | 83 (15.9%) | 388 (27.0%) |
| 4.0x or more | 133 (25.4%) | 83 (5.8%) |
| Total | 523 (100.0%) | 1,435 (100.0%) |
Real Estate Taxes by Mortgage Status in Satsuma
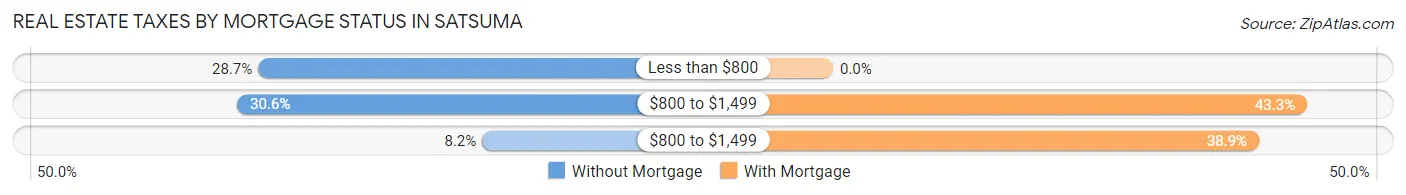
| Property Taxes | Without Mortgage | With Mortgage |
| Less than $800 | 150 (28.7%) | 0 (0.0%) |
| $800 to $1,499 | 160 (30.6%) | 621 (43.3%) |
| $800 to $1,499 | 43 (8.2%) | 558 (38.9%) |
| Total | 523 (100.0%) | 1,435 (100.0%) |
Health & Disability in Satsuma
Health Insurance Coverage by Age in Satsuma
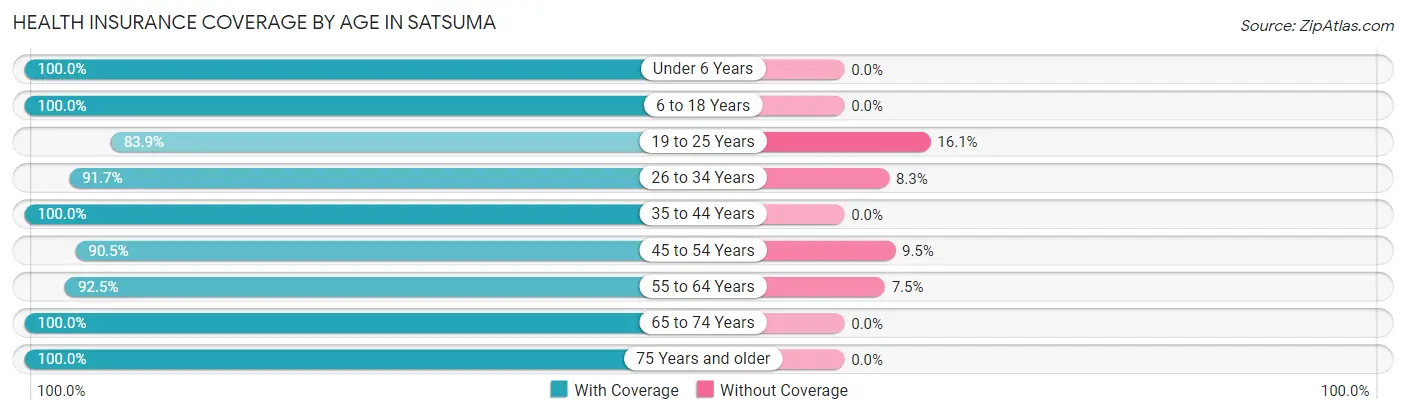
| Age Bracket | With Coverage | Without Coverage |
| Under 6 Years | 376 (100.0%) | 0 (0.0%) |
| 6 to 18 Years | 1,126 (100.0%) | 0 (0.0%) |
| 19 to 25 Years | 324 (83.9%) | 62 (16.1%) |
| 26 to 34 Years | 847 (91.7%) | 77 (8.3%) |
| 35 to 44 Years | 829 (100.0%) | 0 (0.0%) |
| 45 to 54 Years | 900 (90.5%) | 94 (9.5%) |
| 55 to 64 Years | 846 (92.5%) | 69 (7.5%) |
| 65 to 74 Years | 675 (100.0%) | 0 (0.0%) |
| 75 Years and older | 458 (100.0%) | 0 (0.0%) |
| Total | 6,381 (95.5%) | 302 (4.5%) |
Health Insurance Coverage by Citizenship Status in Satsuma
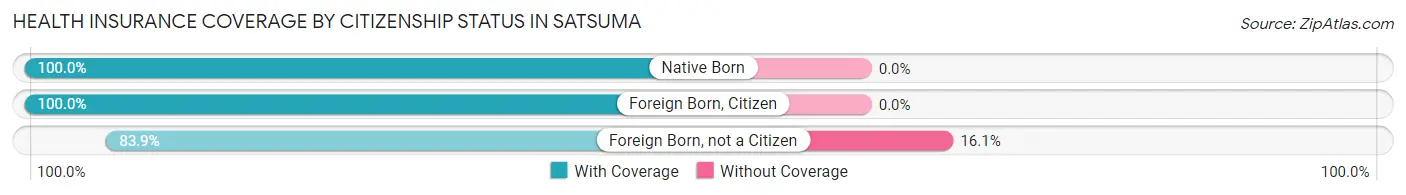
| Citizenship Status | With Coverage | Without Coverage |
| Native Born | 376 (100.0%) | 0 (0.0%) |
| Foreign Born, Citizen | 1,126 (100.0%) | 0 (0.0%) |
| Foreign Born, not a Citizen | 324 (83.9%) | 62 (16.1%) |
Health Insurance Coverage by Household Income in Satsuma
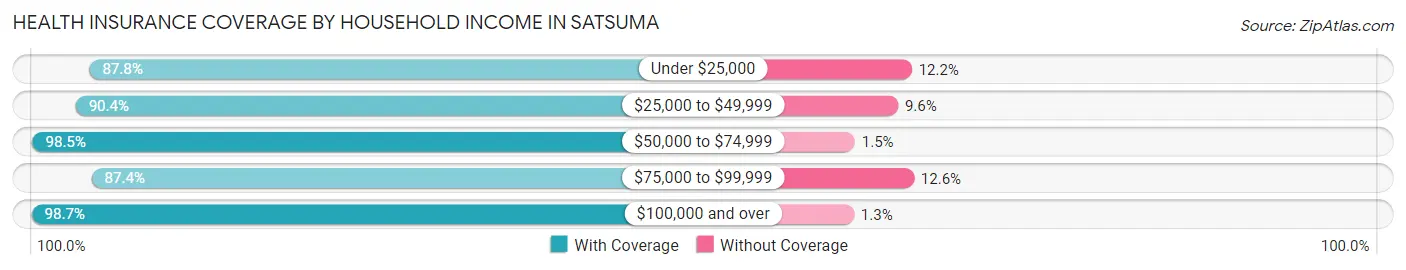
| Household Income | With Coverage | Without Coverage |
| Under $25,000 | 260 (87.8%) | 36 (12.2%) |
| $25,000 to $49,999 | 849 (90.4%) | 90 (9.6%) |
| $50,000 to $74,999 | 1,302 (98.5%) | 20 (1.5%) |
| $75,000 to $99,999 | 786 (87.4%) | 113 (12.6%) |
| $100,000 and over | 3,184 (98.7%) | 43 (1.3%) |
Public vs Private Health Insurance Coverage by Age in Satsuma
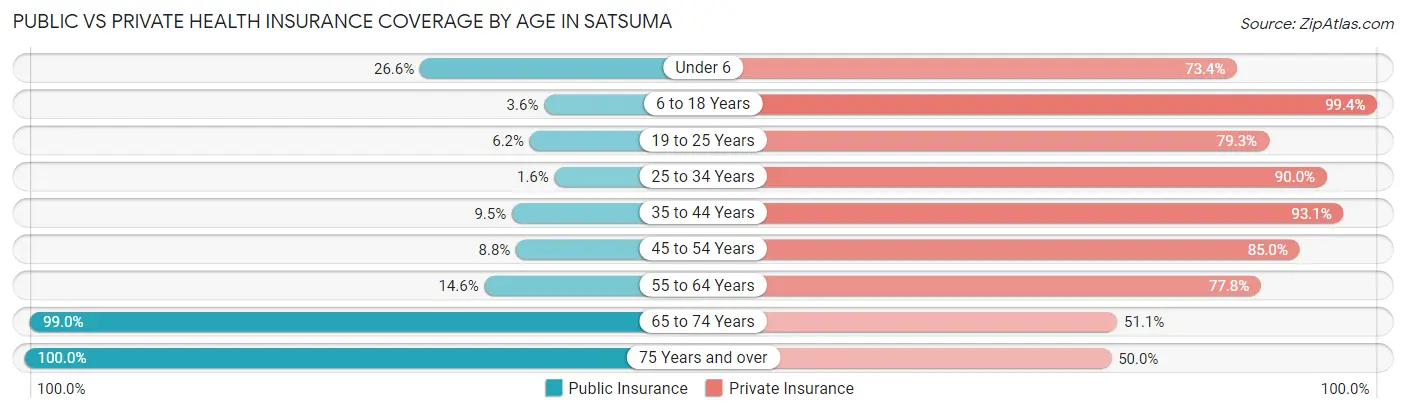
| Age Bracket | Public Insurance | Private Insurance |
| Under 6 | 100 (26.6%) | 276 (73.4%) |
| 6 to 18 Years | 40 (3.5%) | 1,119 (99.4%) |
| 19 to 25 Years | 24 (6.2%) | 306 (79.3%) |
| 25 to 34 Years | 15 (1.6%) | 832 (90.0%) |
| 35 to 44 Years | 79 (9.5%) | 772 (93.1%) |
| 45 to 54 Years | 87 (8.7%) | 845 (85.0%) |
| 55 to 64 Years | 134 (14.6%) | 712 (77.8%) |
| 65 to 74 Years | 668 (99.0%) | 345 (51.1%) |
| 75 Years and over | 458 (100.0%) | 229 (50.0%) |
| Total | 1,605 (24.0%) | 5,436 (81.3%) |
Disability Status by Sex by Age in Satsuma
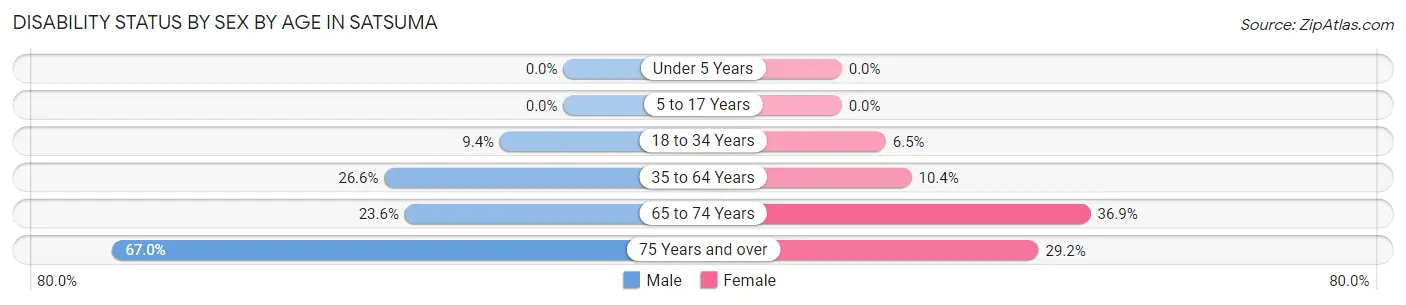
| Age Bracket | Male | Female |
| Under 5 Years | 0 (0.0%) | 0 (0.0%) |
| 5 to 17 Years | 0 (0.0%) | 0 (0.0%) |
| 18 to 34 Years | 59 (9.4%) | 48 (6.5%) |
| 35 to 64 Years | 423 (26.6%) | 119 (10.4%) |
| 65 to 74 Years | 85 (23.5%) | 116 (36.9%) |
| 75 Years and over | 160 (66.9%) | 64 (29.2%) |
Disability Class by Sex by Age in Satsuma
Disability Class: Hearing Difficulty
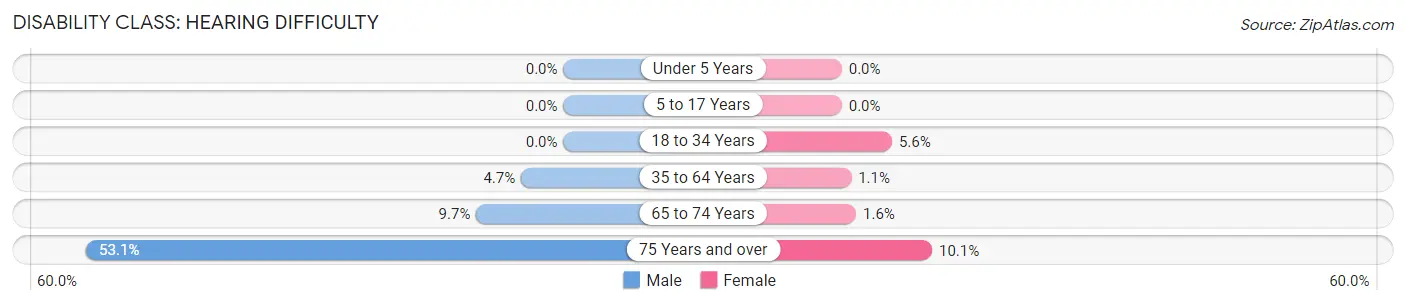
| Age Bracket | Male | Female |
| Under 5 Years | 0 (0.0%) | 0 (0.0%) |
| 5 to 17 Years | 0 (0.0%) | 0 (0.0%) |
| 18 to 34 Years | 0 (0.0%) | 41 (5.6%) |
| 35 to 64 Years | 75 (4.7%) | 12 (1.1%) |
| 65 to 74 Years | 35 (9.7%) | 5 (1.6%) |
| 75 Years and over | 127 (53.1%) | 22 (10.1%) |
Disability Class: Vision Difficulty
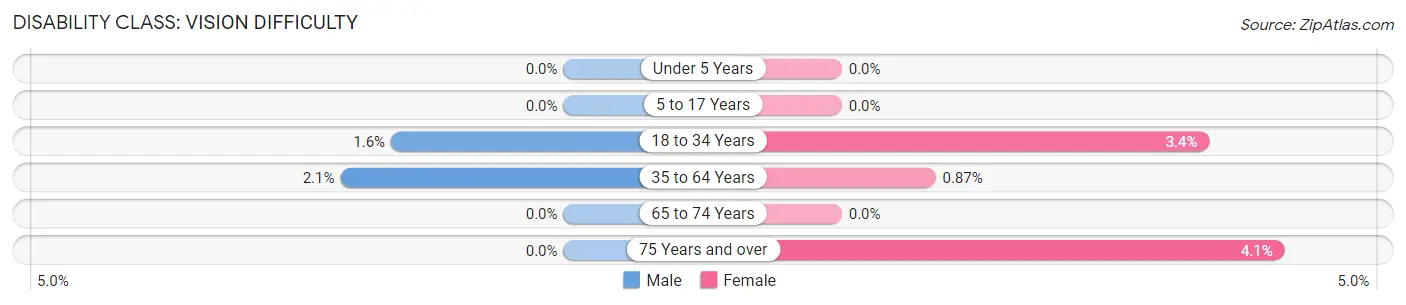
| Age Bracket | Male | Female |
| Under 5 Years | 0 (0.0%) | 0 (0.0%) |
| 5 to 17 Years | 0 (0.0%) | 0 (0.0%) |
| 18 to 34 Years | 10 (1.6%) | 25 (3.4%) |
| 35 to 64 Years | 33 (2.1%) | 10 (0.9%) |
| 65 to 74 Years | 0 (0.0%) | 0 (0.0%) |
| 75 Years and over | 0 (0.0%) | 9 (4.1%) |
Disability Class: Cognitive Difficulty
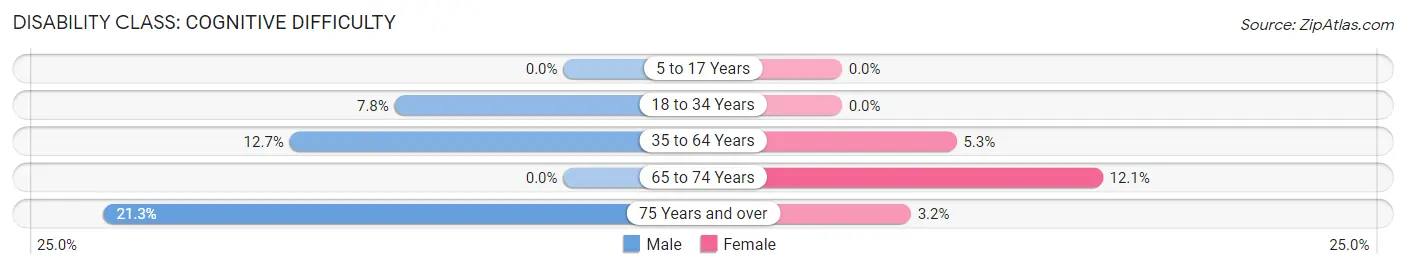
| Age Bracket | Male | Female |
| 5 to 17 Years | 0 (0.0%) | 0 (0.0%) |
| 18 to 34 Years | 49 (7.8%) | 0 (0.0%) |
| 35 to 64 Years | 202 (12.7%) | 61 (5.3%) |
| 65 to 74 Years | 0 (0.0%) | 38 (12.1%) |
| 75 Years and over | 51 (21.3%) | 7 (3.2%) |
Disability Class: Ambulatory Difficulty
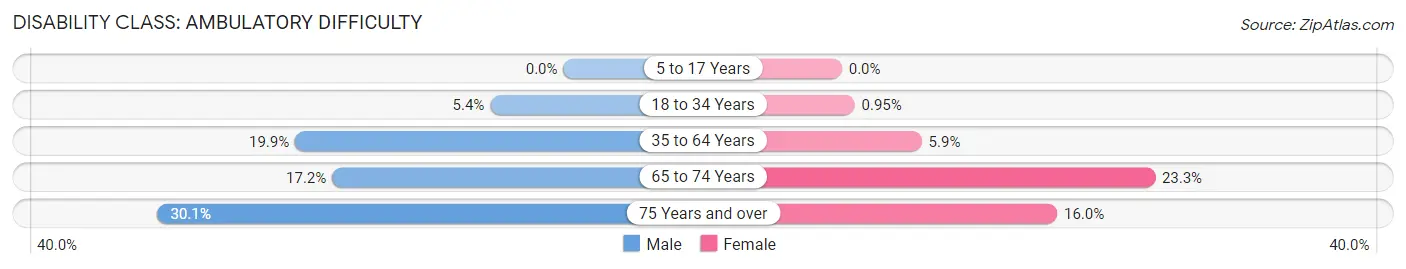
| Age Bracket | Male | Female |
| 5 to 17 Years | 0 (0.0%) | 0 (0.0%) |
| 18 to 34 Years | 34 (5.4%) | 7 (0.9%) |
| 35 to 64 Years | 317 (19.9%) | 68 (5.9%) |
| 65 to 74 Years | 62 (17.2%) | 73 (23.3%) |
| 75 Years and over | 72 (30.1%) | 35 (16.0%) |
Disability Class: Self-Care Difficulty
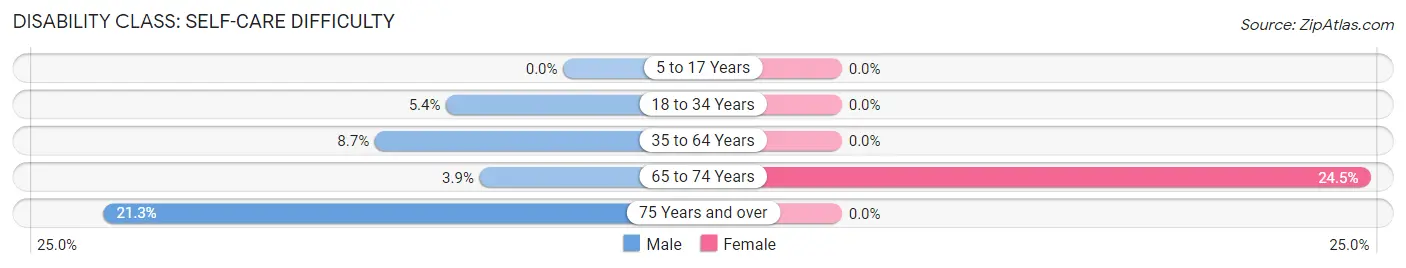
| Age Bracket | Male | Female |
| 5 to 17 Years | 0 (0.0%) | 0 (0.0%) |
| 18 to 34 Years | 34 (5.4%) | 0 (0.0%) |
| 35 to 64 Years | 139 (8.7%) | 0 (0.0%) |
| 65 to 74 Years | 14 (3.9%) | 77 (24.5%) |
| 75 Years and over | 51 (21.3%) | 0 (0.0%) |
Technology Access in Satsuma
Computing Device Access in Satsuma
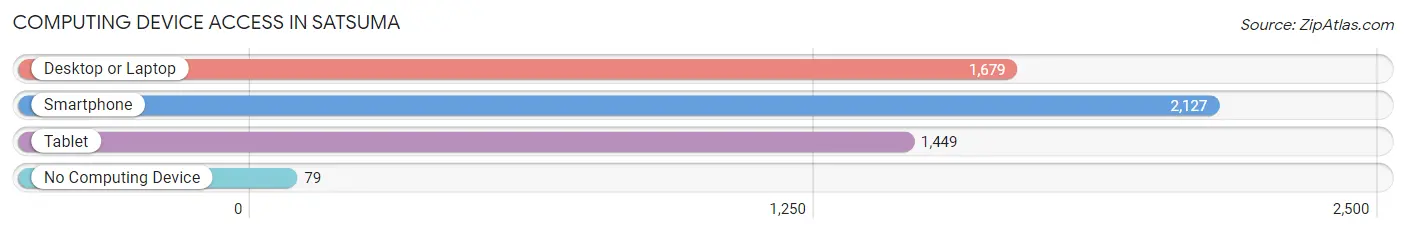
| Device Type | # Households | % Households |
| Desktop or Laptop | 1,679 | 70.1% |
| Smartphone | 2,127 | 88.8% |
| Tablet | 1,449 | 60.5% |
| No Computing Device | 79 | 3.3% |
| Total | 2,395 | 100.0% |
Internet Access in Satsuma
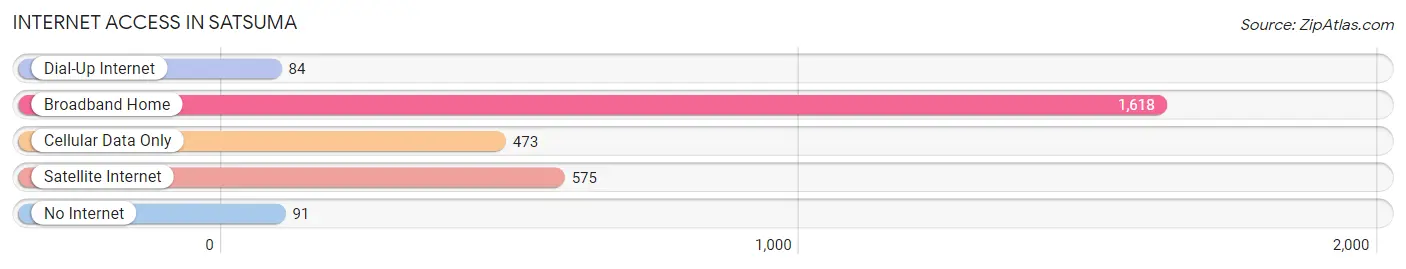
| Internet Type | # Households | % Households |
| Dial-Up Internet | 84 | 3.5% |
| Broadband Home | 1,618 | 67.6% |
| Cellular Data Only | 473 | 19.8% |
| Satellite Internet | 575 | 24.0% |
| No Internet | 91 | 3.8% |
| Total | 2,395 | 100.0% |
Satsuma Summary
Satsuma, Alabama is a small city located in Mobile County, Alabama. It is located approximately 15 miles north of Mobile and is part of the Mobile metropolitan area. The city has a population of approximately 11,000 people and is known for its rural charm and small-town atmosphere.
History
Satsuma was founded in 1887 by the Satsuma Land Company, which was formed by a group of investors from Mobile. The town was named after the Japanese city of Satsuma, which was the birthplace of the company’s president, John T. Williams. The town was originally intended to be a resort community, but it quickly developed into a residential community.
The town was incorporated in 1901 and quickly grew in population. By 1910, the population had grown to 1,000 people. The town was known for its citrus industry, which was the main source of income for many of the town’s residents.
Geography
Satsuma is located in Mobile County, Alabama. It is located approximately 15 miles north of Mobile and is part of the Mobile metropolitan area. The city has a total area of 8.2 square miles, all of which is land. The city is located on the banks of the Mobile River and is surrounded by forests and wetlands.
Economy
The economy of Satsuma is largely based on agriculture and manufacturing. The city is home to several large agricultural operations, including a citrus farm and a poultry farm. The city is also home to several manufacturing companies, including a paper mill and a furniture factory.
The city is also home to several retail stores, restaurants, and other businesses. The city is also home to a number of small businesses, including a local newspaper and a radio station.
Demographics
As of the 2010 census, the population of Satsuma was 11,000 people. The racial makeup of the city was 79.3% White, 17.2% African American, 0.3% Native American, 0.7% Asian, 0.1% Pacific Islander, and 2.4% from other races. Hispanic or Latino of any race were 2.7% of the population.
The median income for a household in the city was $37,917, and the median income for a family was $45,938. The per capita income for the city was $19,945. About 11.3% of families and 14.2% of the population were below the poverty line, including 19.2% of those under age 18 and 8.2% of those age 65 or over.
Satsuma is a small city with a rural charm and a small-town atmosphere. The city is home to a variety of businesses and industries, and it is a great place to live and work. The city is also home to a diverse population, with a variety of racial and ethnic backgrounds.
Common Questions
What is Per Capita Income in Satsuma?
Per Capita income in Satsuma is $38,181.
What is the Median Family Income in Satsuma?
Median Family Income in Satsuma is $100,132.
What is the Median Household income in Satsuma?
Median Household Income in Satsuma is $87,974.
What is Income or Wage Gap in Satsuma?
Income or Wage Gap in Satsuma is 49.2%.
Women in Satsuma earn 50.8 cents for every dollar earned by a man.
What is Inequality or Gini Index in Satsuma?
Inequality or Gini Index in Satsuma is 0.38.
What is the Total Population of Satsuma?
Total Population of Satsuma is 6,740.
What is the Total Male Population of Satsuma?
Total Male Population of Satsuma is 3,787.
What is the Total Female Population of Satsuma?
Total Female Population of Satsuma is 2,953.
What is the Ratio of Males per 100 Females in Satsuma?
There are 128.24 Males per 100 Females in Satsuma.
What is the Ratio of Females per 100 Males in Satsuma?
There are 77.98 Females per 100 Males in Satsuma.
What is the Median Population Age in Satsuma?
Median Population Age in Satsuma is 40.0 Years.
What is the Average Family Size in Satsuma
Average Family Size in Satsuma is 3.1 People.
What is the Average Household Size in Satsuma
Average Household Size in Satsuma is 2.8 People.
How Large is the Labor Force in Satsuma?
There are 3,327 People in the Labor Forcein in Satsuma.
What is the Percentage of People in the Labor Force in Satsuma?
62.3% of People are in the Labor Force in Satsuma.
What is the Unemployment Rate in Satsuma?
Unemployment Rate in Satsuma is 5.9%.