Zimbabwean vs Immigrants from Chile 2 or more Vehicles in Household
COMPARE
Zimbabwean
Immigrants from Chile
2 or more Vehicles in Household
2 or more Vehicles in Household Comparison
Zimbabweans
Immigrants from Chile
57.2%
2 OR MORE VEHICLES IN HOUSEHOLD
96.9/ 100
METRIC RATING
113th/ 347
METRIC RANK
54.2%
2 OR MORE VEHICLES IN HOUSEHOLD
11.1/ 100
METRIC RATING
212th/ 347
METRIC RANK
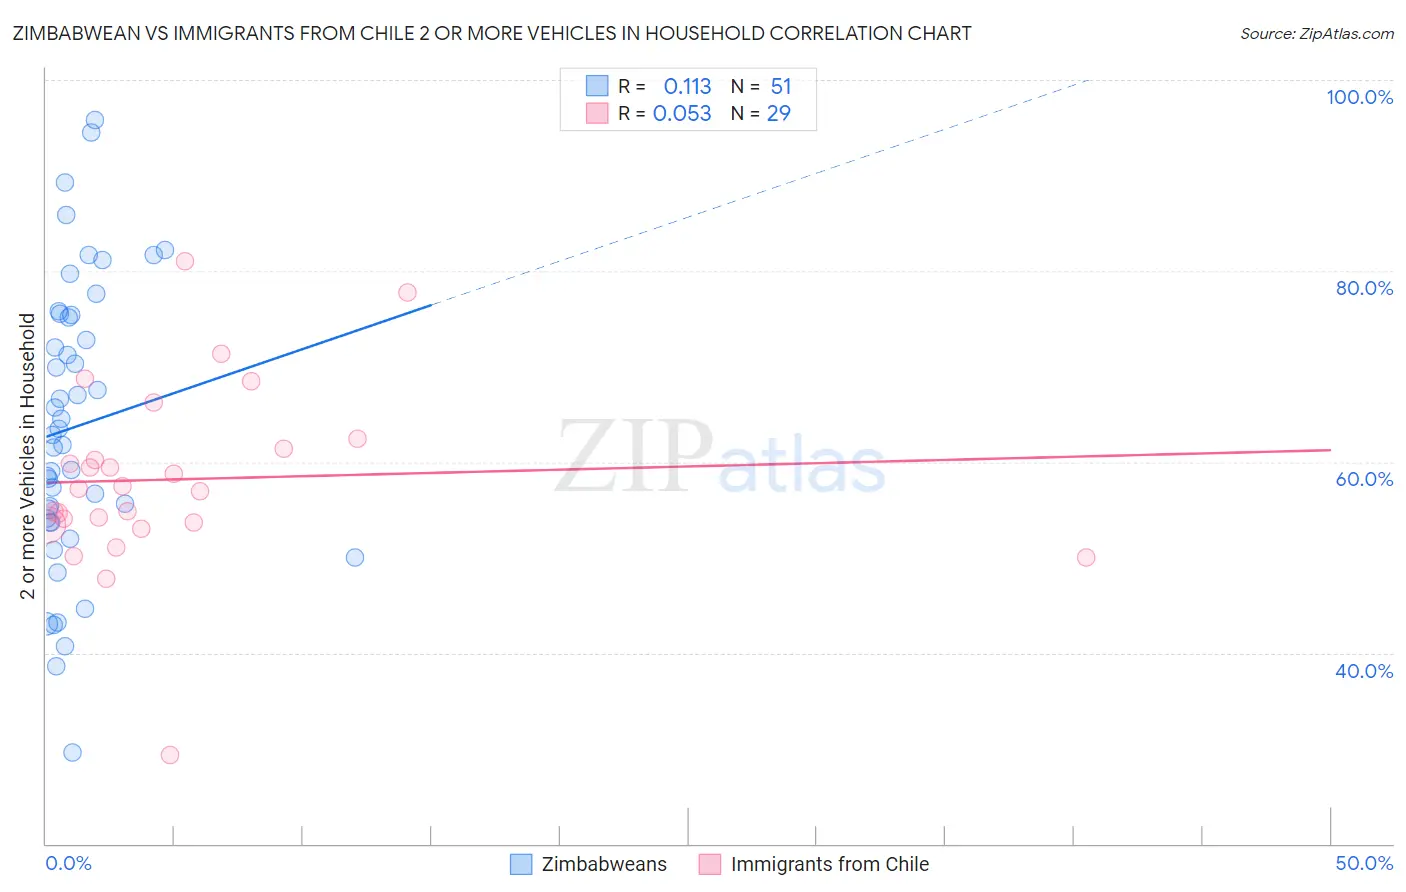
Zimbabwean vs Immigrants from Chile 2 or more Vehicles in Household Correlation Chart
The statistical analysis conducted on geographies consisting of 69,192,017 people shows a poor positive correlation between the proportion of Zimbabweans and percentage of households with 2 or more vehicles available in the United States with a correlation coefficient (R) of 0.113 and weighted average of 57.2%. Similarly, the statistical analysis conducted on geographies consisting of 218,607,451 people shows a slight positive correlation between the proportion of Immigrants from Chile and percentage of households with 2 or more vehicles available in the United States with a correlation coefficient (R) of 0.053 and weighted average of 54.2%, a difference of 5.6%.
2 or more Vehicles in Household Correlation Summary
| Measurement | Zimbabwean | Immigrants from Chile |
| Minimum | 29.5% | 29.3% |
| Maximum | 95.8% | 81.0% |
| Range | 66.3% | 51.7% |
| Mean | 63.7% | 58.2% |
| Median | 62.9% | 57.2% |
| Interquartile 25% (IQ1) | 53.7% | 53.5% |
| Interquartile 75% (IQ3) | 75.3% | 61.9% |
| Interquartile Range (IQR) | 21.6% | 8.4% |
| Standard Deviation (Sample) | 14.9% | 9.8% |
| Standard Deviation (Population) | 14.8% | 9.6% |
Similar Demographics by 2 or more Vehicles in Household
Demographics Similar to Zimbabweans by 2 or more Vehicles in Household
In terms of 2 or more vehicles in household, the demographic groups most similar to Zimbabweans are Immigrants from Lebanon (57.2%, a difference of 0.030%), Chippewa (57.2%, a difference of 0.090%), Immigrants from Jordan (57.2%, a difference of 0.10%), Iraqi (57.1%, a difference of 0.29%), and Greek (57.5%, a difference of 0.42%).
| Demographics | Rating | Rank | 2 or more Vehicles in Household |
| Immigrants | Oceania | 98.2 /100 | #106 | Exceptional 57.5% |
| Immigrants | Netherlands | 98.2 /100 | #107 | Exceptional 57.5% |
| Immigrants | Canada | 98.1 /100 | #108 | Exceptional 57.5% |
| Immigrants | North America | 98.1 /100 | #109 | Exceptional 57.5% |
| Japanese | 98.0 /100 | #110 | Exceptional 57.5% |
| Greeks | 98.0 /100 | #111 | Exceptional 57.5% |
| Pueblo | 98.0 /100 | #112 | Exceptional 57.5% |
| Zimbabweans | 96.9 /100 | #113 | Exceptional 57.2% |
| Immigrants | Lebanon | 96.8 /100 | #114 | Exceptional 57.2% |
| Chippewa | 96.6 /100 | #115 | Exceptional 57.2% |
| Immigrants | Jordan | 96.6 /100 | #116 | Exceptional 57.2% |
| Iraqis | 95.8 /100 | #117 | Exceptional 57.1% |
| Asians | 95.1 /100 | #118 | Exceptional 57.0% |
| Natives/Alaskans | 95.0 /100 | #119 | Exceptional 57.0% |
| Costa Ricans | 94.7 /100 | #120 | Exceptional 56.9% |
Demographics Similar to Immigrants from Chile by 2 or more Vehicles in Household
In terms of 2 or more vehicles in household, the demographic groups most similar to Immigrants from Chile are Immigrants from Hungary (54.2%, a difference of 0.020%), Immigrants from Saudi Arabia (54.2%, a difference of 0.030%), Egyptian (54.3%, a difference of 0.090%), Immigrants from Bulgaria (54.3%, a difference of 0.090%), and Guatemalan (54.1%, a difference of 0.16%).
| Demographics | Rating | Rank | 2 or more Vehicles in Household |
| Cheyenne | 13.6 /100 | #205 | Poor 54.3% |
| Immigrants | Latin America | 13.1 /100 | #206 | Poor 54.3% |
| Turks | 13.0 /100 | #207 | Poor 54.3% |
| Egyptians | 12.0 /100 | #208 | Poor 54.3% |
| Immigrants | Bulgaria | 12.0 /100 | #209 | Poor 54.3% |
| Immigrants | Saudi Arabia | 11.3 /100 | #210 | Poor 54.2% |
| Immigrants | Hungary | 11.3 /100 | #211 | Poor 54.2% |
| Immigrants | Chile | 11.1 /100 | #212 | Poor 54.2% |
| Guatemalans | 9.6 /100 | #213 | Tragic 54.1% |
| Immigrants | Czechoslovakia | 9.4 /100 | #214 | Tragic 54.1% |
| Aleuts | 9.3 /100 | #215 | Tragic 54.1% |
| Immigrants | Western Asia | 9.3 /100 | #216 | Tragic 54.1% |
| Immigrants | Burma/Myanmar | 7.1 /100 | #217 | Tragic 53.9% |
| Immigrants | Argentina | 6.8 /100 | #218 | Tragic 53.9% |
| South American Indians | 6.5 /100 | #219 | Tragic 53.9% |