Zimbabwean vs Immigrants from England 2 or more Vehicles in Household
COMPARE
Zimbabwean
Immigrants from England
2 or more Vehicles in Household
2 or more Vehicles in Household Comparison
Zimbabweans
Immigrants from England
57.2%
2 OR MORE VEHICLES IN HOUSEHOLD
96.9/ 100
METRIC RATING
113th/ 347
METRIC RANK
58.1%
2 OR MORE VEHICLES IN HOUSEHOLD
99.3/ 100
METRIC RATING
80th/ 347
METRIC RANK
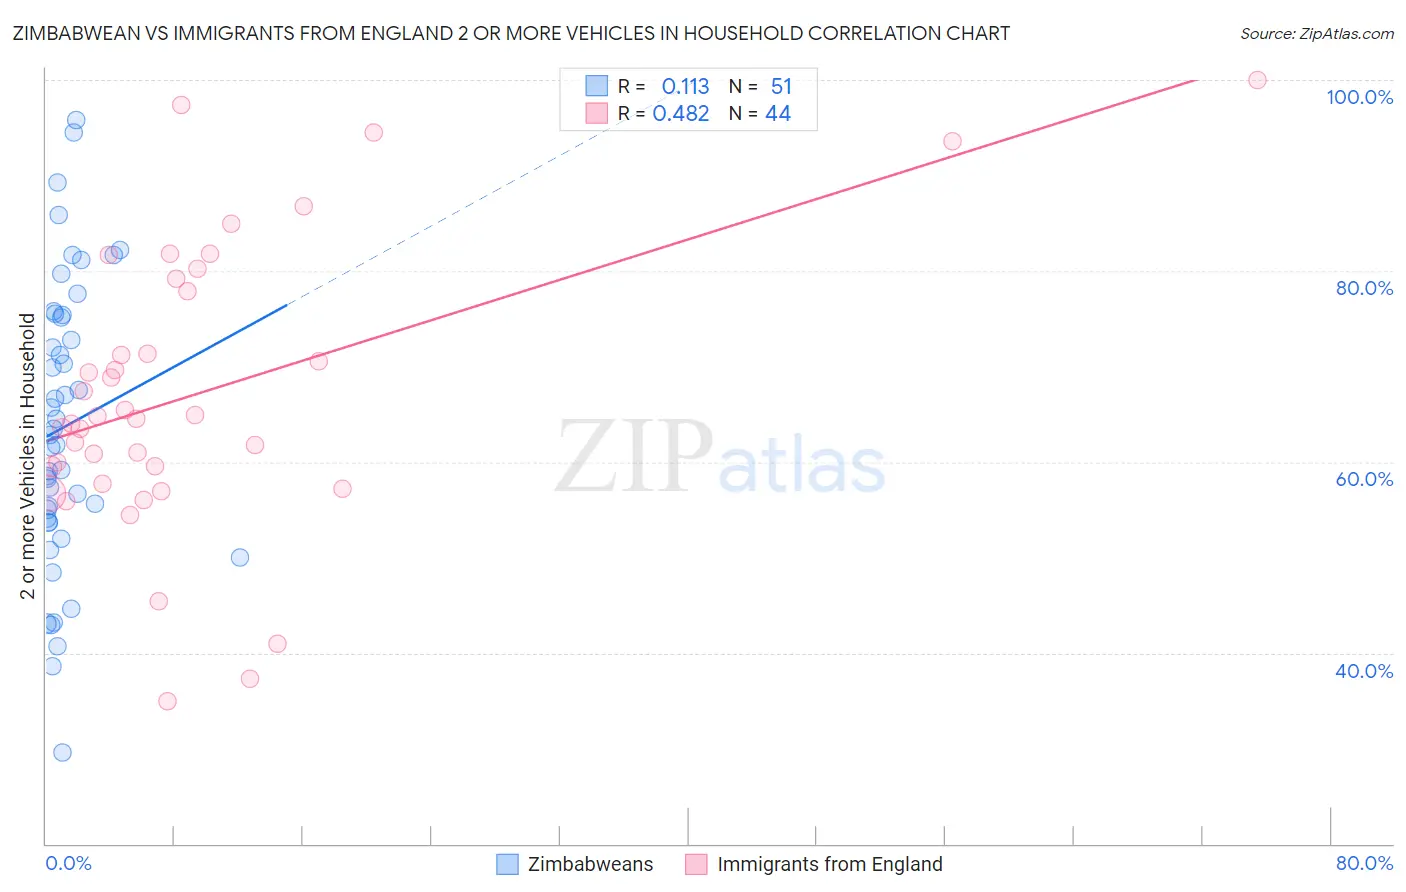
Zimbabwean vs Immigrants from England 2 or more Vehicles in Household Correlation Chart
The statistical analysis conducted on geographies consisting of 69,192,017 people shows a poor positive correlation between the proportion of Zimbabweans and percentage of households with 2 or more vehicles available in the United States with a correlation coefficient (R) of 0.113 and weighted average of 57.2%. Similarly, the statistical analysis conducted on geographies consisting of 391,775,119 people shows a moderate positive correlation between the proportion of Immigrants from England and percentage of households with 2 or more vehicles available in the United States with a correlation coefficient (R) of 0.482 and weighted average of 58.1%, a difference of 1.5%.
2 or more Vehicles in Household Correlation Summary
| Measurement | Zimbabwean | Immigrants from England |
| Minimum | 29.5% | 34.9% |
| Maximum | 95.8% | 100.0% |
| Range | 66.3% | 65.1% |
| Mean | 63.7% | 67.2% |
| Median | 62.9% | 64.7% |
| Interquartile 25% (IQ1) | 53.7% | 58.6% |
| Interquartile 75% (IQ3) | 75.3% | 78.6% |
| Interquartile Range (IQR) | 21.6% | 19.9% |
| Standard Deviation (Sample) | 14.9% | 14.9% |
| Standard Deviation (Population) | 14.8% | 14.7% |
Similar Demographics by 2 or more Vehicles in Household
Demographics Similar to Zimbabweans by 2 or more Vehicles in Household
In terms of 2 or more vehicles in household, the demographic groups most similar to Zimbabweans are Immigrants from Lebanon (57.2%, a difference of 0.030%), Chippewa (57.2%, a difference of 0.090%), Immigrants from Jordan (57.2%, a difference of 0.10%), Iraqi (57.1%, a difference of 0.29%), and Greek (57.5%, a difference of 0.42%).
| Demographics | Rating | Rank | 2 or more Vehicles in Household |
| Immigrants | Oceania | 98.2 /100 | #106 | Exceptional 57.5% |
| Immigrants | Netherlands | 98.2 /100 | #107 | Exceptional 57.5% |
| Immigrants | Canada | 98.1 /100 | #108 | Exceptional 57.5% |
| Immigrants | North America | 98.1 /100 | #109 | Exceptional 57.5% |
| Japanese | 98.0 /100 | #110 | Exceptional 57.5% |
| Greeks | 98.0 /100 | #111 | Exceptional 57.5% |
| Pueblo | 98.0 /100 | #112 | Exceptional 57.5% |
| Zimbabweans | 96.9 /100 | #113 | Exceptional 57.2% |
| Immigrants | Lebanon | 96.8 /100 | #114 | Exceptional 57.2% |
| Chippewa | 96.6 /100 | #115 | Exceptional 57.2% |
| Immigrants | Jordan | 96.6 /100 | #116 | Exceptional 57.2% |
| Iraqis | 95.8 /100 | #117 | Exceptional 57.1% |
| Asians | 95.1 /100 | #118 | Exceptional 57.0% |
| Natives/Alaskans | 95.0 /100 | #119 | Exceptional 57.0% |
| Costa Ricans | 94.7 /100 | #120 | Exceptional 56.9% |
Demographics Similar to Immigrants from England by 2 or more Vehicles in Household
In terms of 2 or more vehicles in household, the demographic groups most similar to Immigrants from England are Immigrants from Iraq (58.1%, a difference of 0.010%), Iranian (58.1%, a difference of 0.10%), Delaware (58.2%, a difference of 0.14%), Icelander (58.0%, a difference of 0.14%), and Maltese (58.0%, a difference of 0.17%).
| Demographics | Rating | Rank | 2 or more Vehicles in Household |
| Bolivians | 99.6 /100 | #73 | Exceptional 58.3% |
| Immigrants | Afghanistan | 99.6 /100 | #74 | Exceptional 58.3% |
| Poles | 99.5 /100 | #75 | Exceptional 58.3% |
| Creek | 99.5 /100 | #76 | Exceptional 58.3% |
| Slovenes | 99.5 /100 | #77 | Exceptional 58.3% |
| Lithuanians | 99.5 /100 | #78 | Exceptional 58.2% |
| Delaware | 99.4 /100 | #79 | Exceptional 58.2% |
| Immigrants | England | 99.3 /100 | #80 | Exceptional 58.1% |
| Immigrants | Iraq | 99.3 /100 | #81 | Exceptional 58.1% |
| Iranians | 99.3 /100 | #82 | Exceptional 58.1% |
| Icelanders | 99.2 /100 | #83 | Exceptional 58.0% |
| Maltese | 99.2 /100 | #84 | Exceptional 58.0% |
| Slovaks | 99.2 /100 | #85 | Exceptional 58.0% |
| Potawatomi | 99.1 /100 | #86 | Exceptional 58.0% |
| Thais | 99.1 /100 | #87 | Exceptional 57.9% |