Iroquois vs Immigrants from Chile 2 or more Vehicles in Household
COMPARE
Iroquois
Immigrants from Chile
2 or more Vehicles in Household
2 or more Vehicles in Household Comparison
Iroquois
Immigrants from Chile
54.7%
2 OR MORE VEHICLES IN HOUSEHOLD
22.6/ 100
METRIC RATING
195th/ 347
METRIC RANK
54.2%
2 OR MORE VEHICLES IN HOUSEHOLD
11.1/ 100
METRIC RATING
212th/ 347
METRIC RANK
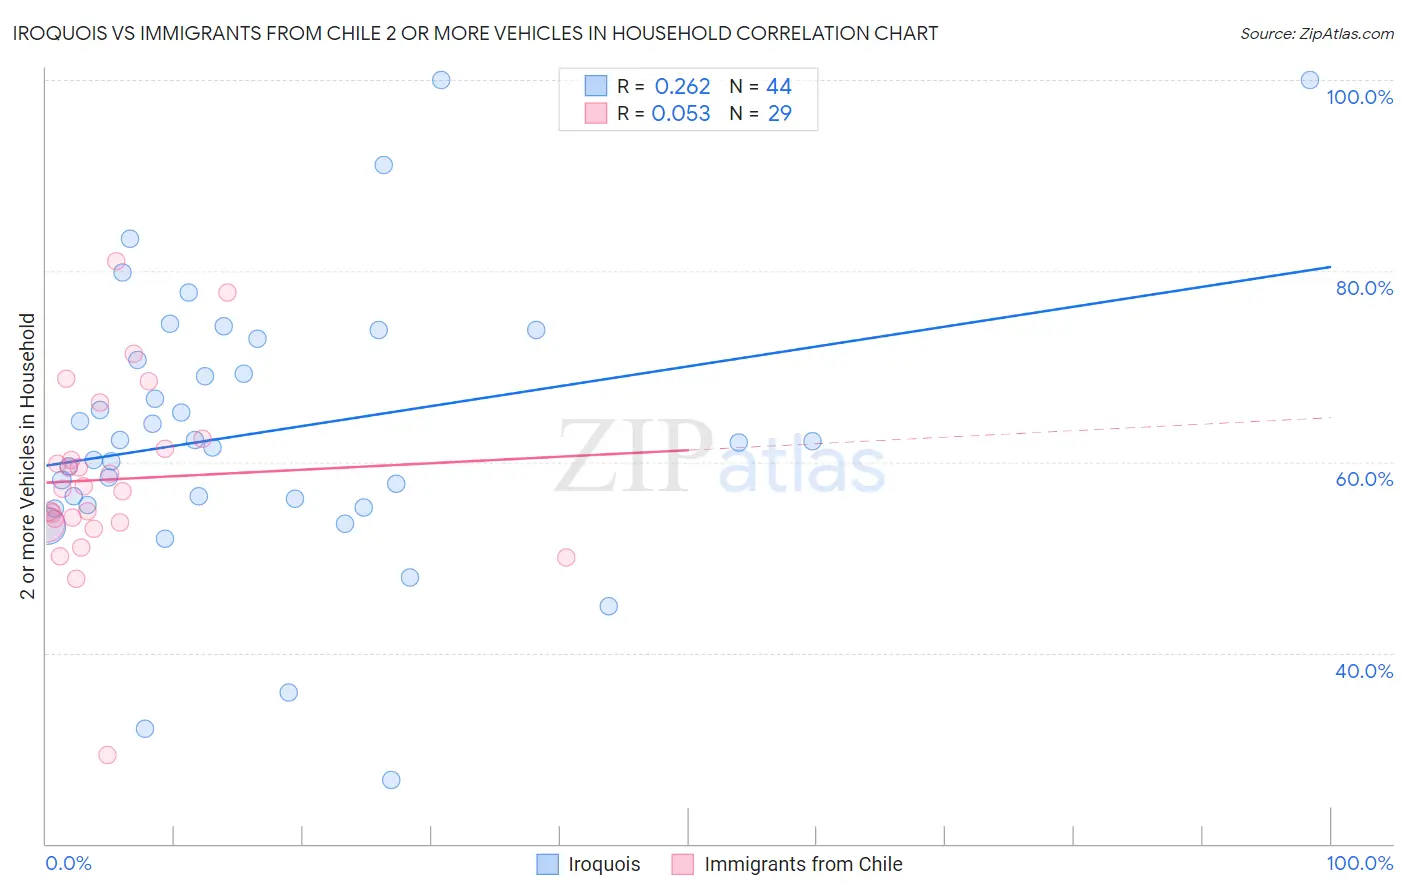
Iroquois vs Immigrants from Chile 2 or more Vehicles in Household Correlation Chart
The statistical analysis conducted on geographies consisting of 207,258,342 people shows a weak positive correlation between the proportion of Iroquois and percentage of households with 2 or more vehicles available in the United States with a correlation coefficient (R) of 0.262 and weighted average of 54.7%. Similarly, the statistical analysis conducted on geographies consisting of 218,607,451 people shows a slight positive correlation between the proportion of Immigrants from Chile and percentage of households with 2 or more vehicles available in the United States with a correlation coefficient (R) of 0.053 and weighted average of 54.2%, a difference of 0.86%.
2 or more Vehicles in Household Correlation Summary
| Measurement | Iroquois | Immigrants from Chile |
| Minimum | 26.7% | 29.3% |
| Maximum | 100.0% | 81.0% |
| Range | 73.3% | 51.7% |
| Mean | 63.2% | 58.2% |
| Median | 62.1% | 57.2% |
| Interquartile 25% (IQ1) | 55.8% | 53.5% |
| Interquartile 75% (IQ3) | 71.8% | 61.9% |
| Interquartile Range (IQR) | 16.0% | 8.4% |
| Standard Deviation (Sample) | 14.9% | 9.8% |
| Standard Deviation (Population) | 14.7% | 9.6% |
Demographics Similar to Iroquois and Immigrants from Chile by 2 or more Vehicles in Household
In terms of 2 or more vehicles in household, the demographic groups most similar to Iroquois are Central American (54.7%, a difference of 0.030%), Immigrants from Japan (54.7%, a difference of 0.050%), Immigrants from Poland (54.6%, a difference of 0.20%), Argentinean (54.5%, a difference of 0.32%), and Carpatho Rusyn (54.4%, a difference of 0.41%). Similarly, the demographic groups most similar to Immigrants from Chile are Immigrants from Hungary (54.2%, a difference of 0.020%), Immigrants from Saudi Arabia (54.2%, a difference of 0.030%), Egyptian (54.3%, a difference of 0.090%), Immigrants from Bulgaria (54.3%, a difference of 0.090%), and Guatemalan (54.1%, a difference of 0.16%).
| Demographics | Rating | Rank | 2 or more Vehicles in Household |
| Immigrants | Japan | 23.4 /100 | #193 | Fair 54.7% |
| Central Americans | 23.0 /100 | #194 | Fair 54.7% |
| Iroquois | 22.6 /100 | #195 | Fair 54.7% |
| Immigrants | Poland | 19.3 /100 | #196 | Poor 54.6% |
| Argentineans | 17.5 /100 | #197 | Poor 54.5% |
| Carpatho Rusyns | 16.2 /100 | #198 | Poor 54.4% |
| Immigrants | Norway | 15.9 /100 | #199 | Poor 54.4% |
| Houma | 15.8 /100 | #200 | Poor 54.4% |
| Immigrants | Italy | 15.5 /100 | #201 | Poor 54.4% |
| Immigrants | North Macedonia | 14.9 /100 | #202 | Poor 54.4% |
| Immigrants | Peru | 14.3 /100 | #203 | Poor 54.4% |
| Immigrants | Belgium | 13.7 /100 | #204 | Poor 54.3% |
| Cheyenne | 13.6 /100 | #205 | Poor 54.3% |
| Immigrants | Latin America | 13.1 /100 | #206 | Poor 54.3% |
| Turks | 13.0 /100 | #207 | Poor 54.3% |
| Egyptians | 12.0 /100 | #208 | Poor 54.3% |
| Immigrants | Bulgaria | 12.0 /100 | #209 | Poor 54.3% |
| Immigrants | Saudi Arabia | 11.3 /100 | #210 | Poor 54.2% |
| Immigrants | Hungary | 11.3 /100 | #211 | Poor 54.2% |
| Immigrants | Chile | 11.1 /100 | #212 | Poor 54.2% |
| Guatemalans | 9.6 /100 | #213 | Tragic 54.1% |