West Indian vs German Russian 3 or more Vehicles in Household
COMPARE
West Indian
German Russian
3 or more Vehicles in Household
3 or more Vehicles in Household Comparison
West Indians
German Russians
13.7%
3 OR MORE VEHICLES IN HOUSEHOLD
0.0/ 100
METRIC RATING
330th/ 347
METRIC RANK
20.5%
3 OR MORE VEHICLES IN HOUSEHOLD
93.7/ 100
METRIC RATING
122nd/ 347
METRIC RANK
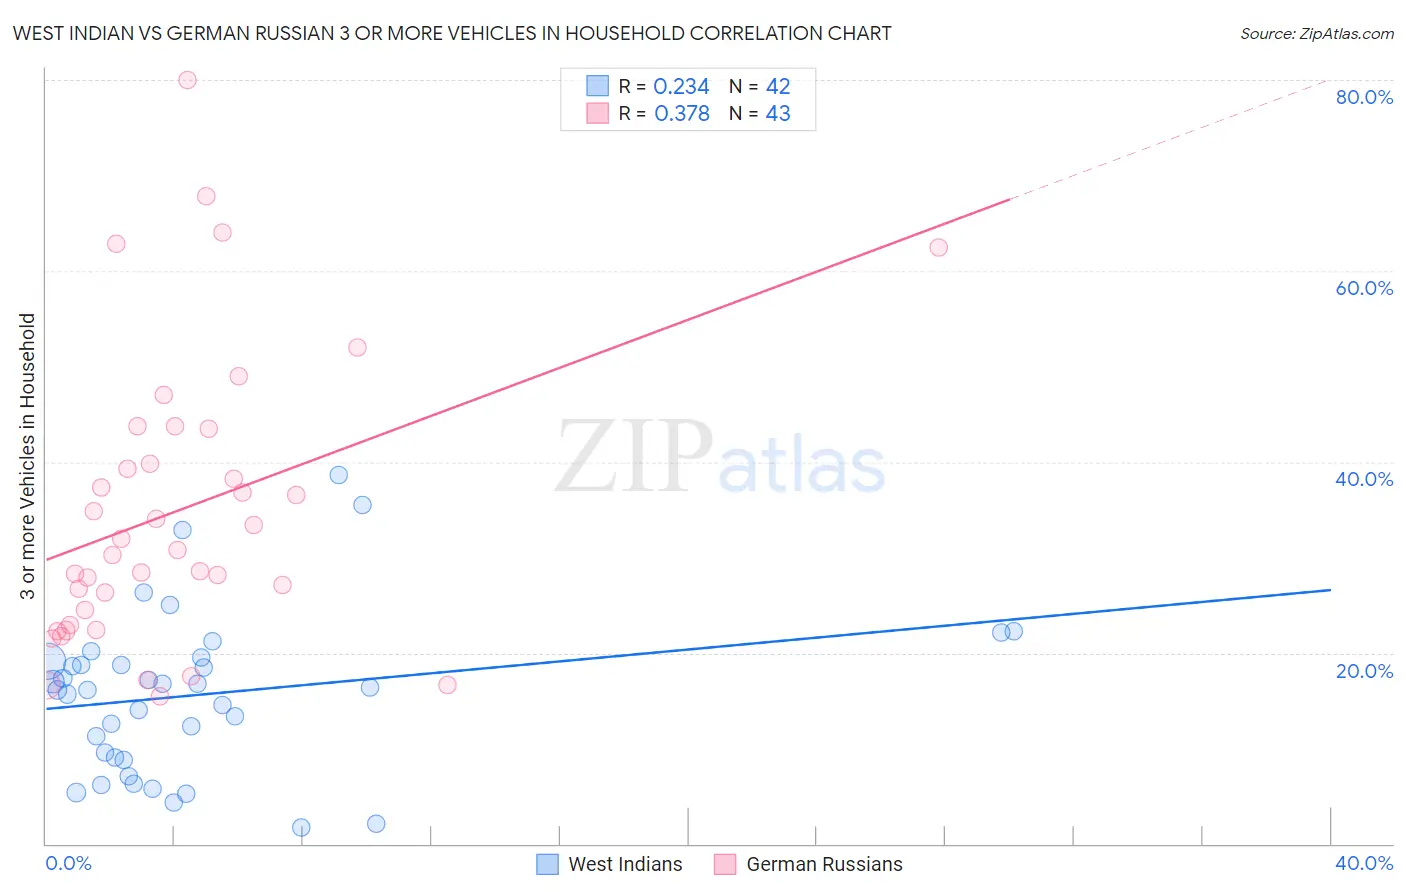
West Indian vs German Russian 3 or more Vehicles in Household Correlation Chart
The statistical analysis conducted on geographies consisting of 253,795,615 people shows a weak positive correlation between the proportion of West Indians and percentage of households with 3 or more vehicles available in the United States with a correlation coefficient (R) of 0.234 and weighted average of 13.7%. Similarly, the statistical analysis conducted on geographies consisting of 96,442,653 people shows a mild positive correlation between the proportion of German Russians and percentage of households with 3 or more vehicles available in the United States with a correlation coefficient (R) of 0.378 and weighted average of 20.5%, a difference of 49.1%.
3 or more Vehicles in Household Correlation Summary
| Measurement | West Indian | German Russian |
| Minimum | 1.7% | 15.4% |
| Maximum | 38.7% | 80.0% |
| Range | 37.0% | 64.6% |
| Mean | 15.6% | 34.9% |
| Median | 16.3% | 30.8% |
| Interquartile 25% (IQ1) | 9.0% | 22.9% |
| Interquartile 75% (IQ3) | 19.1% | 43.5% |
| Interquartile Range (IQR) | 10.1% | 20.5% |
| Standard Deviation (Sample) | 8.4% | 15.2% |
| Standard Deviation (Population) | 8.3% | 15.0% |
Similar Demographics by 3 or more Vehicles in Household
Demographics Similar to West Indians by 3 or more Vehicles in Household
In terms of 3 or more vehicles in household, the demographic groups most similar to West Indians are Immigrants from Dominica (13.7%, a difference of 0.21%), Immigrants from Senegal (13.8%, a difference of 0.33%), Trinidadian and Tobagonian (13.6%, a difference of 0.93%), Immigrants from Cabo Verde (13.6%, a difference of 1.3%), and Immigrants from Albania (14.0%, a difference of 1.5%).
| Demographics | Rating | Rank | 3 or more Vehicles in Household |
| Immigrants | Caribbean | 0.0 /100 | #323 | Tragic 14.6% |
| Immigrants | Yemen | 0.0 /100 | #324 | Tragic 14.2% |
| Senegalese | 0.0 /100 | #325 | Tragic 14.2% |
| Soviet Union | 0.0 /100 | #326 | Tragic 14.2% |
| Ecuadorians | 0.0 /100 | #327 | Tragic 14.1% |
| Immigrants | Albania | 0.0 /100 | #328 | Tragic 14.0% |
| Immigrants | Senegal | 0.0 /100 | #329 | Tragic 13.8% |
| West Indians | 0.0 /100 | #330 | Tragic 13.7% |
| Immigrants | Dominica | 0.0 /100 | #331 | Tragic 13.7% |
| Trinidadians and Tobagonians | 0.0 /100 | #332 | Tragic 13.6% |
| Immigrants | Cabo Verde | 0.0 /100 | #333 | Tragic 13.6% |
| Immigrants | Ecuador | 0.0 /100 | #334 | Tragic 13.4% |
| Immigrants | Trinidad and Tobago | 0.0 /100 | #335 | Tragic 13.3% |
| Barbadians | 0.0 /100 | #336 | Tragic 12.6% |
| Immigrants | Bangladesh | 0.0 /100 | #337 | Tragic 12.5% |
Demographics Similar to German Russians by 3 or more Vehicles in Household
In terms of 3 or more vehicles in household, the demographic groups most similar to German Russians are Immigrants from Korea (20.5%, a difference of 0.010%), Immigrants from Thailand (20.5%, a difference of 0.040%), Maltese (20.5%, a difference of 0.060%), Central American (20.5%, a difference of 0.18%), and Immigrants from Netherlands (20.4%, a difference of 0.21%).
| Demographics | Rating | Rank | 3 or more Vehicles in Household |
| French Canadians | 95.0 /100 | #115 | Exceptional 20.6% |
| Italians | 94.9 /100 | #116 | Exceptional 20.6% |
| Croatians | 94.9 /100 | #117 | Exceptional 20.6% |
| Costa Ricans | 94.6 /100 | #118 | Exceptional 20.6% |
| Immigrants | Latin America | 94.5 /100 | #119 | Exceptional 20.5% |
| Maltese | 93.9 /100 | #120 | Exceptional 20.5% |
| Immigrants | Thailand | 93.8 /100 | #121 | Exceptional 20.5% |
| German Russians | 93.7 /100 | #122 | Exceptional 20.5% |
| Immigrants | Korea | 93.7 /100 | #123 | Exceptional 20.5% |
| Central Americans | 93.1 /100 | #124 | Exceptional 20.5% |
| Immigrants | Netherlands | 92.9 /100 | #125 | Exceptional 20.4% |
| Slavs | 92.1 /100 | #126 | Exceptional 20.4% |
| Immigrants | Bolivia | 92.0 /100 | #127 | Exceptional 20.4% |
| New Zealanders | 91.3 /100 | #128 | Exceptional 20.4% |
| Zimbabweans | 88.7 /100 | #129 | Excellent 20.3% |