Immigrants from England vs Immigrants from Italy 3 or more Vehicles in Household
COMPARE
Immigrants from England
Immigrants from Italy
3 or more Vehicles in Household
3 or more Vehicles in Household Comparison
Immigrants from England
Immigrants from Italy
20.7%
3 OR MORE VEHICLES IN HOUSEHOLD
96.2/ 100
METRIC RATING
113th/ 347
METRIC RANK
18.7%
3 OR MORE VEHICLES IN HOUSEHOLD
10.2/ 100
METRIC RATING
217th/ 347
METRIC RANK
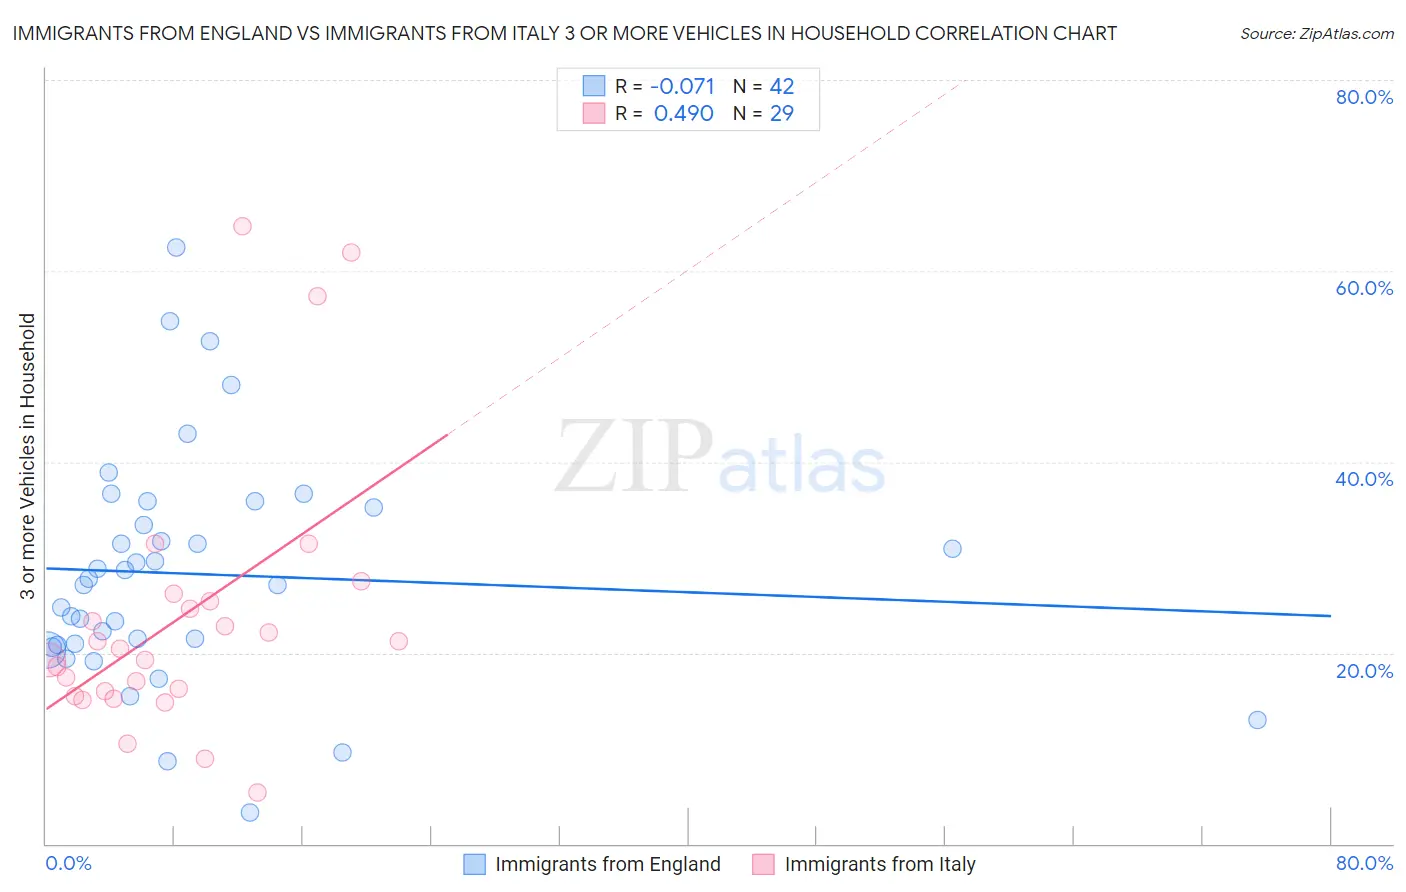
Immigrants from England vs Immigrants from Italy 3 or more Vehicles in Household Correlation Chart
The statistical analysis conducted on geographies consisting of 391,649,997 people shows a slight negative correlation between the proportion of Immigrants from England and percentage of households with 3 or more vehicles available in the United States with a correlation coefficient (R) of -0.071 and weighted average of 20.7%. Similarly, the statistical analysis conducted on geographies consisting of 324,064,061 people shows a moderate positive correlation between the proportion of Immigrants from Italy and percentage of households with 3 or more vehicles available in the United States with a correlation coefficient (R) of 0.490 and weighted average of 18.7%, a difference of 10.6%.
3 or more Vehicles in Household Correlation Summary
| Measurement | Immigrants from England | Immigrants from Italy |
| Minimum | 3.3% | 5.4% |
| Maximum | 62.4% | 64.7% |
| Range | 59.1% | 59.3% |
| Mean | 28.2% | 23.8% |
| Median | 27.4% | 20.4% |
| Interquartile 25% (IQ1) | 20.8% | 15.7% |
| Interquartile 75% (IQ3) | 35.2% | 25.7% |
| Interquartile Range (IQR) | 14.4% | 10.0% |
| Standard Deviation (Sample) | 12.1% | 14.3% |
| Standard Deviation (Population) | 12.0% | 14.1% |
Similar Demographics by 3 or more Vehicles in Household
Demographics Similar to Immigrants from England by 3 or more Vehicles in Household
In terms of 3 or more vehicles in household, the demographic groups most similar to Immigrants from England are Nicaraguan (20.7%, a difference of 0.010%), Burmese (20.6%, a difference of 0.18%), Immigrants from Micronesia (20.7%, a difference of 0.30%), Asian (20.8%, a difference of 0.33%), and Filipino (20.8%, a difference of 0.47%).
| Demographics | Rating | Rank | 3 or more Vehicles in Household |
| Bolivians | 97.4 /100 | #106 | Exceptional 20.8% |
| Immigrants | Germany | 97.4 /100 | #107 | Exceptional 20.8% |
| Immigrants | Scotland | 97.1 /100 | #108 | Exceptional 20.8% |
| Filipinos | 97.0 /100 | #109 | Exceptional 20.8% |
| Asians | 96.8 /100 | #110 | Exceptional 20.8% |
| Immigrants | Micronesia | 96.7 /100 | #111 | Exceptional 20.7% |
| Nicaraguans | 96.2 /100 | #112 | Exceptional 20.7% |
| Immigrants | England | 96.2 /100 | #113 | Exceptional 20.7% |
| Burmese | 95.8 /100 | #114 | Exceptional 20.6% |
| French Canadians | 95.0 /100 | #115 | Exceptional 20.6% |
| Italians | 94.9 /100 | #116 | Exceptional 20.6% |
| Croatians | 94.9 /100 | #117 | Exceptional 20.6% |
| Costa Ricans | 94.6 /100 | #118 | Exceptional 20.6% |
| Immigrants | Latin America | 94.5 /100 | #119 | Exceptional 20.5% |
| Maltese | 93.9 /100 | #120 | Exceptional 20.5% |
Demographics Similar to Immigrants from Italy by 3 or more Vehicles in Household
In terms of 3 or more vehicles in household, the demographic groups most similar to Immigrants from Italy are Immigrants from Nigeria (18.7%, a difference of 0.020%), Eastern European (18.7%, a difference of 0.080%), Immigrants from Sierra Leone (18.7%, a difference of 0.13%), Panamanian (18.8%, a difference of 0.28%), and Immigrants from Cuba (18.8%, a difference of 0.28%).
| Demographics | Rating | Rank | 3 or more Vehicles in Household |
| Bulgarians | 13.1 /100 | #210 | Poor 18.8% |
| Immigrants | Kenya | 12.4 /100 | #211 | Poor 18.8% |
| Panamanians | 11.6 /100 | #212 | Poor 18.8% |
| Immigrants | Cuba | 11.6 /100 | #213 | Poor 18.8% |
| Immigrants | Sierra Leone | 10.8 /100 | #214 | Poor 18.7% |
| Eastern Europeans | 10.6 /100 | #215 | Poor 18.7% |
| Immigrants | Nigeria | 10.3 /100 | #216 | Poor 18.7% |
| Immigrants | Italy | 10.2 /100 | #217 | Poor 18.7% |
| Immigrants | Portugal | 8.9 /100 | #218 | Tragic 18.6% |
| Immigrants | Armenia | 8.6 /100 | #219 | Tragic 18.6% |
| Nigerians | 7.9 /100 | #220 | Tragic 18.6% |
| Immigrants | Poland | 7.5 /100 | #221 | Tragic 18.6% |
| Belizeans | 7.3 /100 | #222 | Tragic 18.6% |
| Immigrants | Czechoslovakia | 5.9 /100 | #223 | Tragic 18.5% |
| Immigrants | Argentina | 5.6 /100 | #224 | Tragic 18.5% |