Tongan vs Immigrants 2 or more Vehicles in Household
COMPARE
Tongan
Immigrants
2 or more Vehicles in Household
2 or more Vehicles in Household Comparison
Tongans
Immigrants
63.5%
2 OR MORE VEHICLES IN HOUSEHOLD
100.0/ 100
METRIC RATING
2nd/ 347
METRIC RANK
54.7%
2 OR MORE VEHICLES IN HOUSEHOLD
25.0/ 100
METRIC RATING
191st/ 347
METRIC RANK
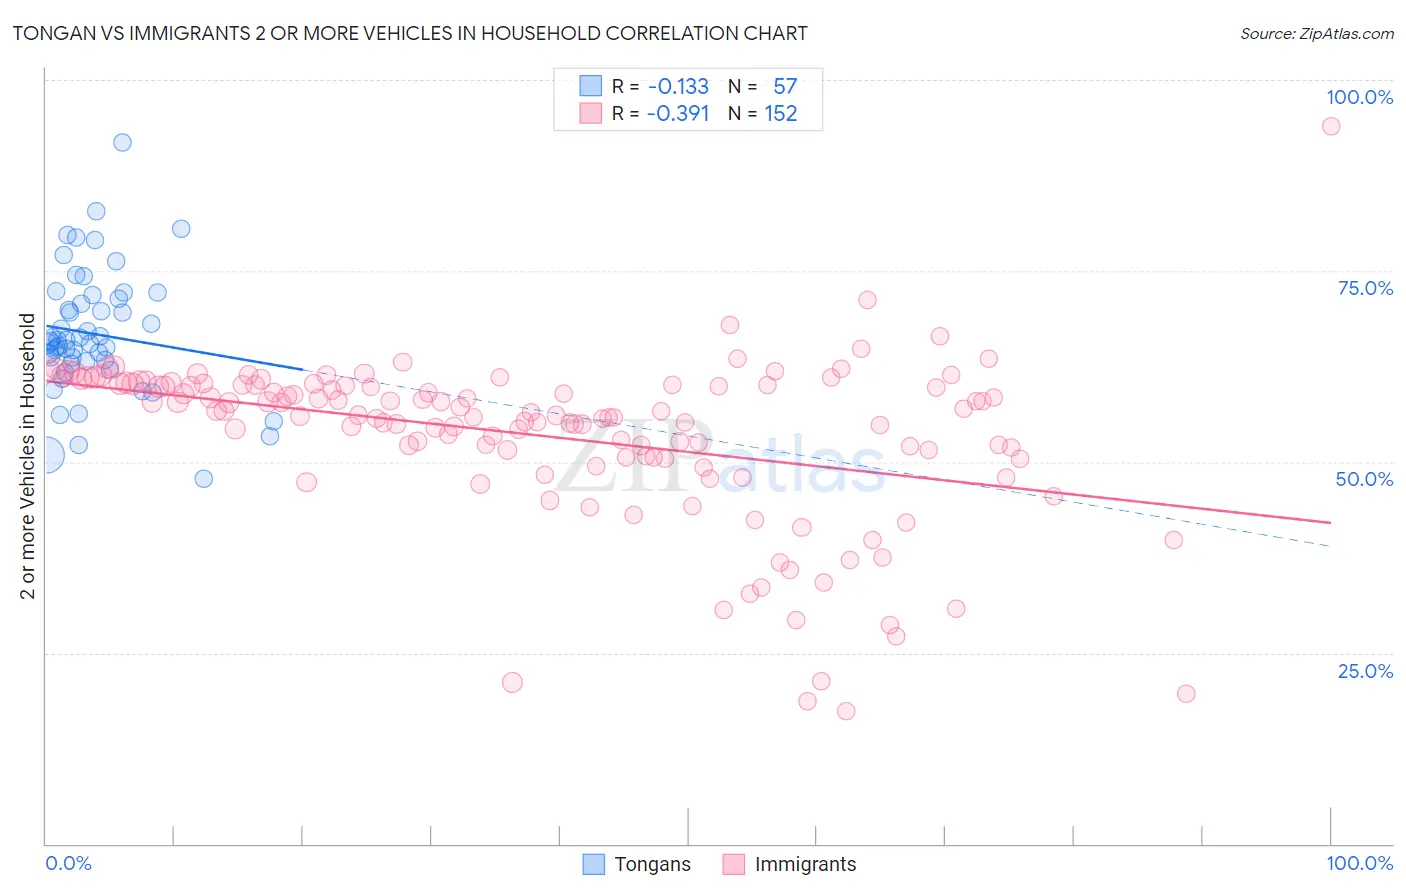
Tongan vs Immigrants 2 or more Vehicles in Household Correlation Chart
The statistical analysis conducted on geographies consisting of 102,873,160 people shows a poor negative correlation between the proportion of Tongans and percentage of households with 2 or more vehicles available in the United States with a correlation coefficient (R) of -0.133 and weighted average of 63.5%. Similarly, the statistical analysis conducted on geographies consisting of 577,129,923 people shows a mild negative correlation between the proportion of Immigrants and percentage of households with 2 or more vehicles available in the United States with a correlation coefficient (R) of -0.391 and weighted average of 54.7%, a difference of 16.0%.
2 or more Vehicles in Household Correlation Summary
| Measurement | Tongan | Immigrants |
| Minimum | 47.9% | 17.3% |
| Maximum | 91.9% | 94.0% |
| Range | 44.0% | 76.6% |
| Mean | 66.7% | 53.4% |
| Median | 65.8% | 56.3% |
| Interquartile 25% (IQ1) | 63.0% | 50.6% |
| Interquartile 75% (IQ3) | 71.7% | 60.1% |
| Interquartile Range (IQR) | 8.7% | 9.5% |
| Standard Deviation (Sample) | 8.2% | 10.9% |
| Standard Deviation (Population) | 8.1% | 10.9% |
Similar Demographics by 2 or more Vehicles in Household
Demographics Similar to Tongans by 2 or more Vehicles in Household
In terms of 2 or more vehicles in household, the demographic groups most similar to Tongans are Danish (63.3%, a difference of 0.37%), Norwegian (62.8%, a difference of 1.1%), Immigrants from Fiji (62.3%, a difference of 1.9%), Yakama (64.9%, a difference of 2.2%), and Scandinavian (62.1%, a difference of 2.3%).
| Demographics | Rating | Rank | 2 or more Vehicles in Household |
| Yakama | 100.0 /100 | #1 | Exceptional 64.9% |
| Tongans | 100.0 /100 | #2 | Exceptional 63.5% |
| Danes | 100.0 /100 | #3 | Exceptional 63.3% |
| Norwegians | 100.0 /100 | #4 | Exceptional 62.8% |
| Immigrants | Fiji | 100.0 /100 | #5 | Exceptional 62.3% |
| Scandinavians | 100.0 /100 | #6 | Exceptional 62.1% |
| Puget Sound Salish | 100.0 /100 | #7 | Exceptional 62.1% |
| English | 100.0 /100 | #8 | Exceptional 61.9% |
| Swedes | 100.0 /100 | #9 | Exceptional 61.8% |
| Mexicans | 100.0 /100 | #10 | Exceptional 61.7% |
| Dutch | 100.0 /100 | #11 | Exceptional 61.6% |
| Germans | 100.0 /100 | #12 | Exceptional 61.6% |
| Samoans | 100.0 /100 | #13 | Exceptional 61.5% |
| Czechs | 100.0 /100 | #14 | Exceptional 61.5% |
| Nepalese | 100.0 /100 | #15 | Exceptional 61.4% |
Demographics Similar to Immigrants by 2 or more Vehicles in Household
In terms of 2 or more vehicles in household, the demographic groups most similar to Immigrants are Immigrants from Romania (54.7%, a difference of 0.060%), Russian (54.8%, a difference of 0.070%), Immigrants from Japan (54.7%, a difference of 0.090%), Central American (54.7%, a difference of 0.11%), and Eastern European (54.8%, a difference of 0.13%).
| Demographics | Rating | Rank | 2 or more Vehicles in Household |
| Apache | 36.7 /100 | #184 | Fair 55.1% |
| Arabs | 35.9 /100 | #185 | Fair 55.0% |
| Peruvians | 33.7 /100 | #186 | Fair 55.0% |
| Immigrants | Uganda | 33.4 /100 | #187 | Fair 55.0% |
| Marshallese | 30.5 /100 | #188 | Fair 54.9% |
| Eastern Europeans | 27.5 /100 | #189 | Fair 54.8% |
| Russians | 26.3 /100 | #190 | Fair 54.8% |
| Immigrants | Immigrants | 25.0 /100 | #191 | Fair 54.7% |
| Immigrants | Romania | 23.8 /100 | #192 | Fair 54.7% |
| Immigrants | Japan | 23.4 /100 | #193 | Fair 54.7% |
| Central Americans | 23.0 /100 | #194 | Fair 54.7% |
| Iroquois | 22.6 /100 | #195 | Fair 54.7% |
| Immigrants | Poland | 19.3 /100 | #196 | Poor 54.6% |
| Argentineans | 17.5 /100 | #197 | Poor 54.5% |
| Carpatho Rusyns | 16.2 /100 | #198 | Poor 54.4% |