Tongan vs Alsatian 2 or more Vehicles in Household
COMPARE
Tongan
Alsatian
2 or more Vehicles in Household
2 or more Vehicles in Household Comparison
Tongans
Alsatians
63.5%
2 OR MORE VEHICLES IN HOUSEHOLD
100.0/ 100
METRIC RATING
2nd/ 347
METRIC RANK
52.5%
2 OR MORE VEHICLES IN HOUSEHOLD
0.6/ 100
METRIC RATING
259th/ 347
METRIC RANK
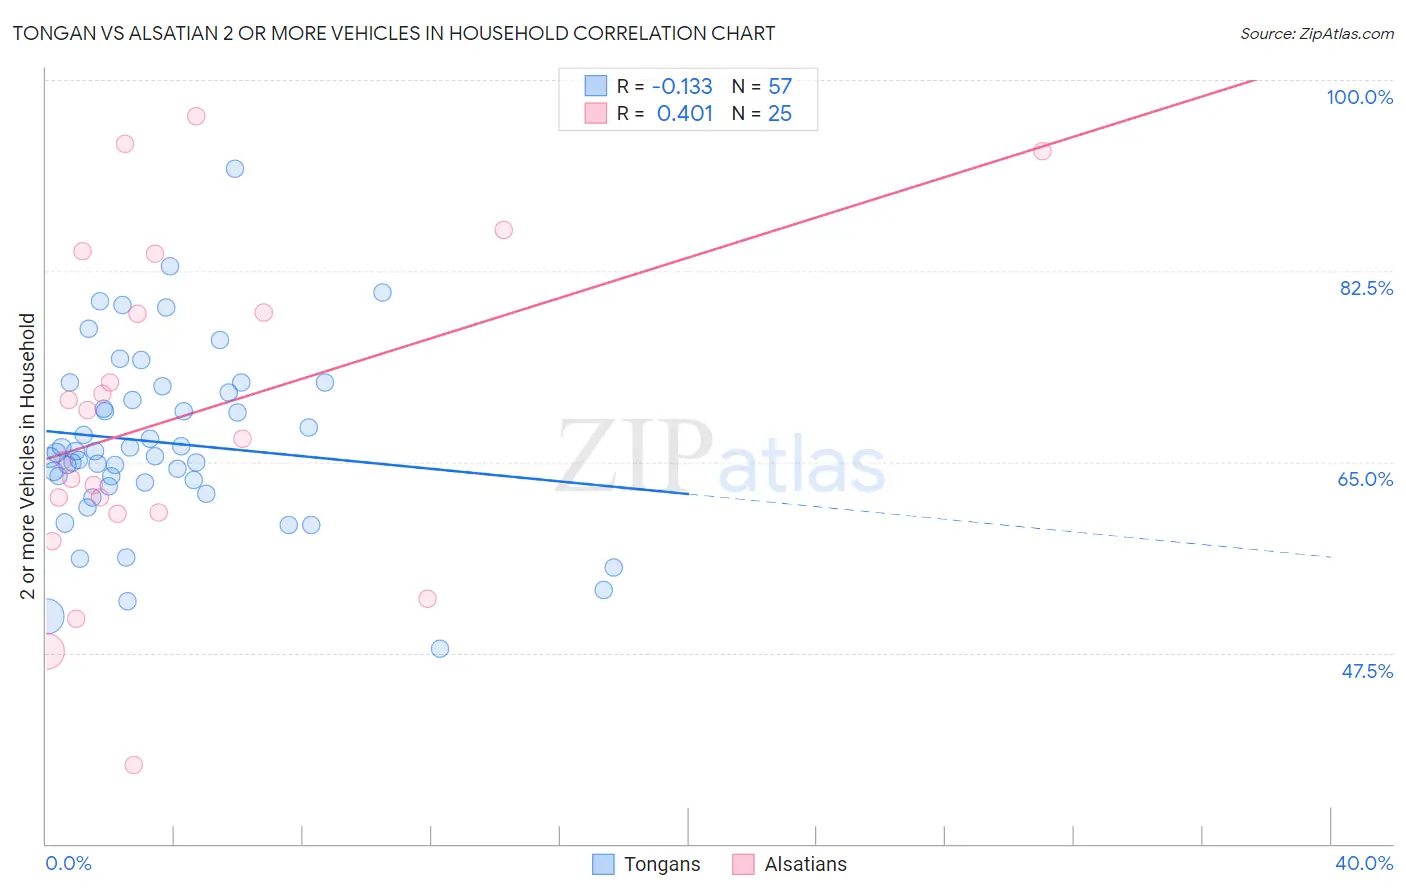
Tongan vs Alsatian 2 or more Vehicles in Household Correlation Chart
The statistical analysis conducted on geographies consisting of 102,873,160 people shows a poor negative correlation between the proportion of Tongans and percentage of households with 2 or more vehicles available in the United States with a correlation coefficient (R) of -0.133 and weighted average of 63.5%. Similarly, the statistical analysis conducted on geographies consisting of 82,680,020 people shows a moderate positive correlation between the proportion of Alsatians and percentage of households with 2 or more vehicles available in the United States with a correlation coefficient (R) of 0.401 and weighted average of 52.5%, a difference of 21.0%.
2 or more Vehicles in Household Correlation Summary
| Measurement | Tongan | Alsatian |
| Minimum | 47.9% | 37.2% |
| Maximum | 91.9% | 96.6% |
| Range | 44.0% | 59.4% |
| Mean | 66.7% | 69.1% |
| Median | 65.8% | 67.1% |
| Interquartile 25% (IQ1) | 63.0% | 60.3% |
| Interquartile 75% (IQ3) | 71.7% | 81.4% |
| Interquartile Range (IQR) | 8.7% | 21.1% |
| Standard Deviation (Sample) | 8.2% | 15.1% |
| Standard Deviation (Population) | 8.1% | 14.8% |
Similar Demographics by 2 or more Vehicles in Household
Demographics Similar to Tongans by 2 or more Vehicles in Household
In terms of 2 or more vehicles in household, the demographic groups most similar to Tongans are Danish (63.3%, a difference of 0.37%), Norwegian (62.8%, a difference of 1.1%), Immigrants from Fiji (62.3%, a difference of 1.9%), Yakama (64.9%, a difference of 2.2%), and Scandinavian (62.1%, a difference of 2.3%).
| Demographics | Rating | Rank | 2 or more Vehicles in Household |
| Yakama | 100.0 /100 | #1 | Exceptional 64.9% |
| Tongans | 100.0 /100 | #2 | Exceptional 63.5% |
| Danes | 100.0 /100 | #3 | Exceptional 63.3% |
| Norwegians | 100.0 /100 | #4 | Exceptional 62.8% |
| Immigrants | Fiji | 100.0 /100 | #5 | Exceptional 62.3% |
| Scandinavians | 100.0 /100 | #6 | Exceptional 62.1% |
| Puget Sound Salish | 100.0 /100 | #7 | Exceptional 62.1% |
| English | 100.0 /100 | #8 | Exceptional 61.9% |
| Swedes | 100.0 /100 | #9 | Exceptional 61.8% |
| Mexicans | 100.0 /100 | #10 | Exceptional 61.7% |
| Dutch | 100.0 /100 | #11 | Exceptional 61.6% |
| Germans | 100.0 /100 | #12 | Exceptional 61.6% |
| Samoans | 100.0 /100 | #13 | Exceptional 61.5% |
| Czechs | 100.0 /100 | #14 | Exceptional 61.5% |
| Nepalese | 100.0 /100 | #15 | Exceptional 61.4% |
Demographics Similar to Alsatians by 2 or more Vehicles in Household
In terms of 2 or more vehicles in household, the demographic groups most similar to Alsatians are Central American Indian (52.5%, a difference of 0.040%), Immigrants from Bahamas (52.5%, a difference of 0.070%), Immigrants from Australia (52.4%, a difference of 0.10%), Immigrants from Hong Kong (52.6%, a difference of 0.14%), and Immigrants from Eritrea (52.6%, a difference of 0.28%).
| Demographics | Rating | Rank | 2 or more Vehicles in Household |
| Immigrants | Portugal | 1.0 /100 | #252 | Tragic 52.8% |
| Nigerians | 0.9 /100 | #253 | Tragic 52.8% |
| Immigrants | Malaysia | 0.8 /100 | #254 | Tragic 52.7% |
| Uruguayans | 0.7 /100 | #255 | Tragic 52.7% |
| Immigrants | Eritrea | 0.7 /100 | #256 | Tragic 52.6% |
| Immigrants | Hong Kong | 0.6 /100 | #257 | Tragic 52.6% |
| Central American Indians | 0.6 /100 | #258 | Tragic 52.5% |
| Alsatians | 0.6 /100 | #259 | Tragic 52.5% |
| Immigrants | Bahamas | 0.5 /100 | #260 | Tragic 52.5% |
| Immigrants | Australia | 0.5 /100 | #261 | Tragic 52.4% |
| Immigrants | Northern Africa | 0.4 /100 | #262 | Tragic 52.3% |
| Immigrants | Southern Europe | 0.4 /100 | #263 | Tragic 52.3% |
| Immigrants | Latvia | 0.4 /100 | #264 | Tragic 52.2% |
| Immigrants | Congo | 0.3 /100 | #265 | Tragic 52.1% |
| Immigrants | France | 0.2 /100 | #266 | Tragic 52.0% |