Tongan vs Slovak 2 or more Vehicles in Household
COMPARE
Tongan
Slovak
2 or more Vehicles in Household
2 or more Vehicles in Household Comparison
Tongans
Slovaks
63.5%
2 OR MORE VEHICLES IN HOUSEHOLD
100.0/ 100
METRIC RATING
2nd/ 347
METRIC RANK
58.0%
2 OR MORE VEHICLES IN HOUSEHOLD
99.2/ 100
METRIC RATING
85th/ 347
METRIC RANK
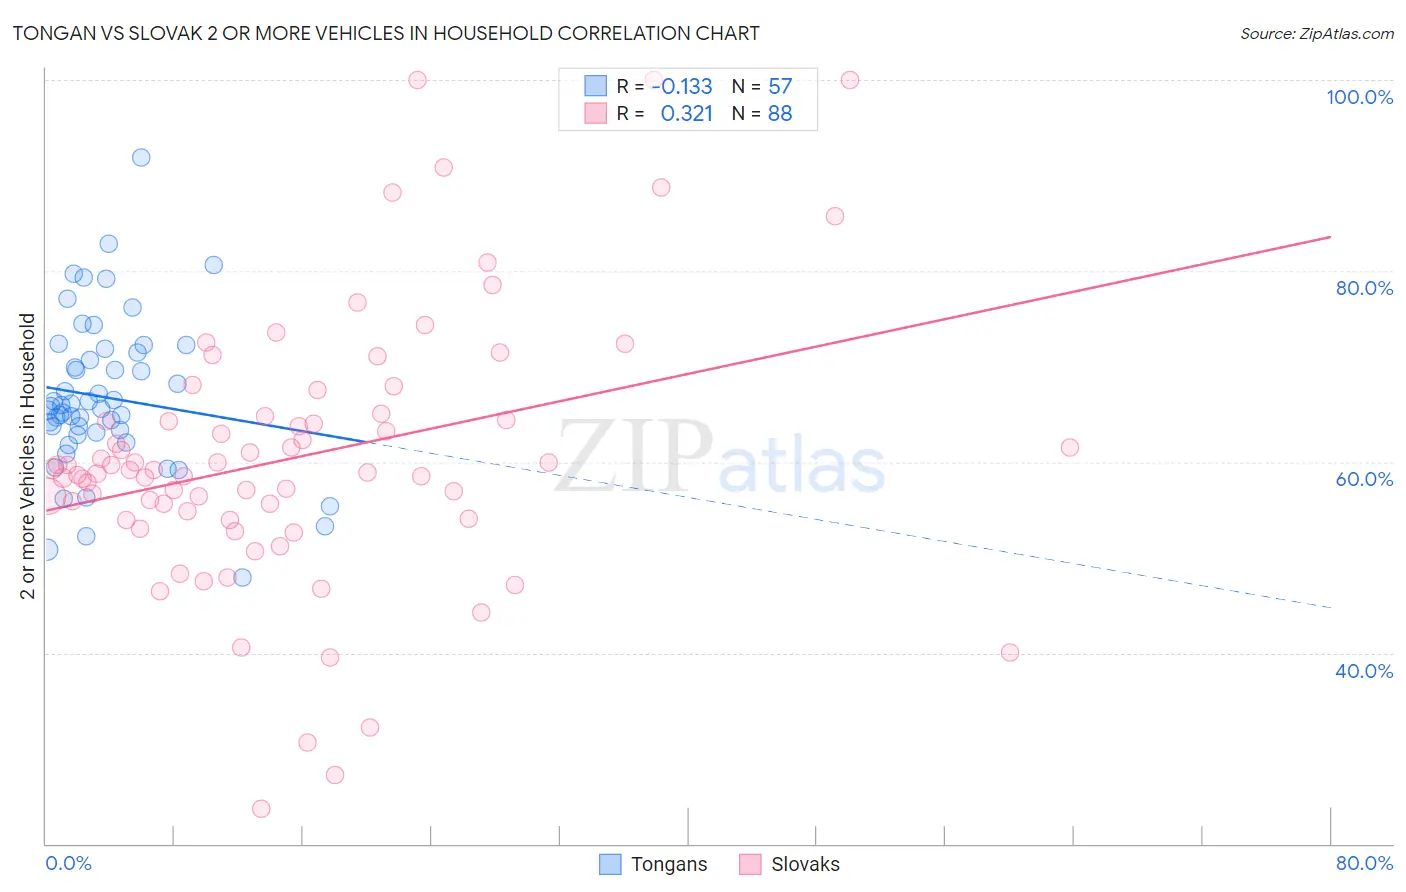
Tongan vs Slovak 2 or more Vehicles in Household Correlation Chart
The statistical analysis conducted on geographies consisting of 102,873,160 people shows a poor negative correlation between the proportion of Tongans and percentage of households with 2 or more vehicles available in the United States with a correlation coefficient (R) of -0.133 and weighted average of 63.5%. Similarly, the statistical analysis conducted on geographies consisting of 397,714,521 people shows a mild positive correlation between the proportion of Slovaks and percentage of households with 2 or more vehicles available in the United States with a correlation coefficient (R) of 0.321 and weighted average of 58.0%, a difference of 9.6%.
2 or more Vehicles in Household Correlation Summary
| Measurement | Tongan | Slovak |
| Minimum | 47.9% | 23.6% |
| Maximum | 91.9% | 100.0% |
| Range | 44.0% | 76.4% |
| Mean | 66.7% | 60.5% |
| Median | 65.8% | 59.1% |
| Interquartile 25% (IQ1) | 63.0% | 54.5% |
| Interquartile 75% (IQ3) | 71.7% | 64.6% |
| Interquartile Range (IQR) | 8.7% | 10.1% |
| Standard Deviation (Sample) | 8.2% | 14.2% |
| Standard Deviation (Population) | 8.1% | 14.1% |
Similar Demographics by 2 or more Vehicles in Household
Demographics Similar to Tongans by 2 or more Vehicles in Household
In terms of 2 or more vehicles in household, the demographic groups most similar to Tongans are Danish (63.3%, a difference of 0.37%), Norwegian (62.8%, a difference of 1.1%), Immigrants from Fiji (62.3%, a difference of 1.9%), Yakama (64.9%, a difference of 2.2%), and Scandinavian (62.1%, a difference of 2.3%).
| Demographics | Rating | Rank | 2 or more Vehicles in Household |
| Yakama | 100.0 /100 | #1 | Exceptional 64.9% |
| Tongans | 100.0 /100 | #2 | Exceptional 63.5% |
| Danes | 100.0 /100 | #3 | Exceptional 63.3% |
| Norwegians | 100.0 /100 | #4 | Exceptional 62.8% |
| Immigrants | Fiji | 100.0 /100 | #5 | Exceptional 62.3% |
| Scandinavians | 100.0 /100 | #6 | Exceptional 62.1% |
| Puget Sound Salish | 100.0 /100 | #7 | Exceptional 62.1% |
| English | 100.0 /100 | #8 | Exceptional 61.9% |
| Swedes | 100.0 /100 | #9 | Exceptional 61.8% |
| Mexicans | 100.0 /100 | #10 | Exceptional 61.7% |
| Dutch | 100.0 /100 | #11 | Exceptional 61.6% |
| Germans | 100.0 /100 | #12 | Exceptional 61.6% |
| Samoans | 100.0 /100 | #13 | Exceptional 61.5% |
| Czechs | 100.0 /100 | #14 | Exceptional 61.5% |
| Nepalese | 100.0 /100 | #15 | Exceptional 61.4% |
Demographics Similar to Slovaks by 2 or more Vehicles in Household
In terms of 2 or more vehicles in household, the demographic groups most similar to Slovaks are Potawatomi (58.0%, a difference of 0.030%), Maltese (58.0%, a difference of 0.050%), Thai (57.9%, a difference of 0.070%), Icelander (58.0%, a difference of 0.080%), and Immigrants from Iran (57.9%, a difference of 0.080%).
| Demographics | Rating | Rank | 2 or more Vehicles in Household |
| Lithuanians | 99.5 /100 | #78 | Exceptional 58.2% |
| Delaware | 99.4 /100 | #79 | Exceptional 58.2% |
| Immigrants | England | 99.3 /100 | #80 | Exceptional 58.1% |
| Immigrants | Iraq | 99.3 /100 | #81 | Exceptional 58.1% |
| Iranians | 99.3 /100 | #82 | Exceptional 58.1% |
| Icelanders | 99.2 /100 | #83 | Exceptional 58.0% |
| Maltese | 99.2 /100 | #84 | Exceptional 58.0% |
| Slovaks | 99.2 /100 | #85 | Exceptional 58.0% |
| Potawatomi | 99.1 /100 | #86 | Exceptional 58.0% |
| Thais | 99.1 /100 | #87 | Exceptional 57.9% |
| Immigrants | Iran | 99.1 /100 | #88 | Exceptional 57.9% |
| Immigrants | Germany | 99.0 /100 | #89 | Exceptional 57.9% |
| Hispanics or Latinos | 99.0 /100 | #90 | Exceptional 57.9% |
| Pakistanis | 99.0 /100 | #91 | Exceptional 57.9% |
| Shoshone | 99.0 /100 | #92 | Exceptional 57.9% |