Venezuelan vs Uruguayan No Vehicles in Household
COMPARE
Venezuelan
Uruguayan
No Vehicles in Household
No Vehicles in Household Comparison
Venezuelans
Uruguayans
8.1%
NO VEHICLES IN HOUSEHOLD
99.8/ 100
METRIC RATING
57th/ 347
METRIC RANK
11.3%
NO VEHICLES IN HOUSEHOLD
7.7/ 100
METRIC RATING
223rd/ 347
METRIC RANK
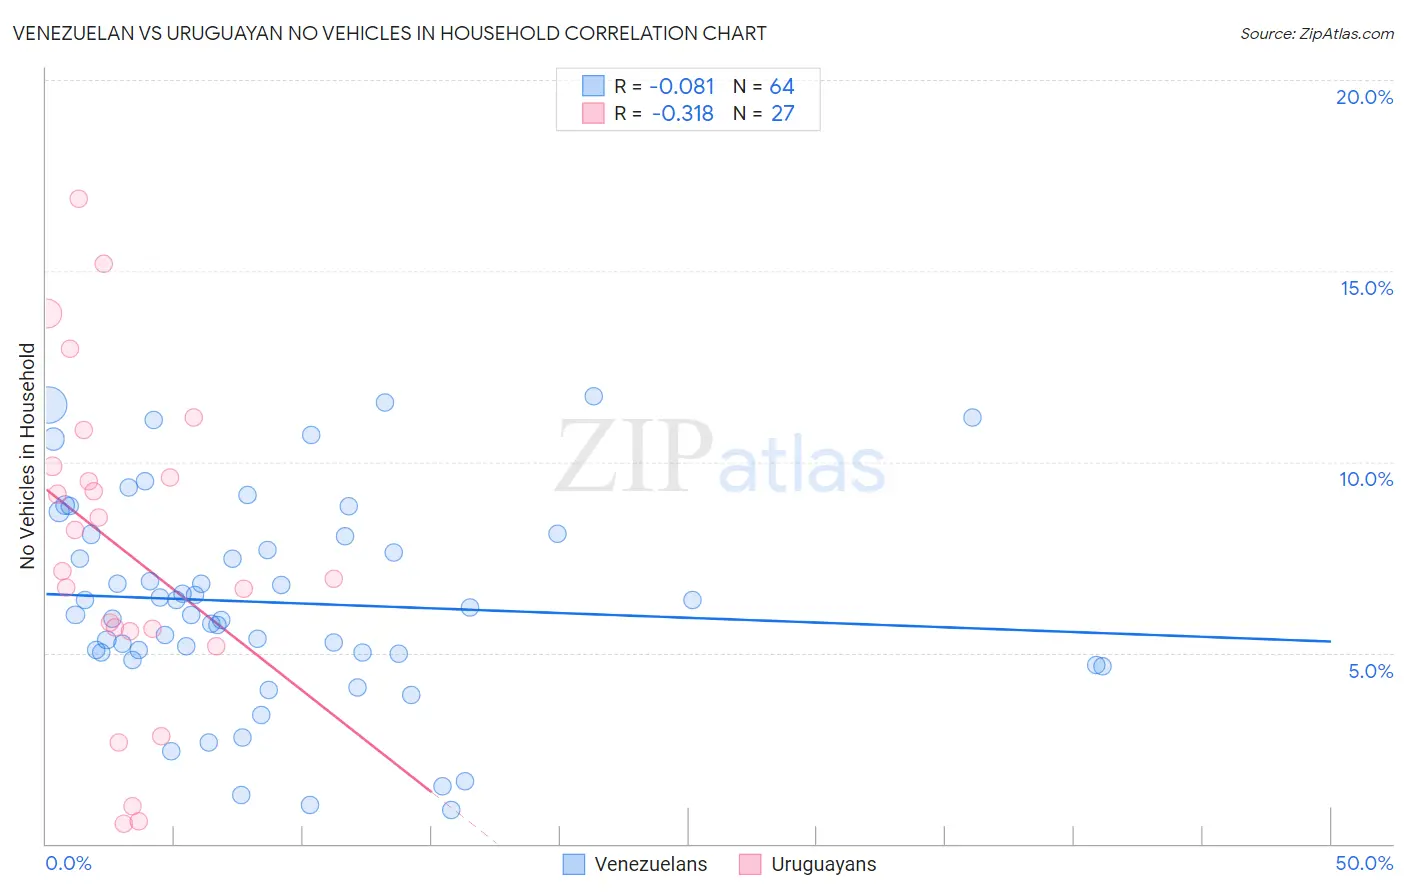
Venezuelan vs Uruguayan No Vehicles in Household Correlation Chart
The statistical analysis conducted on geographies consisting of 305,806,487 people shows a slight negative correlation between the proportion of Venezuelans and percentage of households with no vehicle available in the United States with a correlation coefficient (R) of -0.081 and weighted average of 8.1%. Similarly, the statistical analysis conducted on geographies consisting of 144,673,371 people shows a mild negative correlation between the proportion of Uruguayans and percentage of households with no vehicle available in the United States with a correlation coefficient (R) of -0.318 and weighted average of 11.3%, a difference of 38.8%.
No Vehicles in Household Correlation Summary
| Measurement | Venezuelan | Uruguayan |
| Minimum | 0.90% | 0.52% |
| Maximum | 11.7% | 16.9% |
| Range | 10.8% | 16.4% |
| Mean | 6.3% | 7.7% |
| Median | 6.1% | 7.1% |
| Interquartile 25% (IQ1) | 5.0% | 5.6% |
| Interquartile 75% (IQ3) | 8.1% | 9.9% |
| Interquartile Range (IQR) | 3.1% | 4.3% |
| Standard Deviation (Sample) | 2.7% | 4.2% |
| Standard Deviation (Population) | 2.7% | 4.2% |
Similar Demographics by No Vehicles in Household
Demographics Similar to Venezuelans by No Vehicles in Household
In terms of no vehicles in household, the demographic groups most similar to Venezuelans are Immigrants from Mexico (8.1%, a difference of 0.11%), Immigrants from Afghanistan (8.1%, a difference of 0.28%), Immigrants from India (8.2%, a difference of 0.46%), Immigrants from Laos (8.2%, a difference of 0.53%), and Celtic (8.1%, a difference of 0.68%).
| Demographics | Rating | Rank | No Vehicles in Household |
| Belgians | 99.9 /100 | #50 | Exceptional 8.0% |
| Koreans | 99.9 /100 | #51 | Exceptional 8.0% |
| Hawaiians | 99.9 /100 | #52 | Exceptional 8.0% |
| Slovenes | 99.9 /100 | #53 | Exceptional 8.0% |
| Immigrants | Venezuela | 99.9 /100 | #54 | Exceptional 8.1% |
| Celtics | 99.9 /100 | #55 | Exceptional 8.1% |
| Immigrants | Afghanistan | 99.9 /100 | #56 | Exceptional 8.1% |
| Venezuelans | 99.8 /100 | #57 | Exceptional 8.1% |
| Immigrants | Mexico | 99.8 /100 | #58 | Exceptional 8.1% |
| Immigrants | India | 99.8 /100 | #59 | Exceptional 8.2% |
| Immigrants | Laos | 99.8 /100 | #60 | Exceptional 8.2% |
| Thais | 99.8 /100 | #61 | Exceptional 8.2% |
| Chinese | 99.8 /100 | #62 | Exceptional 8.2% |
| Slovaks | 99.8 /100 | #63 | Exceptional 8.3% |
| Croatians | 99.8 /100 | #64 | Exceptional 8.3% |
Demographics Similar to Uruguayans by No Vehicles in Household
In terms of no vehicles in household, the demographic groups most similar to Uruguayans are Immigrants from South America (11.3%, a difference of 0.16%), Immigrants from Hong Kong (11.3%, a difference of 0.22%), Peruvian (11.2%, a difference of 0.30%), Immigrants from Sierra Leone (11.3%, a difference of 0.59%), and Immigrants from Zaire (11.2%, a difference of 0.75%).
| Demographics | Rating | Rank | No Vehicles in Household |
| Immigrants | Argentina | 10.6 /100 | #216 | Poor 11.2% |
| Dutch West Indians | 10.2 /100 | #217 | Poor 11.2% |
| Immigrants | Guatemala | 10.0 /100 | #218 | Tragic 11.2% |
| Argentineans | 9.6 /100 | #219 | Tragic 11.2% |
| Immigrants | Zaire | 9.6 /100 | #220 | Tragic 11.2% |
| Peruvians | 8.4 /100 | #221 | Tragic 11.2% |
| Immigrants | South America | 8.0 /100 | #222 | Tragic 11.3% |
| Uruguayans | 7.7 /100 | #223 | Tragic 11.3% |
| Immigrants | Hong Kong | 7.2 /100 | #224 | Tragic 11.3% |
| Immigrants | Sierra Leone | 6.4 /100 | #225 | Tragic 11.3% |
| Immigrants | Somalia | 5.4 /100 | #226 | Tragic 11.4% |
| Immigrants | Pakistan | 5.4 /100 | #227 | Tragic 11.4% |
| Immigrants | Romania | 5.3 /100 | #228 | Tragic 11.4% |
| Ugandans | 5.3 /100 | #229 | Tragic 11.4% |
| Immigrants | Norway | 5.1 /100 | #230 | Tragic 11.4% |