Immigrants from Bolivia vs Uruguayan No Vehicles in Household
COMPARE
Immigrants from Bolivia
Uruguayan
No Vehicles in Household
No Vehicles in Household Comparison
Immigrants from Bolivia
Uruguayans
8.9%
NO VEHICLES IN HOUSEHOLD
98.7/ 100
METRIC RATING
96th/ 347
METRIC RANK
11.3%
NO VEHICLES IN HOUSEHOLD
7.7/ 100
METRIC RATING
223rd/ 347
METRIC RANK
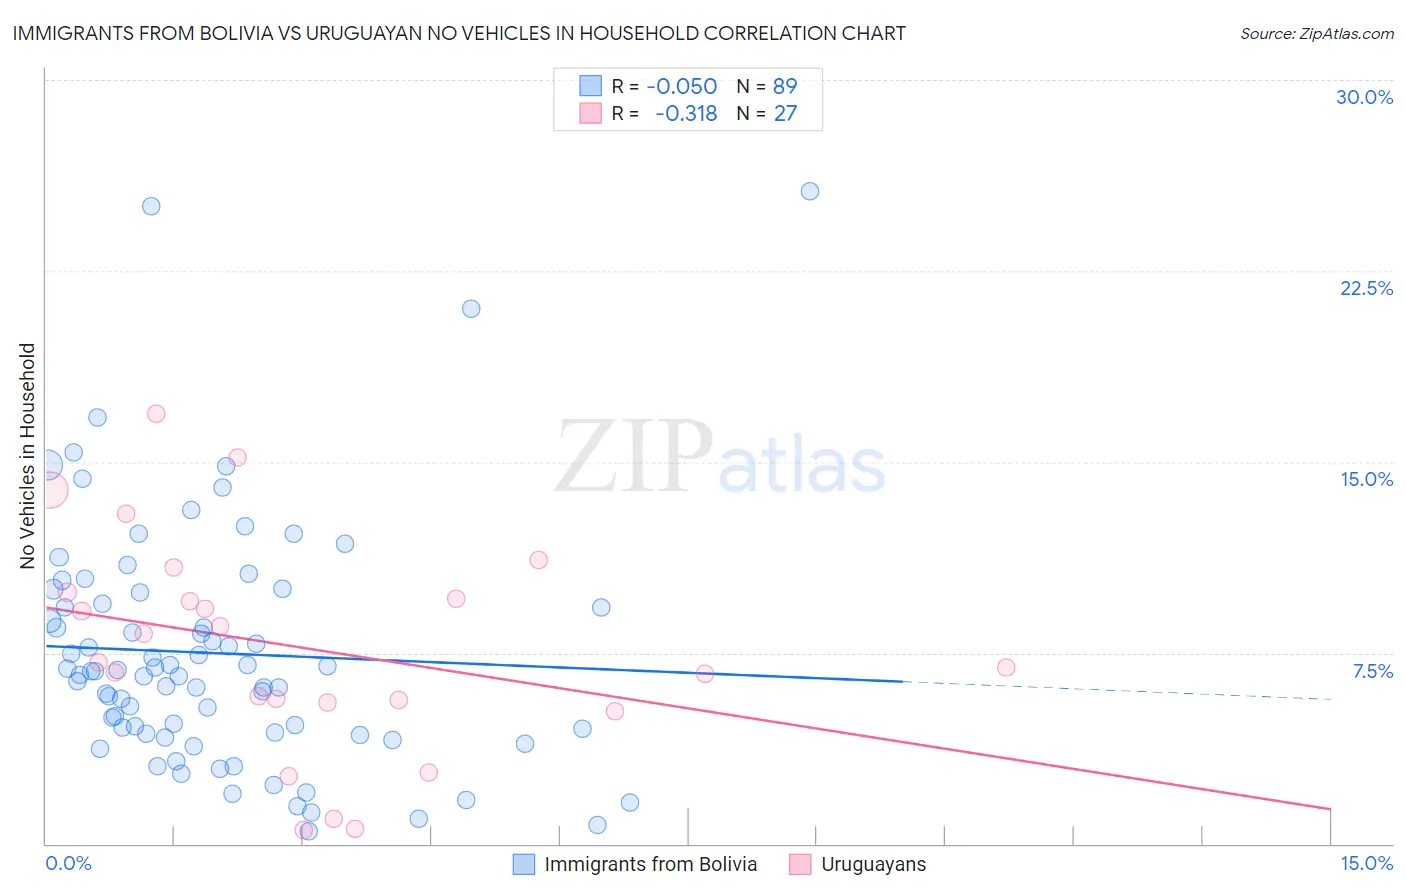
Immigrants from Bolivia vs Uruguayan No Vehicles in Household Correlation Chart
The statistical analysis conducted on geographies consisting of 158,658,153 people shows a slight negative correlation between the proportion of Immigrants from Bolivia and percentage of households with no vehicle available in the United States with a correlation coefficient (R) of -0.050 and weighted average of 8.9%. Similarly, the statistical analysis conducted on geographies consisting of 144,673,371 people shows a mild negative correlation between the proportion of Uruguayans and percentage of households with no vehicle available in the United States with a correlation coefficient (R) of -0.318 and weighted average of 11.3%, a difference of 27.2%.
No Vehicles in Household Correlation Summary
| Measurement | Immigrants from Bolivia | Uruguayan |
| Minimum | 0.50% | 0.52% |
| Maximum | 25.6% | 16.9% |
| Range | 25.1% | 16.4% |
| Mean | 7.5% | 7.7% |
| Median | 6.8% | 7.1% |
| Interquartile 25% (IQ1) | 4.4% | 5.6% |
| Interquartile 75% (IQ3) | 9.6% | 9.9% |
| Interquartile Range (IQR) | 5.3% | 4.3% |
| Standard Deviation (Sample) | 4.8% | 4.2% |
| Standard Deviation (Population) | 4.8% | 4.2% |
Similar Demographics by No Vehicles in Household
Demographics Similar to Immigrants from Bolivia by No Vehicles in Household
In terms of no vehicles in household, the demographic groups most similar to Immigrants from Bolivia are Potawatomi (8.8%, a difference of 0.28%), Austrian (8.8%, a difference of 0.43%), Immigrants from Central America (8.9%, a difference of 0.66%), Slavic (9.0%, a difference of 0.97%), and Bulgarian (9.0%, a difference of 1.0%).
| Demographics | Rating | Rank | No Vehicles in Household |
| Immigrants | Cuba | 99.2 /100 | #89 | Exceptional 8.7% |
| Bhutanese | 99.2 /100 | #90 | Exceptional 8.7% |
| Immigrants | Germany | 99.1 /100 | #91 | Exceptional 8.7% |
| Immigrants | Canada | 99.1 /100 | #92 | Exceptional 8.7% |
| Immigrants | North America | 99.1 /100 | #93 | Exceptional 8.7% |
| Austrians | 98.9 /100 | #94 | Exceptional 8.8% |
| Potawatomi | 98.8 /100 | #95 | Exceptional 8.8% |
| Immigrants | Bolivia | 98.7 /100 | #96 | Exceptional 8.9% |
| Immigrants | Central America | 98.5 /100 | #97 | Exceptional 8.9% |
| Slavs | 98.4 /100 | #98 | Exceptional 9.0% |
| Bulgarians | 98.4 /100 | #99 | Exceptional 9.0% |
| Asians | 98.3 /100 | #100 | Exceptional 9.0% |
| Pakistanis | 98.3 /100 | #101 | Exceptional 9.0% |
| Yugoslavians | 98.3 /100 | #102 | Exceptional 9.0% |
| Seminole | 98.3 /100 | #103 | Exceptional 9.0% |
Demographics Similar to Uruguayans by No Vehicles in Household
In terms of no vehicles in household, the demographic groups most similar to Uruguayans are Immigrants from South America (11.3%, a difference of 0.16%), Immigrants from Hong Kong (11.3%, a difference of 0.22%), Peruvian (11.2%, a difference of 0.30%), Immigrants from Sierra Leone (11.3%, a difference of 0.59%), and Immigrants from Zaire (11.2%, a difference of 0.75%).
| Demographics | Rating | Rank | No Vehicles in Household |
| Immigrants | Argentina | 10.6 /100 | #216 | Poor 11.2% |
| Dutch West Indians | 10.2 /100 | #217 | Poor 11.2% |
| Immigrants | Guatemala | 10.0 /100 | #218 | Tragic 11.2% |
| Argentineans | 9.6 /100 | #219 | Tragic 11.2% |
| Immigrants | Zaire | 9.6 /100 | #220 | Tragic 11.2% |
| Peruvians | 8.4 /100 | #221 | Tragic 11.2% |
| Immigrants | South America | 8.0 /100 | #222 | Tragic 11.3% |
| Uruguayans | 7.7 /100 | #223 | Tragic 11.3% |
| Immigrants | Hong Kong | 7.2 /100 | #224 | Tragic 11.3% |
| Immigrants | Sierra Leone | 6.4 /100 | #225 | Tragic 11.3% |
| Immigrants | Somalia | 5.4 /100 | #226 | Tragic 11.4% |
| Immigrants | Pakistan | 5.4 /100 | #227 | Tragic 11.4% |
| Immigrants | Romania | 5.3 /100 | #228 | Tragic 11.4% |
| Ugandans | 5.3 /100 | #229 | Tragic 11.4% |
| Immigrants | Norway | 5.1 /100 | #230 | Tragic 11.4% |