Thai vs Immigrants from Cameroon 4 or more Vehicles in Household
COMPARE
Thai
Immigrants from Cameroon
4 or more Vehicles in Household
4 or more Vehicles in Household Comparison
Thais
Immigrants from Cameroon
6.2%
4 OR MORE VEHICLES IN HOUSEHOLD
36.9/ 100
METRIC RATING
185th/ 347
METRIC RANK
6.4%
4 OR MORE VEHICLES IN HOUSEHOLD
64.4/ 100
METRIC RATING
161st/ 347
METRIC RANK
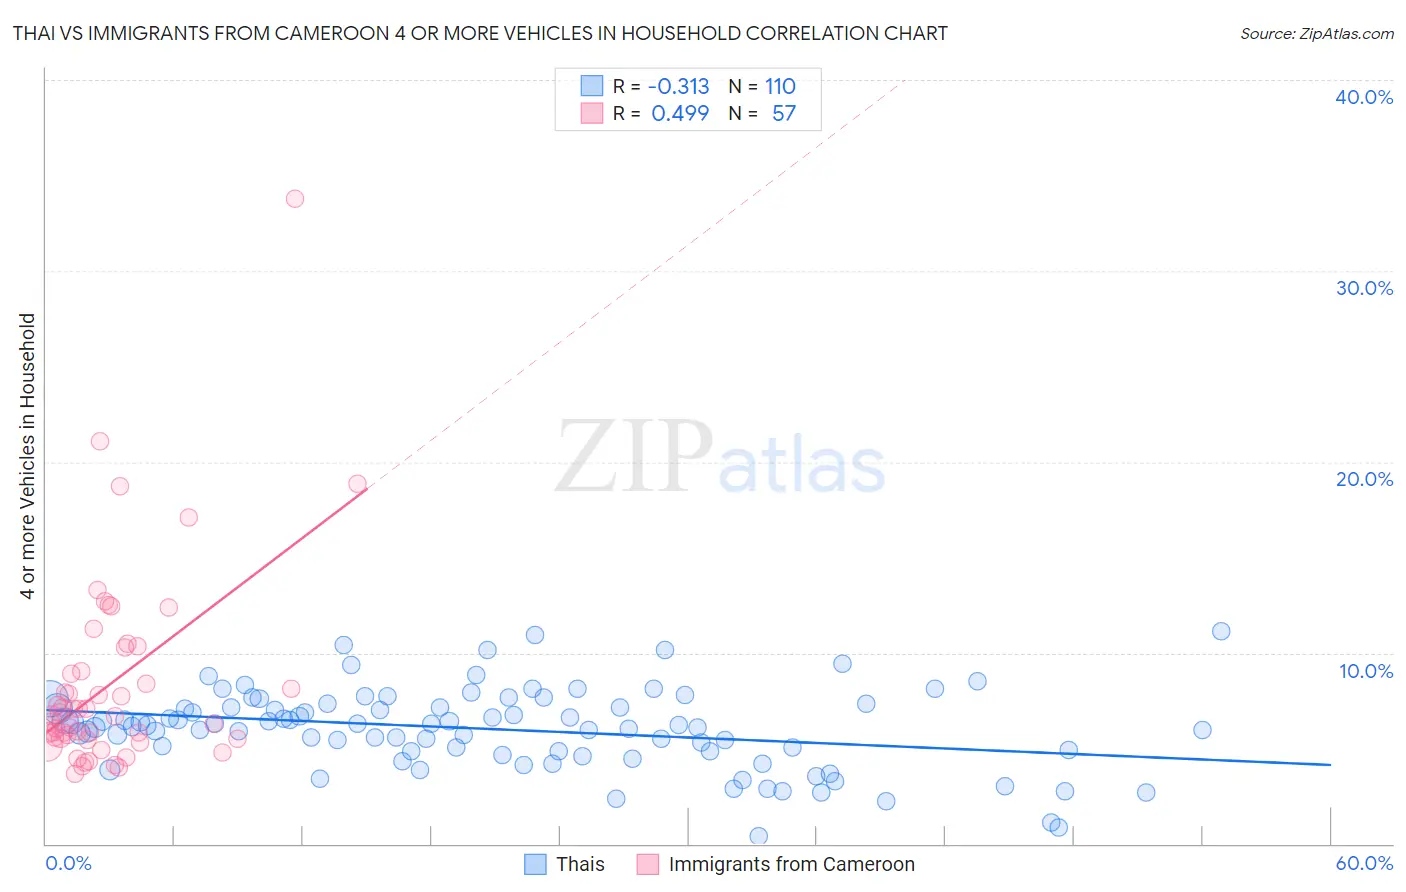
Thai vs Immigrants from Cameroon 4 or more Vehicles in Household Correlation Chart
The statistical analysis conducted on geographies consisting of 473,279,987 people shows a mild negative correlation between the proportion of Thais and percentage of households with 4 or more vehicles available in the United States with a correlation coefficient (R) of -0.313 and weighted average of 6.2%. Similarly, the statistical analysis conducted on geographies consisting of 130,454,294 people shows a moderate positive correlation between the proportion of Immigrants from Cameroon and percentage of households with 4 or more vehicles available in the United States with a correlation coefficient (R) of 0.499 and weighted average of 6.4%, a difference of 2.9%.
4 or more Vehicles in Household Correlation Summary
| Measurement | Thai | Immigrants from Cameroon |
| Minimum | 0.38% | 3.7% |
| Maximum | 11.1% | 33.8% |
| Range | 10.7% | 30.1% |
| Mean | 6.0% | 8.4% |
| Median | 6.2% | 6.7% |
| Interquartile 25% (IQ1) | 4.8% | 5.5% |
| Interquartile 75% (IQ3) | 7.2% | 9.6% |
| Interquartile Range (IQR) | 2.3% | 4.1% |
| Standard Deviation (Sample) | 2.1% | 5.2% |
| Standard Deviation (Population) | 2.1% | 5.2% |
Similar Demographics by 4 or more Vehicles in Household
Demographics Similar to Thais by 4 or more Vehicles in Household
In terms of 4 or more vehicles in household, the demographic groups most similar to Thais are Immigrants from Northern Europe (6.2%, a difference of 0.020%), Iraqi (6.2%, a difference of 0.040%), Immigrants from Burma/Myanmar (6.2%, a difference of 0.060%), Immigrants from South Africa (6.2%, a difference of 0.17%), and Kiowa (6.2%, a difference of 0.25%).
| Demographics | Rating | Rank | 4 or more Vehicles in Household |
| Belizeans | 44.5 /100 | #178 | Average 6.3% |
| Immigrants | Japan | 43.1 /100 | #179 | Average 6.3% |
| Syrians | 42.0 /100 | #180 | Average 6.3% |
| Yugoslavians | 41.1 /100 | #181 | Average 6.3% |
| South American Indians | 40.7 /100 | #182 | Average 6.3% |
| Immigrants | Burma/Myanmar | 37.5 /100 | #183 | Fair 6.2% |
| Iraqis | 37.3 /100 | #184 | Fair 6.2% |
| Thais | 36.9 /100 | #185 | Fair 6.2% |
| Immigrants | Northern Europe | 36.8 /100 | #186 | Fair 6.2% |
| Immigrants | South Africa | 35.4 /100 | #187 | Fair 6.2% |
| Kiowa | 34.7 /100 | #188 | Fair 6.2% |
| Immigrants | Eastern Asia | 33.3 /100 | #189 | Fair 6.2% |
| South Africans | 32.2 /100 | #190 | Fair 6.2% |
| Inupiat | 30.7 /100 | #191 | Fair 6.2% |
| Romanians | 30.7 /100 | #192 | Fair 6.2% |
Demographics Similar to Immigrants from Cameroon by 4 or more Vehicles in Household
In terms of 4 or more vehicles in household, the demographic groups most similar to Immigrants from Cameroon are Immigrants from Pakistan (6.4%, a difference of 0.13%), Palestinian (6.4%, a difference of 0.15%), Indian (Asian) (6.4%, a difference of 0.21%), Zimbabwean (6.4%, a difference of 0.30%), and Chilean (6.4%, a difference of 0.34%).
| Demographics | Rating | Rank | 4 or more Vehicles in Household |
| Central American Indians | 71.1 /100 | #154 | Good 6.5% |
| Iroquois | 70.4 /100 | #155 | Good 6.5% |
| Iranians | 69.9 /100 | #156 | Good 6.5% |
| Peruvians | 69.4 /100 | #157 | Good 6.5% |
| Zimbabweans | 67.1 /100 | #158 | Good 6.4% |
| Indians (Asian) | 66.3 /100 | #159 | Good 6.4% |
| Palestinians | 65.8 /100 | #160 | Good 6.4% |
| Immigrants | Cameroon | 64.4 /100 | #161 | Good 6.4% |
| Immigrants | Pakistan | 63.2 /100 | #162 | Good 6.4% |
| Chileans | 61.2 /100 | #163 | Good 6.4% |
| Hungarians | 61.1 /100 | #164 | Good 6.4% |
| Immigrants | Peru | 59.8 /100 | #165 | Average 6.4% |
| Immigrants | Denmark | 57.8 /100 | #166 | Average 6.4% |
| Poles | 56.9 /100 | #167 | Average 6.4% |
| Lebanese | 55.8 /100 | #168 | Average 6.4% |