Cuban vs Immigrants from Cameroon 4 or more Vehicles in Household
COMPARE
Cuban
Immigrants from Cameroon
4 or more Vehicles in Household
4 or more Vehicles in Household Comparison
Cubans
Immigrants from Cameroon
6.0%
4 OR MORE VEHICLES IN HOUSEHOLD
9.2/ 100
METRIC RATING
224th/ 347
METRIC RANK
6.4%
4 OR MORE VEHICLES IN HOUSEHOLD
64.4/ 100
METRIC RATING
161st/ 347
METRIC RANK
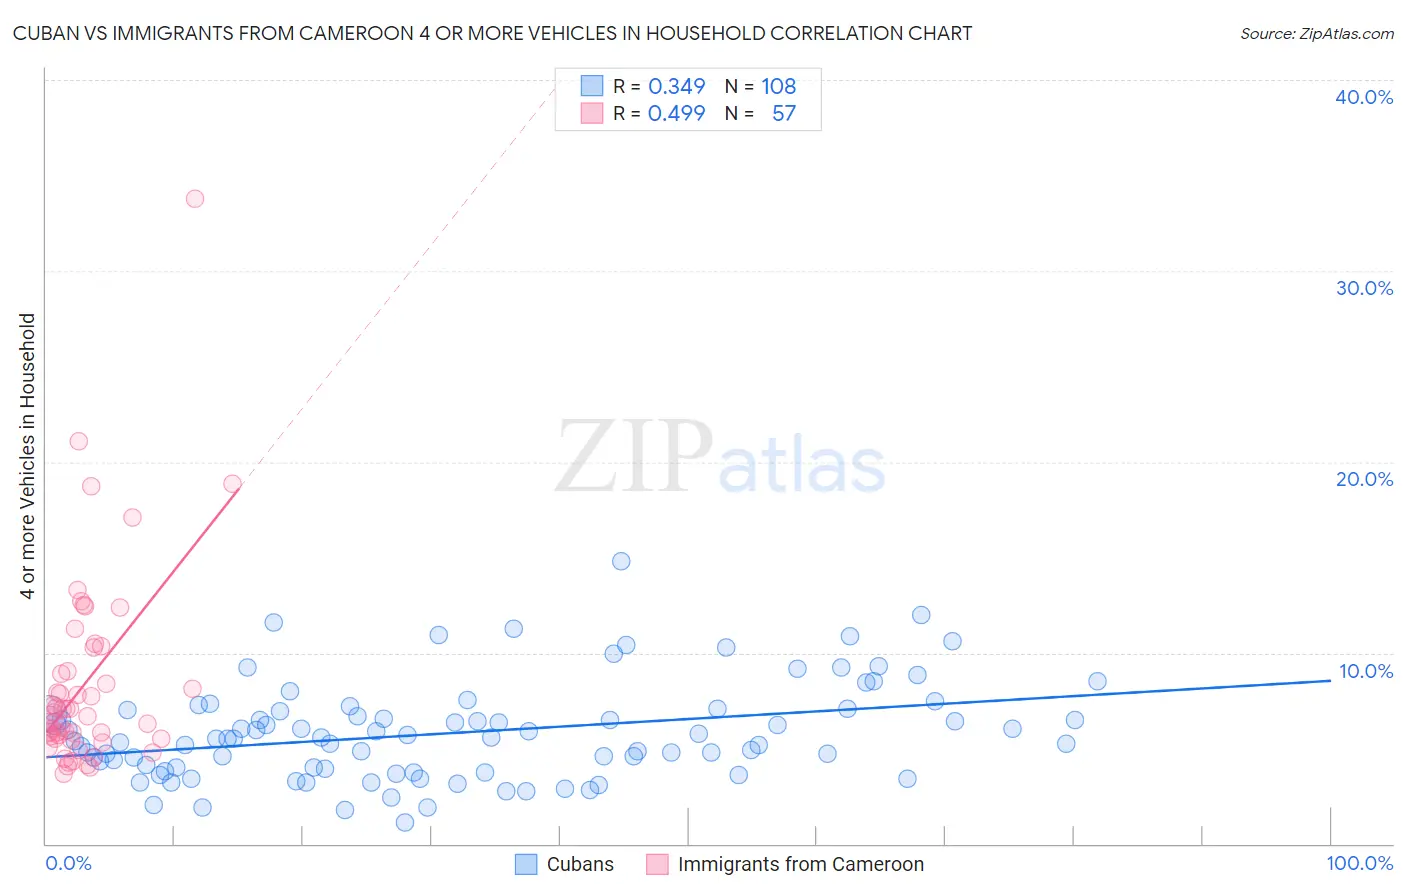
Cuban vs Immigrants from Cameroon 4 or more Vehicles in Household Correlation Chart
The statistical analysis conducted on geographies consisting of 447,048,308 people shows a mild positive correlation between the proportion of Cubans and percentage of households with 4 or more vehicles available in the United States with a correlation coefficient (R) of 0.349 and weighted average of 6.0%. Similarly, the statistical analysis conducted on geographies consisting of 130,454,294 people shows a moderate positive correlation between the proportion of Immigrants from Cameroon and percentage of households with 4 or more vehicles available in the United States with a correlation coefficient (R) of 0.499 and weighted average of 6.4%, a difference of 7.7%.
4 or more Vehicles in Household Correlation Summary
| Measurement | Cuban | Immigrants from Cameroon |
| Minimum | 1.1% | 3.7% |
| Maximum | 14.8% | 33.8% |
| Range | 13.7% | 30.1% |
| Mean | 5.8% | 8.4% |
| Median | 5.5% | 6.7% |
| Interquartile 25% (IQ1) | 3.9% | 5.5% |
| Interquartile 75% (IQ3) | 7.0% | 9.6% |
| Interquartile Range (IQR) | 3.0% | 4.1% |
| Standard Deviation (Sample) | 2.5% | 5.2% |
| Standard Deviation (Population) | 2.5% | 5.2% |
Similar Demographics by 4 or more Vehicles in Household
Demographics Similar to Cubans by 4 or more Vehicles in Household
In terms of 4 or more vehicles in household, the demographic groups most similar to Cubans are Cajun (6.0%, a difference of 0.010%), Immigrants from Kenya (6.0%, a difference of 0.010%), Immigrants from Moldova (6.0%, a difference of 0.050%), Indonesian (6.0%, a difference of 0.080%), and Russian (6.0%, a difference of 0.34%).
| Demographics | Rating | Rank | 4 or more Vehicles in Household |
| Nigerians | 12.2 /100 | #217 | Poor 6.0% |
| Immigrants | Italy | 11.0 /100 | #218 | Poor 6.0% |
| Serbians | 11.0 /100 | #219 | Poor 6.0% |
| Russians | 10.3 /100 | #220 | Poor 6.0% |
| Immigrants | Moldova | 9.3 /100 | #221 | Tragic 6.0% |
| Cajuns | 9.2 /100 | #222 | Tragic 6.0% |
| Immigrants | Kenya | 9.2 /100 | #223 | Tragic 6.0% |
| Cubans | 9.2 /100 | #224 | Tragic 6.0% |
| Indonesians | 8.9 /100 | #225 | Tragic 6.0% |
| Immigrants | Singapore | 7.9 /100 | #226 | Tragic 5.9% |
| Immigrants | Western Asia | 7.8 /100 | #227 | Tragic 5.9% |
| Immigrants | Uganda | 7.5 /100 | #228 | Tragic 5.9% |
| Eastern Europeans | 6.8 /100 | #229 | Tragic 5.9% |
| Immigrants | Malaysia | 6.7 /100 | #230 | Tragic 5.9% |
| Immigrants | Switzerland | 6.4 /100 | #231 | Tragic 5.9% |
Demographics Similar to Immigrants from Cameroon by 4 or more Vehicles in Household
In terms of 4 or more vehicles in household, the demographic groups most similar to Immigrants from Cameroon are Immigrants from Pakistan (6.4%, a difference of 0.13%), Palestinian (6.4%, a difference of 0.15%), Indian (Asian) (6.4%, a difference of 0.21%), Zimbabwean (6.4%, a difference of 0.30%), and Chilean (6.4%, a difference of 0.34%).
| Demographics | Rating | Rank | 4 or more Vehicles in Household |
| Central American Indians | 71.1 /100 | #154 | Good 6.5% |
| Iroquois | 70.4 /100 | #155 | Good 6.5% |
| Iranians | 69.9 /100 | #156 | Good 6.5% |
| Peruvians | 69.4 /100 | #157 | Good 6.5% |
| Zimbabweans | 67.1 /100 | #158 | Good 6.4% |
| Indians (Asian) | 66.3 /100 | #159 | Good 6.4% |
| Palestinians | 65.8 /100 | #160 | Good 6.4% |
| Immigrants | Cameroon | 64.4 /100 | #161 | Good 6.4% |
| Immigrants | Pakistan | 63.2 /100 | #162 | Good 6.4% |
| Chileans | 61.2 /100 | #163 | Good 6.4% |
| Hungarians | 61.1 /100 | #164 | Good 6.4% |
| Immigrants | Peru | 59.8 /100 | #165 | Average 6.4% |
| Immigrants | Denmark | 57.8 /100 | #166 | Average 6.4% |
| Poles | 56.9 /100 | #167 | Average 6.4% |
| Lebanese | 55.8 /100 | #168 | Average 6.4% |