Thai vs Immigrants from Cameroon In Labor Force | Age 20-24

COMPARE

Thai
Race
Ancestry
AfghanAfricanAlaska NativeAlaskan AthabascanAlbanianAleutAlsatianAmericanApacheArabArapahoArgentineanArmenianAssyrian/Chaldean/SyriacAustralianAustrianBahamianBangladeshiBarbadianBasqueBelgianBelizeanBermudanBhutaneseBlackfeetBolivianBrazilianBritishBritish West IndianBulgarianBurmeseCajunCambodianCanadianCape VerdeanCarpatho RusynCelticCentral AmericanCentral American IndianCherokeeCheyenneChickasawChileanChineseChippewaChoctawColombianColvilleComancheCosta RicanCreeCreekCroatianCrowCubanCypriotCzechCzechoslovakianDanishDelawareDominicanDutchDutch West IndianEastern EuropeanEcuadorianEgyptianEnglishEstonianEthiopianEuropeanFijianFilipinoFinnishFrenchFrench American IndianFrench CanadianGermanGerman RussianGhanaianGreekGuamanian/ChamorroGuatemalanGuyaneseHaitianHmongHonduranHopiHoumaHungarianIcelanderIndian (Asian)IndonesianInupiatIranianIraqiIrishIroquoisIsraeliItalianJamaicanJapaneseJordanianKenyanKiowaKoreanLaotianLatvianLebaneseLiberianLithuanianLumbeeLuxembourgerMacedonianMalaysianMalteseMarshalleseMenomineeMexicanMexican American IndianMongolianMoroccanNative HawaiianNavajoNepaleseNew ZealanderNicaraguanNigerianNorthern EuropeanNorwegianOkinawanOsageOttawaPaiutePakistaniPalestinianPanamanianParaguayanPennsylvania GermanPeruvianPimaPolishPortuguesePotawatomiPuebloPuerto RicanPuget Sound SalishRomanianRussianSalvadoranSamoanScandinavianScotch-IrishScottishSeminoleSenegaleseSerbianShoshoneSierra LeoneanSiouxSlavicSlovakSloveneSomaliSouth AfricanSouth AmericanSouth American IndianSoviet UnionSpaniardSpanishSpanish AmericanSpanish American IndianSri LankanSubsaharan AfricanSudaneseSwedishSwissSyrianTaiwaneseThaiTlingit-HaidaTohono O'OdhamTonganTrinidadian and TobagonianTsimshianTurkishU.S. Virgin IslanderUgandanUkrainianUruguayanUteVenezuelanVietnameseWelshWest IndianYakamaYaquiYugoslavianYumanYup'ikZimbabwean
Immigration
NonimmigrantsImmigrantsAfghanistanAfricaAlbaniaArgentinaArmeniaAsiaAustraliaAustriaBahamasBangladeshBarbadosBelarusBelgiumBelizeBoliviaBosnia and HerzegovinaBrazilBulgariaBurma/MyanmarCabo VerdeCambodiaCanadaCaribbeanCentral AmericaChileChinaColombiaCongoCosta RicaCroatiaCubaCzechoslovakiaDenmarkDominicaDominican RepublicEastern AfricaEastern AsiaEastern EuropeEcuadorEgyptEl SalvadorEnglandEritreaEthiopiaEuropeFijiFranceGermanyGhanaGreeceGrenadaGuatemalaGuyanaHaitiHondurasHong KongHungaryIndiaIndonesiaIranIraqIrelandIsraelItalyJamaicaJapanJordanKazakhstanKenyaKoreaKuwaitLaosLatin AmericaLatviaLebanonLiberiaLithuaniaMalaysiaMexicoMicronesiaMiddle AfricaMoldovaMoroccoNepalNetherlandsNicaraguaNigeriaNorth AmericaNorth MacedoniaNorthern AfricaNorthern EuropeNorwayOceaniaPakistanPanamaPeruPhilippinesPolandPortugalRomaniaRussiaSaudi ArabiaScotlandSenegalSerbiaSierra LeoneSingaporeSomaliaSouth AfricaSouth AmericaSouth Central AsiaSouth Eastern AsiaSouthern EuropeSpainSri LankaSt. Vincent and the GrenadinesSudanSwedenSwitzerlandSyriaTaiwanThailandTrinidad and TobagoTurkeyUgandaUkraineUruguayUzbekistanVenezuelaVietnamWest IndiesWestern AfricaWestern AsiaWestern EuropeYemenZaireZimbabweAzores
Immigrants from Cameroon
Race
Ancestry
AfghanAfricanAlaska NativeAlaskan AthabascanAlbanianAleutAlsatianAmericanApacheArabArapahoArgentineanArmenianAssyrian/Chaldean/SyriacAustralianAustrianBahamianBangladeshiBarbadianBasqueBelgianBelizeanBermudanBhutaneseBlackfeetBolivianBrazilianBritishBritish West IndianBulgarianBurmeseCajunCambodianCanadianCape VerdeanCarpatho RusynCelticCentral AmericanCentral American IndianCherokeeCheyenneChickasawChileanChineseChippewaChoctawColombianColvilleComancheCosta RicanCreeCreekCroatianCrowCubanCypriotCzechCzechoslovakianDanishDelawareDominicanDutchDutch West IndianEastern EuropeanEcuadorianEgyptianEnglishEstonianEthiopianEuropeanFijianFilipinoFinnishFrenchFrench American IndianFrench CanadianGermanGerman RussianGhanaianGreekGuamanian/ChamorroGuatemalanGuyaneseHaitianHmongHonduranHopiHoumaHungarianIcelanderIndian (Asian)IndonesianInupiatIranianIraqiIrishIroquoisIsraeliItalianJamaicanJapaneseJordanianKenyanKiowaKoreanLaotianLatvianLebaneseLiberianLithuanianLumbeeLuxembourgerMacedonianMalaysianMalteseMarshalleseMenomineeMexicanMexican American IndianMongolianMoroccanNative HawaiianNavajoNepaleseNew ZealanderNicaraguanNigerianNorthern EuropeanNorwegianOkinawanOsageOttawaPaiutePakistaniPalestinianPanamanianParaguayanPennsylvania GermanPeruvianPimaPolishPortuguesePotawatomiPuebloPuerto RicanPuget Sound SalishRomanianRussianSalvadoranSamoanScandinavianScotch-IrishScottishSeminoleSenegaleseSerbianShoshoneSierra LeoneanSiouxSlavicSlovakSloveneSomaliSouth AfricanSouth AmericanSouth American IndianSoviet UnionSpaniardSpanishSpanish AmericanSpanish American IndianSri LankanSubsaharan AfricanSudaneseSwedishSwissSyrianTaiwaneseTlingit-HaidaTohono O'OdhamTonganTrinidadian and TobagonianTsimshianTurkishU.S. Virgin IslanderUgandanUkrainianUruguayanUteVenezuelanVietnameseWelshWest IndianYakamaYaquiYugoslavianYumanYup'ikZimbabwean
Immigration
NonimmigrantsImmigrantsAfghanistanAfricaAlbaniaArgentinaArmeniaAsiaAustraliaAustriaBahamasBangladeshBarbadosBelarusBelgiumBelizeBoliviaBosnia and HerzegovinaBrazilBulgariaBurma/MyanmarCabo VerdeCambodiaCameroonCanadaCaribbeanCentral AmericaChileChinaColombiaCongoCosta RicaCroatiaCubaCzechoslovakiaDenmarkDominicaDominican RepublicEastern AfricaEastern AsiaEastern EuropeEcuadorEgyptEl SalvadorEnglandEritreaEthiopiaEuropeFijiFranceGermanyGhanaGreeceGrenadaGuatemalaGuyanaHaitiHondurasHong KongHungaryIndiaIndonesiaIranIraqIrelandIsraelItalyJamaicaJapanJordanKazakhstanKenyaKoreaKuwaitLaosLatin AmericaLatviaLebanonLiberiaLithuaniaMalaysiaMexicoMicronesiaMiddle AfricaMoldovaMoroccoNepalNetherlandsNicaraguaNigeriaNorth AmericaNorth MacedoniaNorthern AfricaNorthern EuropeNorwayOceaniaPakistanPanamaPeruPhilippinesPolandPortugalRomaniaRussiaSaudi ArabiaScotlandSenegalSerbiaSierra LeoneSingaporeSomaliaSouth AfricaSouth AmericaSouth Central AsiaSouth Eastern AsiaSouthern EuropeSpainSri LankaSt. Vincent and the GrenadinesSudanSwedenSwitzerlandSyriaTaiwanThailandTrinidad and TobagoTurkeyUgandaUkraineUruguayUzbekistanVenezuelaVietnamWest IndiesWestern AfricaWestern AsiaWestern EuropeYemenZaireZimbabweAzores
In Labor Force | Age 20-24
Income
Poverty
Unemployment
Labor Participation
Family Structure
Vehicle Availability
Education Level
Disability

In Labor Force | Age 20-24 Comparison

Thais

Immigrants from Cameroon

Tragic
Exceptional
74.0%
IN LABOR FORCE | AGE 20-24
2.1/ 100
METRIC RATING
242nd/ 347
METRIC RANK
76.6%
IN LABOR FORCE | AGE 20-24
99.6/ 100
METRIC RATING
77th/ 347
METRIC RANK

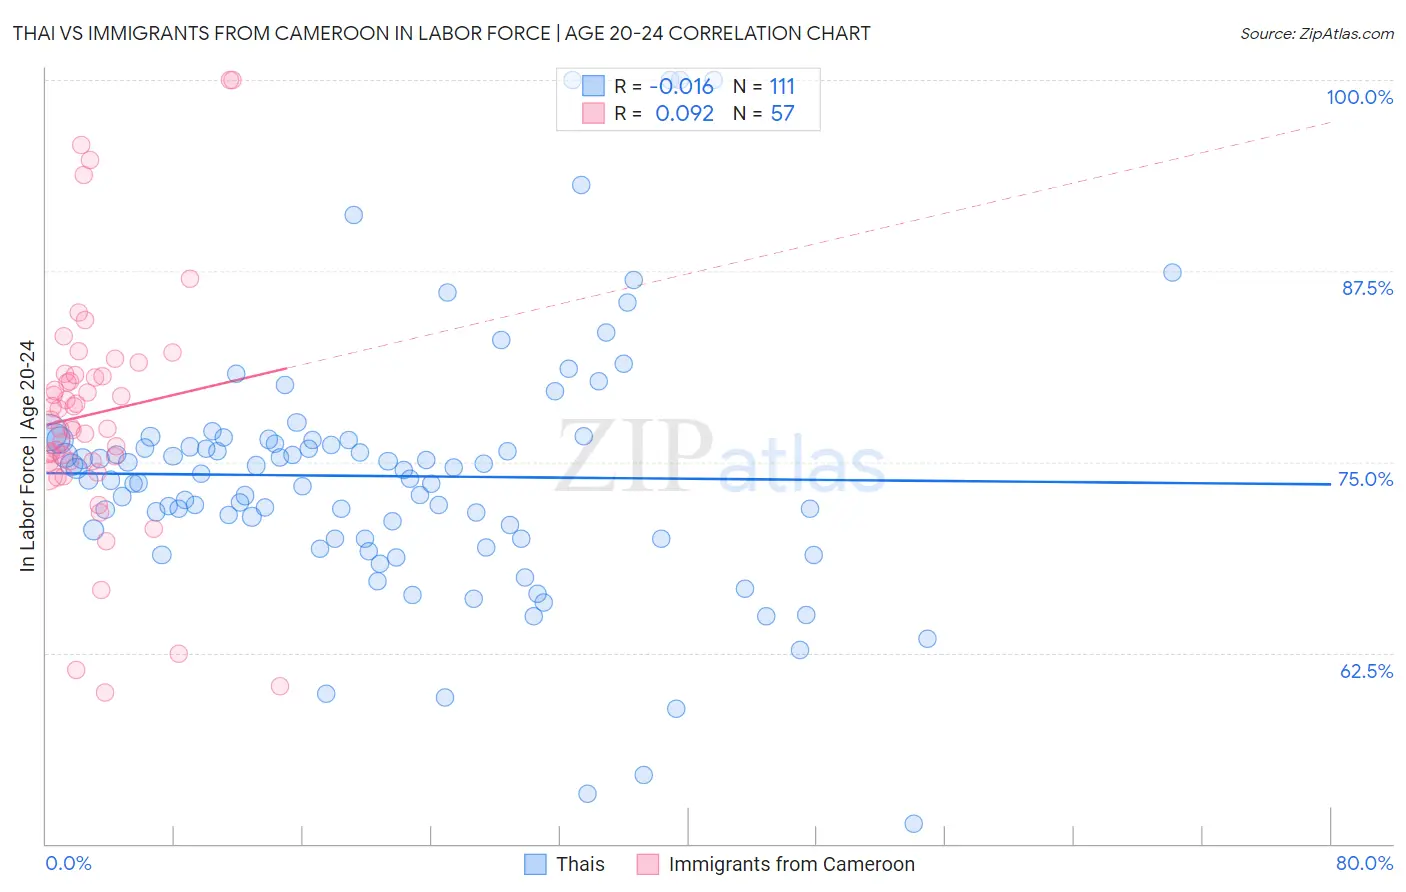
Thai vs Immigrants from Cameroon In Labor Force | Age 20-24 Correlation Chart

The statistical analysis conducted on geographies consisting of 475,671,796 people shows no correlation between the proportion of Thais and labor force participation rate among population between the ages 20 and 24 in the United States with a correlation coefficient (R) of -0.016 and weighted average of 74.0%. Similarly, the statistical analysis conducted on geographies consisting of 130,759,306 people shows a slight positive correlation between the proportion of Immigrants from Cameroon and labor force participation rate among population between the ages 20 and 24 in the United States with a correlation coefficient (R) of 0.092 and weighted average of 76.6%, a difference of 3.5%.
Thai vs Immigrants from Cameroon In Labor Force | Age 20-24

In Labor Force | Age 20-24 Correlation Summary

MeasurementThaiImmigrants from Cameroon
Minimum51.3%59.9%
Maximum100.0%100.0%
Range48.7%40.1%
Mean74.1%78.2%
Median73.9%77.8%
Interquartile 25% (IQ1)70.0%75.0%
Interquartile 75% (IQ3)76.5%80.7%
Interquartile Range (IQR)6.5%5.8%
Standard Deviation (Sample)8.4%8.2%
Standard Deviation (Population)8.3%8.1%

Similar Demographics by In Labor Force | Age 20-24

Demographics Similar to Thais by In Labor Force | Age 20-24

In terms of in labor force | age 20-24, the demographic groups most similar to Thais are Immigrants from Senegal (74.0%, a difference of 0.010%), Immigrants from Syria (74.0%, a difference of 0.030%), Immigrants from Sri Lanka (74.0%, a difference of 0.040%), Immigrants from South Central Asia (74.0%, a difference of 0.040%), and Turkish (73.9%, a difference of 0.060%).
DemographicsRating | RankIn Labor Force | Age 20-24
Laotians
3.5
/100
|
#235
Tragic
74.1%
Immigrants | France
3.3
/100
|
#236
Tragic
74.1%
Bermudans
3.2
/100
|
#237
Tragic
74.1%
Immigrants | Japan
3.0
/100
|
#238
Tragic
74.1%
Immigrants | Latin America
2.7
/100
|
#239
Tragic
74.1%
Immigrants | Sri Lanka
2.3
/100
|
#240
Tragic
74.0%
Immigrants | Senegal
2.1
/100
|
#241
Tragic
74.0%
Thais
2.1
/100
|
#242
Tragic
74.0%
Immigrants | Syria
1.9
/100
|
#243
Tragic
74.0%
Immigrants | South Central Asia
1.9
/100
|
#244
Tragic
74.0%
Turks
1.8
/100
|
#245
Tragic
73.9%
Immigrants | Panama
1.6
/100
|
#246
Tragic
73.9%
Colville
1.5
/100
|
#247
Tragic
73.9%
Immigrants | Saudi Arabia
1.5
/100
|
#248
Tragic
73.9%
Blacks/African Americans
1.3
/100
|
#249
Tragic
73.9%

Demographics Similar to Immigrants from Cameroon by In Labor Force | Age 20-24

In terms of in labor force | age 20-24, the demographic groups most similar to Immigrants from Cameroon are Canadian (76.6%, a difference of 0.0%), Immigrants from Zaire (76.6%, a difference of 0.020%), Immigrants from Moldova (76.6%, a difference of 0.030%), Italian (76.5%, a difference of 0.050%), and Immigrants from Middle Africa (76.6%, a difference of 0.070%).
DemographicsRating | RankIn Labor Force | Age 20-24
Ottawa
99.8
/100
|
#70
Exceptional
76.8%
Northern Europeans
99.8
/100
|
#71
Exceptional
76.8%
Guamanians/Chamorros
99.8
/100
|
#72
Exceptional
76.7%
British
99.8
/100
|
#73
Exceptional
76.7%
Cree
99.7
/100
|
#74
Exceptional
76.6%
Immigrants | Middle Africa
99.7
/100
|
#75
Exceptional
76.6%
Immigrants | Moldova
99.6
/100
|
#76
Exceptional
76.6%
Immigrants | Cameroon
99.6
/100
|
#77
Exceptional
76.6%
Canadians
99.6
/100
|
#78
Exceptional
76.6%
Immigrants | Zaire
99.6
/100
|
#79
Exceptional
76.6%
Italians
99.6
/100
|
#80
Exceptional
76.5%
Basques
99.5
/100
|
#81
Exceptional
76.5%
Hmong
99.5
/100
|
#82
Exceptional
76.5%
Carpatho Rusyns
99.4
/100
|
#83
Exceptional
76.5%
Austrians
99.4
/100
|
#84
Exceptional
76.5%