Thai vs Immigrants from Scotland 4 or more Vehicles in Household
COMPARE
Thai
Immigrants from Scotland
4 or more Vehicles in Household
4 or more Vehicles in Household Comparison
Thais
Immigrants from Scotland
6.2%
4 OR MORE VEHICLES IN HOUSEHOLD
36.9/ 100
METRIC RATING
185th/ 347
METRIC RANK
6.7%
4 OR MORE VEHICLES IN HOUSEHOLD
89.0/ 100
METRIC RATING
130th/ 347
METRIC RANK
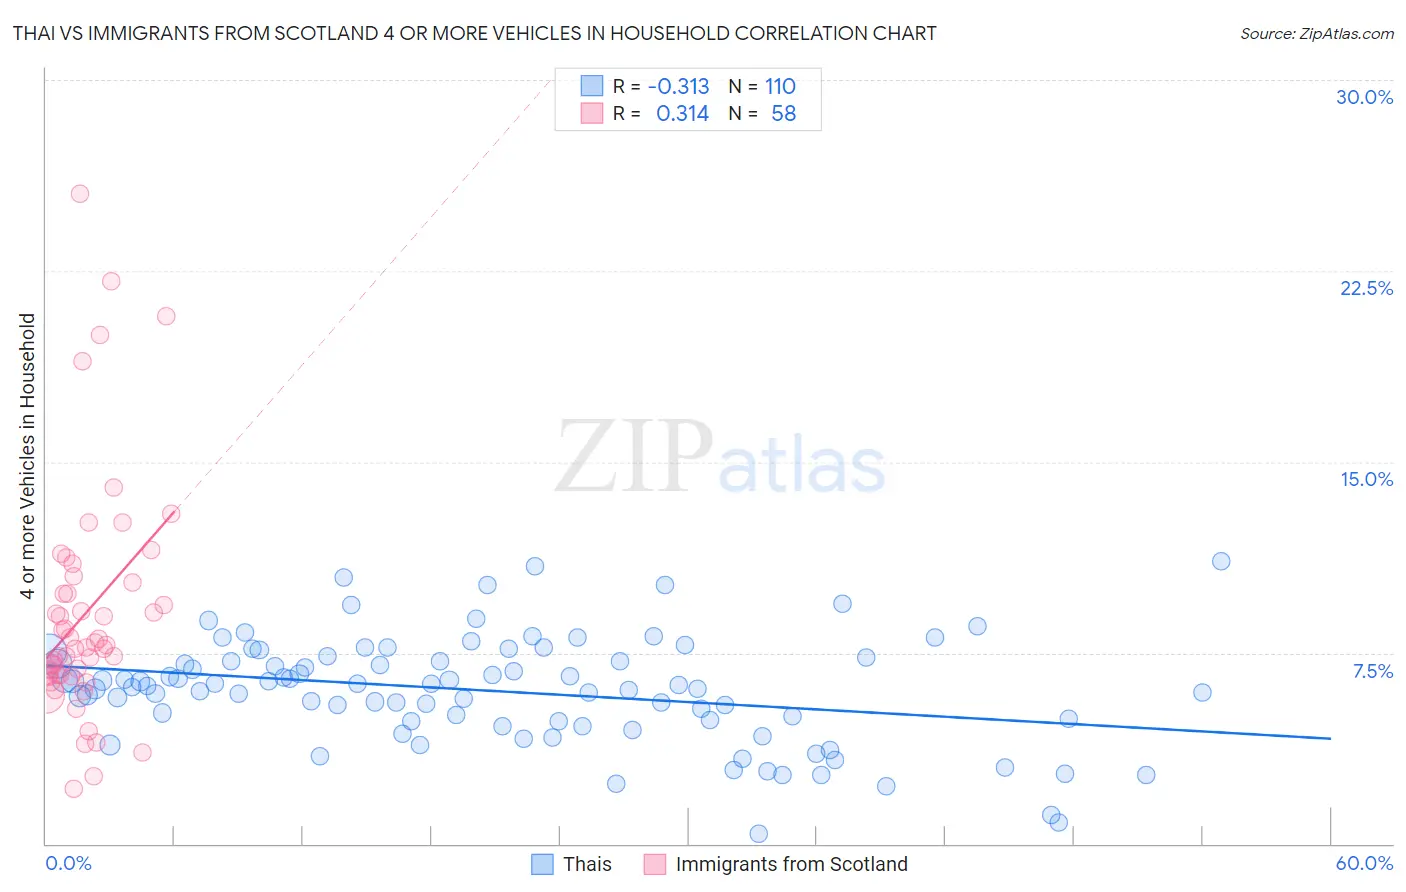
Thai vs Immigrants from Scotland 4 or more Vehicles in Household Correlation Chart
The statistical analysis conducted on geographies consisting of 473,279,987 people shows a mild negative correlation between the proportion of Thais and percentage of households with 4 or more vehicles available in the United States with a correlation coefficient (R) of -0.313 and weighted average of 6.2%. Similarly, the statistical analysis conducted on geographies consisting of 195,944,485 people shows a mild positive correlation between the proportion of Immigrants from Scotland and percentage of households with 4 or more vehicles available in the United States with a correlation coefficient (R) of 0.314 and weighted average of 6.7%, a difference of 6.8%.
4 or more Vehicles in Household Correlation Summary
| Measurement | Thai | Immigrants from Scotland |
| Minimum | 0.38% | 2.2% |
| Maximum | 11.1% | 25.6% |
| Range | 10.7% | 23.4% |
| Mean | 6.0% | 9.1% |
| Median | 6.2% | 7.7% |
| Interquartile 25% (IQ1) | 4.8% | 6.6% |
| Interquartile 75% (IQ3) | 7.2% | 10.3% |
| Interquartile Range (IQR) | 2.3% | 3.6% |
| Standard Deviation (Sample) | 2.1% | 4.6% |
| Standard Deviation (Population) | 2.1% | 4.6% |
Similar Demographics by 4 or more Vehicles in Household
Demographics Similar to Thais by 4 or more Vehicles in Household
In terms of 4 or more vehicles in household, the demographic groups most similar to Thais are Immigrants from Northern Europe (6.2%, a difference of 0.020%), Iraqi (6.2%, a difference of 0.040%), Immigrants from Burma/Myanmar (6.2%, a difference of 0.060%), Immigrants from South Africa (6.2%, a difference of 0.17%), and Kiowa (6.2%, a difference of 0.25%).
| Demographics | Rating | Rank | 4 or more Vehicles in Household |
| Belizeans | 44.5 /100 | #178 | Average 6.3% |
| Immigrants | Japan | 43.1 /100 | #179 | Average 6.3% |
| Syrians | 42.0 /100 | #180 | Average 6.3% |
| Yugoslavians | 41.1 /100 | #181 | Average 6.3% |
| South American Indians | 40.7 /100 | #182 | Average 6.3% |
| Immigrants | Burma/Myanmar | 37.5 /100 | #183 | Fair 6.2% |
| Iraqis | 37.3 /100 | #184 | Fair 6.2% |
| Thais | 36.9 /100 | #185 | Fair 6.2% |
| Immigrants | Northern Europe | 36.8 /100 | #186 | Fair 6.2% |
| Immigrants | South Africa | 35.4 /100 | #187 | Fair 6.2% |
| Kiowa | 34.7 /100 | #188 | Fair 6.2% |
| Immigrants | Eastern Asia | 33.3 /100 | #189 | Fair 6.2% |
| South Africans | 32.2 /100 | #190 | Fair 6.2% |
| Inupiat | 30.7 /100 | #191 | Fair 6.2% |
| Romanians | 30.7 /100 | #192 | Fair 6.2% |
Demographics Similar to Immigrants from Scotland by 4 or more Vehicles in Household
In terms of 4 or more vehicles in household, the demographic groups most similar to Immigrants from Scotland are Maltese (6.7%, a difference of 0.15%), Immigrants from Netherlands (6.6%, a difference of 0.29%), Armenian (6.6%, a difference of 0.48%), Ottawa (6.6%, a difference of 0.50%), and Tohono O'odham (6.6%, a difference of 0.53%).
| Demographics | Rating | Rank | 4 or more Vehicles in Household |
| Immigrants | Immigrants | 94.6 /100 | #123 | Exceptional 6.8% |
| Immigrants | Asia | 94.4 /100 | #124 | Exceptional 6.8% |
| Austrians | 94.1 /100 | #125 | Exceptional 6.8% |
| Belgians | 94.1 /100 | #126 | Exceptional 6.8% |
| Immigrants | Korea | 93.8 /100 | #127 | Exceptional 6.8% |
| Immigrants | Bolivia | 92.5 /100 | #128 | Exceptional 6.7% |
| Immigrants | England | 92.0 /100 | #129 | Exceptional 6.7% |
| Immigrants | Scotland | 89.0 /100 | #130 | Excellent 6.7% |
| Maltese | 88.4 /100 | #131 | Excellent 6.7% |
| Immigrants | Netherlands | 87.8 /100 | #132 | Excellent 6.6% |
| Armenians | 86.9 /100 | #133 | Excellent 6.6% |
| Ottawa | 86.9 /100 | #134 | Excellent 6.6% |
| Tohono O'odham | 86.7 /100 | #135 | Excellent 6.6% |
| Luxembourgers | 86.4 /100 | #136 | Excellent 6.6% |
| French Canadians | 85.4 /100 | #137 | Excellent 6.6% |