Thai vs Syrian 4 or more Vehicles in Household
COMPARE
Thai
Syrian
4 or more Vehicles in Household
4 or more Vehicles in Household Comparison
Thais
Syrians
6.2%
4 OR MORE VEHICLES IN HOUSEHOLD
36.9/ 100
METRIC RATING
185th/ 347
METRIC RANK
6.3%
4 OR MORE VEHICLES IN HOUSEHOLD
42.0/ 100
METRIC RATING
180th/ 347
METRIC RANK
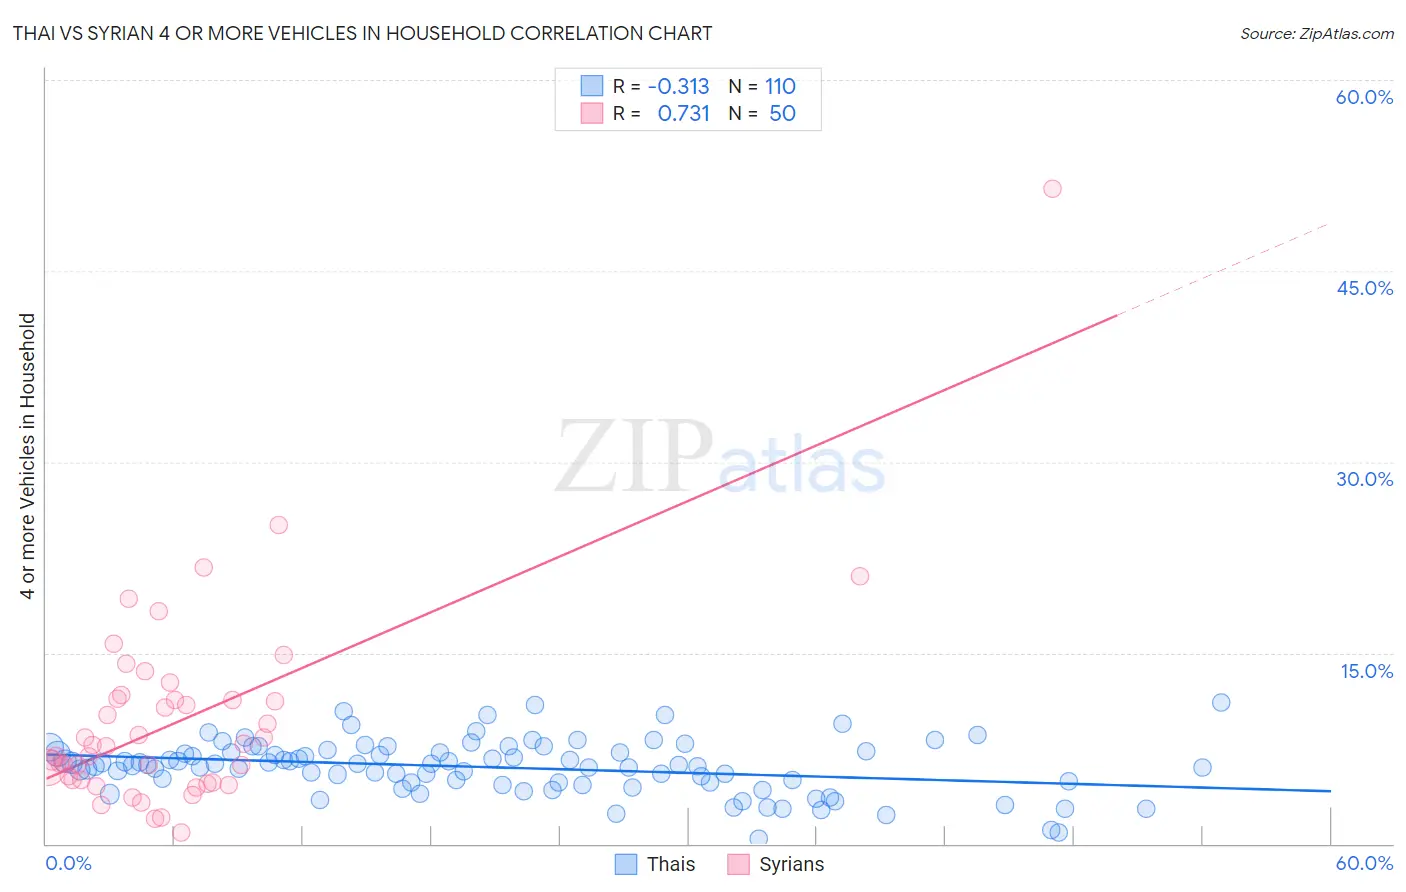
Thai vs Syrian 4 or more Vehicles in Household Correlation Chart
The statistical analysis conducted on geographies consisting of 473,279,987 people shows a mild negative correlation between the proportion of Thais and percentage of households with 4 or more vehicles available in the United States with a correlation coefficient (R) of -0.313 and weighted average of 6.2%. Similarly, the statistical analysis conducted on geographies consisting of 265,313,464 people shows a strong positive correlation between the proportion of Syrians and percentage of households with 4 or more vehicles available in the United States with a correlation coefficient (R) of 0.731 and weighted average of 6.3%, a difference of 0.54%.
4 or more Vehicles in Household Correlation Summary
| Measurement | Thai | Syrian |
| Minimum | 0.38% | 0.87% |
| Maximum | 11.1% | 51.4% |
| Range | 10.7% | 50.6% |
| Mean | 6.0% | 9.8% |
| Median | 6.2% | 7.7% |
| Interquartile 25% (IQ1) | 4.8% | 5.0% |
| Interquartile 75% (IQ3) | 7.2% | 11.4% |
| Interquartile Range (IQR) | 2.3% | 6.4% |
| Standard Deviation (Sample) | 2.1% | 8.1% |
| Standard Deviation (Population) | 2.1% | 8.0% |
Demographics Similar to Thais and Syrians by 4 or more Vehicles in Household
In terms of 4 or more vehicles in household, the demographic groups most similar to Thais are Immigrants from Northern Europe (6.2%, a difference of 0.020%), Iraqi (6.2%, a difference of 0.040%), Immigrants from Burma/Myanmar (6.2%, a difference of 0.060%), Immigrants from South Africa (6.2%, a difference of 0.17%), and Kiowa (6.2%, a difference of 0.25%). Similarly, the demographic groups most similar to Syrians are Yugoslavian (6.3%, a difference of 0.090%), Immigrants from Japan (6.3%, a difference of 0.11%), South American Indian (6.3%, a difference of 0.14%), Belizean (6.3%, a difference of 0.27%), and Immigrants from Burma/Myanmar (6.2%, a difference of 0.48%).
| Demographics | Rating | Rank | 4 or more Vehicles in Household |
| Immigrants | Lebanon | 51.7 /100 | #172 | Average 6.3% |
| Slovenes | 51.1 /100 | #173 | Average 6.3% |
| Lithuanians | 50.0 /100 | #174 | Average 6.3% |
| Immigrants | Western Europe | 48.8 /100 | #175 | Average 6.3% |
| Ukrainians | 47.6 /100 | #176 | Average 6.3% |
| Slovaks | 46.9 /100 | #177 | Average 6.3% |
| Belizeans | 44.5 /100 | #178 | Average 6.3% |
| Immigrants | Japan | 43.1 /100 | #179 | Average 6.3% |
| Syrians | 42.0 /100 | #180 | Average 6.3% |
| Yugoslavians | 41.1 /100 | #181 | Average 6.3% |
| South American Indians | 40.7 /100 | #182 | Average 6.3% |
| Immigrants | Burma/Myanmar | 37.5 /100 | #183 | Fair 6.2% |
| Iraqis | 37.3 /100 | #184 | Fair 6.2% |
| Thais | 36.9 /100 | #185 | Fair 6.2% |
| Immigrants | Northern Europe | 36.8 /100 | #186 | Fair 6.2% |
| Immigrants | South Africa | 35.4 /100 | #187 | Fair 6.2% |
| Kiowa | 34.7 /100 | #188 | Fair 6.2% |
| Immigrants | Eastern Asia | 33.3 /100 | #189 | Fair 6.2% |
| South Africans | 32.2 /100 | #190 | Fair 6.2% |
| Inupiat | 30.7 /100 | #191 | Fair 6.2% |
| Romanians | 30.7 /100 | #192 | Fair 6.2% |