Mexican vs Immigrants from Cameroon 4 or more Vehicles in Household
COMPARE
Mexican
Immigrants from Cameroon
4 or more Vehicles in Household
4 or more Vehicles in Household Comparison
Mexicans
Immigrants from Cameroon
8.9%
4 OR MORE VEHICLES IN HOUSEHOLD
100.0/ 100
METRIC RATING
12th/ 347
METRIC RANK
6.4%
4 OR MORE VEHICLES IN HOUSEHOLD
64.4/ 100
METRIC RATING
161st/ 347
METRIC RANK
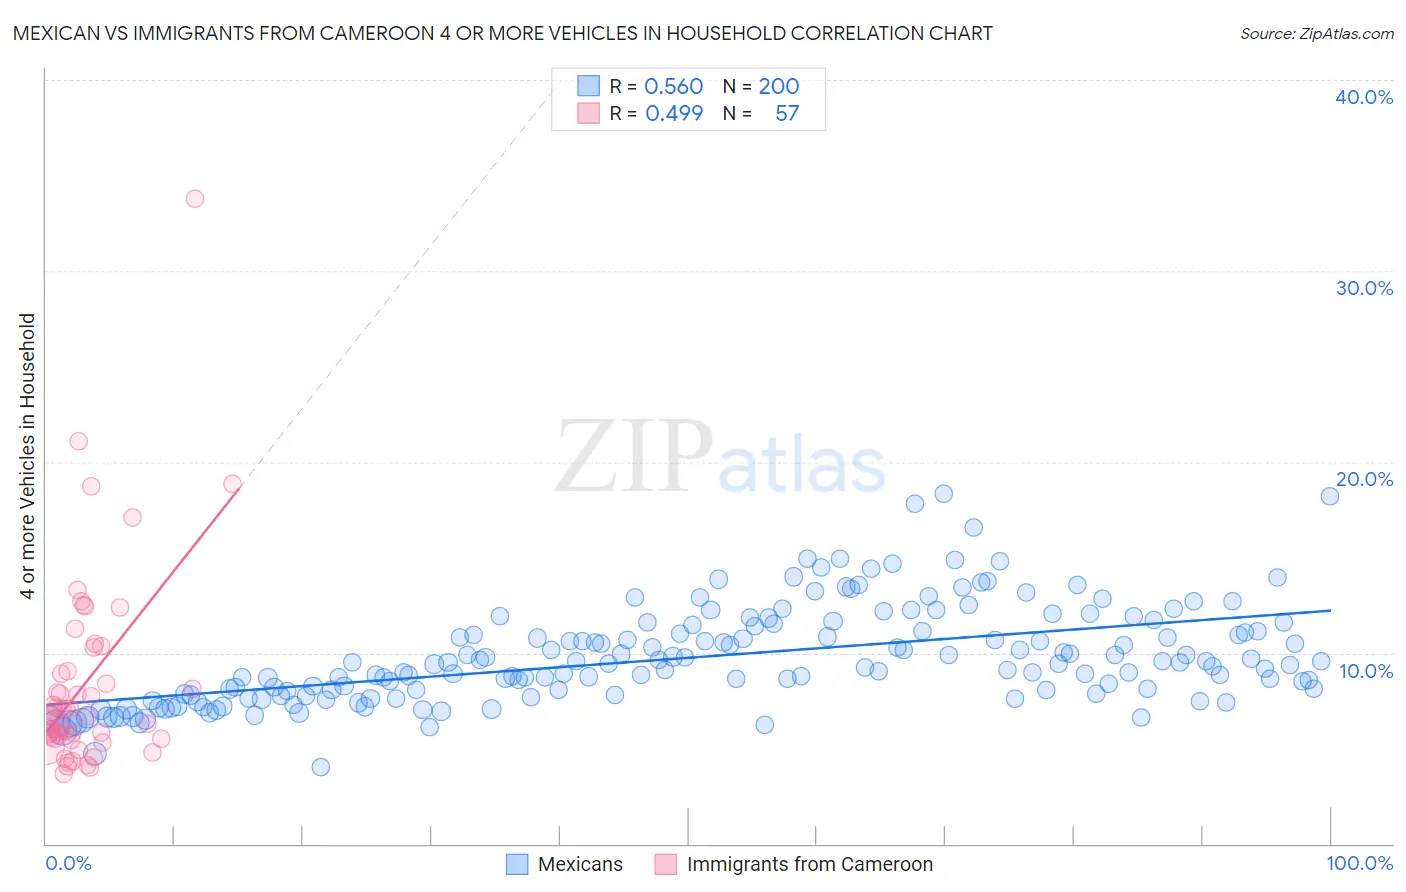
Mexican vs Immigrants from Cameroon 4 or more Vehicles in Household Correlation Chart
The statistical analysis conducted on geographies consisting of 561,781,300 people shows a substantial positive correlation between the proportion of Mexicans and percentage of households with 4 or more vehicles available in the United States with a correlation coefficient (R) of 0.560 and weighted average of 8.9%. Similarly, the statistical analysis conducted on geographies consisting of 130,454,294 people shows a moderate positive correlation between the proportion of Immigrants from Cameroon and percentage of households with 4 or more vehicles available in the United States with a correlation coefficient (R) of 0.499 and weighted average of 6.4%, a difference of 39.2%.
4 or more Vehicles in Household Correlation Summary
| Measurement | Mexican | Immigrants from Cameroon |
| Minimum | 4.0% | 3.7% |
| Maximum | 18.4% | 33.8% |
| Range | 14.3% | 30.1% |
| Mean | 9.7% | 8.4% |
| Median | 9.4% | 6.7% |
| Interquartile 25% (IQ1) | 7.8% | 5.5% |
| Interquartile 75% (IQ3) | 11.1% | 9.6% |
| Interquartile Range (IQR) | 3.3% | 4.1% |
| Standard Deviation (Sample) | 2.5% | 5.2% |
| Standard Deviation (Population) | 2.5% | 5.2% |
Similar Demographics by 4 or more Vehicles in Household
Demographics Similar to Mexicans by 4 or more Vehicles in Household
In terms of 4 or more vehicles in household, the demographic groups most similar to Mexicans are Hawaiian (8.9%, a difference of 0.010%), Immigrants from Mexico (9.0%, a difference of 0.68%), Paiute (9.0%, a difference of 0.80%), Chinese (8.8%, a difference of 1.0%), and Shoshone (8.8%, a difference of 1.0%).
| Demographics | Rating | Rank | 4 or more Vehicles in Household |
| Immigrants | Fiji | 100.0 /100 | #5 | Exceptional 9.6% |
| Puget Sound Salish | 100.0 /100 | #6 | Exceptional 9.4% |
| Native Hawaiians | 100.0 /100 | #7 | Exceptional 9.4% |
| Arapaho | 100.0 /100 | #8 | Exceptional 9.4% |
| Samoans | 100.0 /100 | #9 | Exceptional 9.2% |
| Paiute | 100.0 /100 | #10 | Exceptional 9.0% |
| Immigrants | Mexico | 100.0 /100 | #11 | Exceptional 9.0% |
| Mexicans | 100.0 /100 | #12 | Exceptional 8.9% |
| Hawaiians | 100.0 /100 | #13 | Exceptional 8.9% |
| Chinese | 100.0 /100 | #14 | Exceptional 8.8% |
| Shoshone | 100.0 /100 | #15 | Exceptional 8.8% |
| Lumbee | 100.0 /100 | #16 | Exceptional 8.8% |
| Ute | 100.0 /100 | #17 | Exceptional 8.8% |
| Nepalese | 100.0 /100 | #18 | Exceptional 8.7% |
| Koreans | 100.0 /100 | #19 | Exceptional 8.6% |
Demographics Similar to Immigrants from Cameroon by 4 or more Vehicles in Household
In terms of 4 or more vehicles in household, the demographic groups most similar to Immigrants from Cameroon are Immigrants from Pakistan (6.4%, a difference of 0.13%), Palestinian (6.4%, a difference of 0.15%), Indian (Asian) (6.4%, a difference of 0.21%), Zimbabwean (6.4%, a difference of 0.30%), and Chilean (6.4%, a difference of 0.34%).
| Demographics | Rating | Rank | 4 or more Vehicles in Household |
| Central American Indians | 71.1 /100 | #154 | Good 6.5% |
| Iroquois | 70.4 /100 | #155 | Good 6.5% |
| Iranians | 69.9 /100 | #156 | Good 6.5% |
| Peruvians | 69.4 /100 | #157 | Good 6.5% |
| Zimbabweans | 67.1 /100 | #158 | Good 6.4% |
| Indians (Asian) | 66.3 /100 | #159 | Good 6.4% |
| Palestinians | 65.8 /100 | #160 | Good 6.4% |
| Immigrants | Cameroon | 64.4 /100 | #161 | Good 6.4% |
| Immigrants | Pakistan | 63.2 /100 | #162 | Good 6.4% |
| Chileans | 61.2 /100 | #163 | Good 6.4% |
| Hungarians | 61.1 /100 | #164 | Good 6.4% |
| Immigrants | Peru | 59.8 /100 | #165 | Average 6.4% |
| Immigrants | Denmark | 57.8 /100 | #166 | Average 6.4% |
| Poles | 56.9 /100 | #167 | Average 6.4% |
| Lebanese | 55.8 /100 | #168 | Average 6.4% |