Thai vs Immigrants from Cameroon Average Family Size
COMPARE
Thai
Immigrants from Cameroon
Average Family Size
Average Family Size Comparison
Thais
Immigrants from Cameroon
3.22
AVERAGE FAMILY SIZE
38.3/ 100
METRIC RATING
188th/ 347
METRIC RANK
3.30
AVERAGE FAMILY SIZE
99.2/ 100
METRIC RATING
92nd/ 347
METRIC RANK
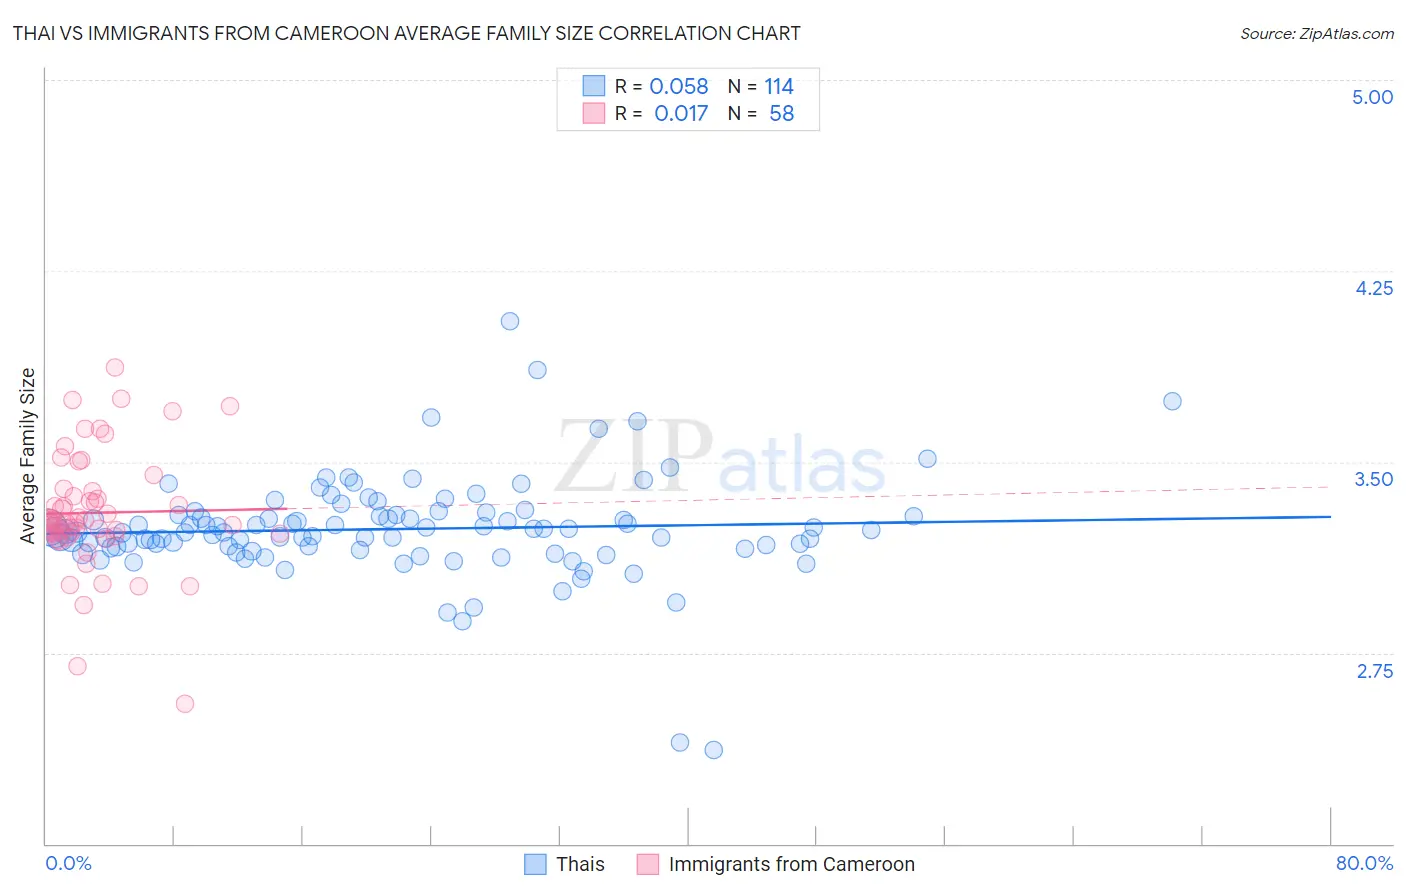
Thai vs Immigrants from Cameroon Average Family Size Correlation Chart
The statistical analysis conducted on geographies consisting of 475,374,663 people shows a slight positive correlation between the proportion of Thais and average family size in the United States with a correlation coefficient (R) of 0.058 and weighted average of 3.22. Similarly, the statistical analysis conducted on geographies consisting of 130,723,940 people shows no correlation between the proportion of Immigrants from Cameroon and average family size in the United States with a correlation coefficient (R) of 0.017 and weighted average of 3.30, a difference of 2.4%.
Average Family Size Correlation Summary
| Measurement | Thai | Immigrants from Cameroon |
| Minimum | 2.37 | 2.55 |
| Maximum | 4.05 | 3.87 |
| Range | 1.68 | 1.32 |
| Mean | 3.24 | 3.30 |
| Median | 3.22 | 3.26 |
| Interquartile 25% (IQ1) | 3.16 | 3.22 |
| Interquartile 75% (IQ3) | 3.29 | 3.38 |
| Interquartile Range (IQR) | 0.13 | 0.17 |
| Standard Deviation (Sample) | 0.20 | 0.24 |
| Standard Deviation (Population) | 0.20 | 0.23 |
Similar Demographics by Average Family Size
Demographics Similar to Thais by Average Family Size
In terms of average family size, the demographic groups most similar to Thais are Immigrants from Malaysia (3.22, a difference of 0.010%), Immigrants from Sri Lanka (3.22, a difference of 0.030%), Immigrants from Argentina (3.22, a difference of 0.030%), Immigrants from Eastern Asia (3.22, a difference of 0.050%), and Immigrants from Northern Africa (3.22, a difference of 0.070%).
| Demographics | Rating | Rank | Average Family Size |
| Spanish | 44.8 /100 | #181 | Average 3.23 |
| Moroccans | 44.2 /100 | #182 | Average 3.22 |
| Immigrants | Northern Africa | 41.7 /100 | #183 | Average 3.22 |
| Immigrants | Eastern Asia | 40.8 /100 | #184 | Average 3.22 |
| Immigrants | Sri Lanka | 39.8 /100 | #185 | Fair 3.22 |
| Immigrants | Argentina | 39.8 /100 | #186 | Fair 3.22 |
| Immigrants | Malaysia | 39.0 /100 | #187 | Fair 3.22 |
| Thais | 38.3 /100 | #188 | Fair 3.22 |
| Pakistanis | 33.7 /100 | #189 | Fair 3.22 |
| Burmese | 31.0 /100 | #190 | Fair 3.22 |
| Immigrants | Zaire | 30.5 /100 | #191 | Fair 3.22 |
| Immigrants | Eastern Africa | 30.1 /100 | #192 | Fair 3.22 |
| Immigrants | Israel | 29.3 /100 | #193 | Fair 3.22 |
| Immigrants | Sudan | 29.1 /100 | #194 | Fair 3.22 |
| Choctaw | 28.3 /100 | #195 | Fair 3.21 |
Demographics Similar to Immigrants from Cameroon by Average Family Size
In terms of average family size, the demographic groups most similar to Immigrants from Cameroon are Immigrants from Pakistan (3.30, a difference of 0.010%), Peruvian (3.30, a difference of 0.010%), Sierra Leonean (3.30, a difference of 0.11%), Immigrants from Lebanon (3.30, a difference of 0.12%), and Menominee (3.30, a difference of 0.16%).
| Demographics | Rating | Rank | Average Family Size |
| Afghans | 99.7 /100 | #85 | Exceptional 3.31 |
| Jamaicans | 99.7 /100 | #86 | Exceptional 3.31 |
| Immigrants | Peru | 99.7 /100 | #87 | Exceptional 3.31 |
| Immigrants | Bolivia | 99.6 /100 | #88 | Exceptional 3.31 |
| Malaysians | 99.6 /100 | #89 | Exceptional 3.31 |
| Menominee | 99.4 /100 | #90 | Exceptional 3.30 |
| Immigrants | Pakistan | 99.2 /100 | #91 | Exceptional 3.30 |
| Immigrants | Cameroon | 99.2 /100 | #92 | Exceptional 3.30 |
| Peruvians | 99.2 /100 | #93 | Exceptional 3.30 |
| Sierra Leoneans | 99.0 /100 | #94 | Exceptional 3.30 |
| Immigrants | Lebanon | 99.0 /100 | #95 | Exceptional 3.30 |
| U.S. Virgin Islanders | 98.8 /100 | #96 | Exceptional 3.29 |
| Immigrants | Oceania | 98.7 /100 | #97 | Exceptional 3.29 |
| Barbadians | 98.6 /100 | #98 | Exceptional 3.29 |
| Nigerians | 98.6 /100 | #99 | Exceptional 3.29 |