Taiwanese vs Samoan 3 or more Vehicles in Household
COMPARE
Taiwanese
Samoan
3 or more Vehicles in Household
3 or more Vehicles in Household Comparison
Taiwanese
Samoans
20.0%
3 OR MORE VEHICLES IN HOUSEHOLD
80.6/ 100
METRIC RATING
151st/ 347
METRIC RANK
25.0%
3 OR MORE VEHICLES IN HOUSEHOLD
100.0/ 100
METRIC RATING
8th/ 347
METRIC RANK
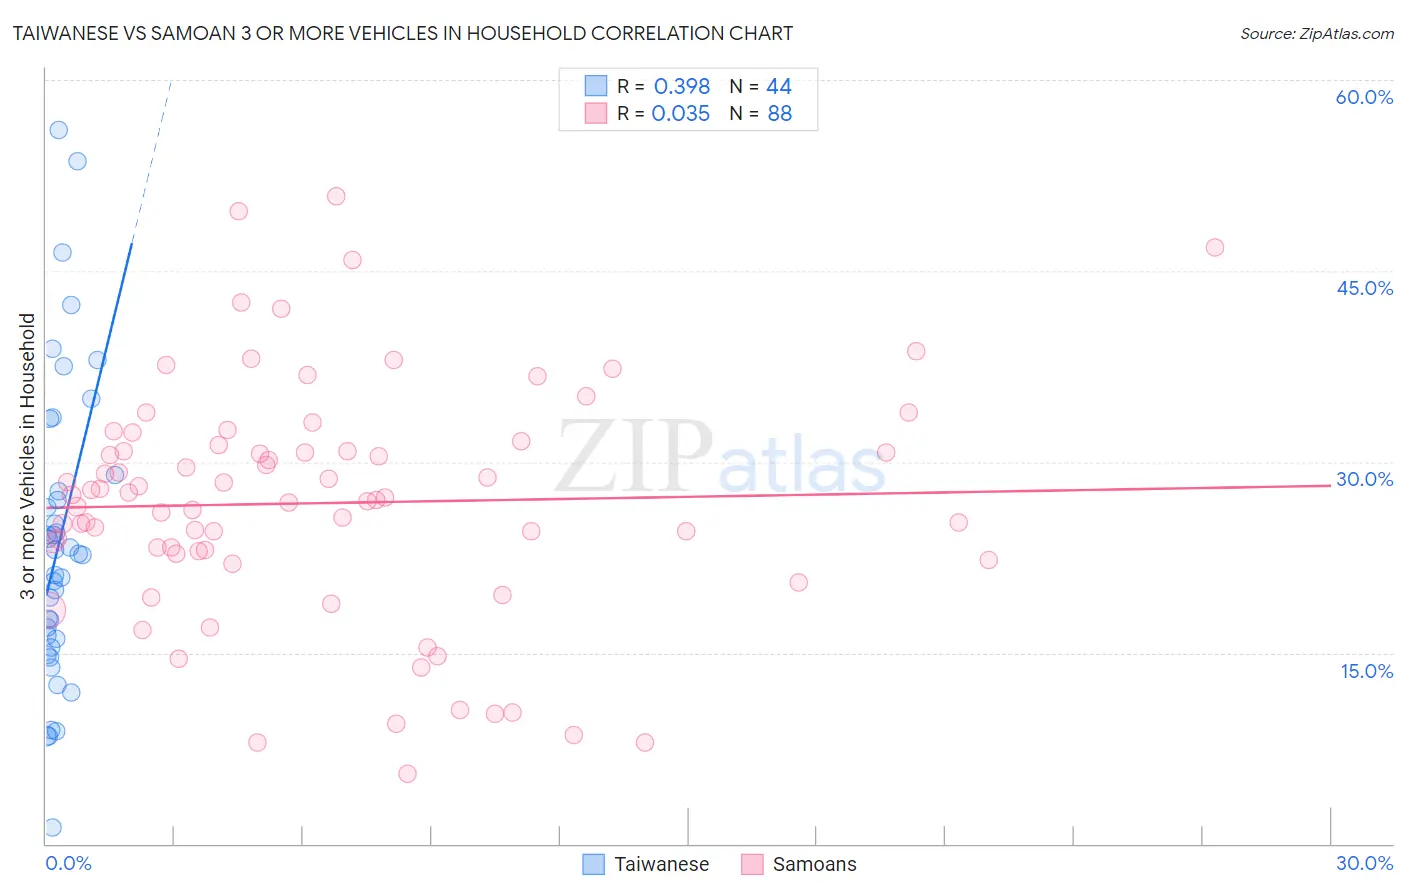
Taiwanese vs Samoan 3 or more Vehicles in Household Correlation Chart
The statistical analysis conducted on geographies consisting of 31,709,765 people shows a mild positive correlation between the proportion of Taiwanese and percentage of households with 3 or more vehicles available in the United States with a correlation coefficient (R) of 0.398 and weighted average of 20.0%. Similarly, the statistical analysis conducted on geographies consisting of 225,062,893 people shows no correlation between the proportion of Samoans and percentage of households with 3 or more vehicles available in the United States with a correlation coefficient (R) of 0.035 and weighted average of 25.0%, a difference of 24.7%.
3 or more Vehicles in Household Correlation Summary
| Measurement | Taiwanese | Samoan |
| Minimum | 1.3% | 5.5% |
| Maximum | 56.1% | 50.9% |
| Range | 54.8% | 45.4% |
| Mean | 23.7% | 26.8% |
| Median | 22.7% | 27.1% |
| Interquartile 25% (IQ1) | 15.8% | 22.9% |
| Interquartile 75% (IQ3) | 28.3% | 31.1% |
| Interquartile Range (IQR) | 12.5% | 8.2% |
| Standard Deviation (Sample) | 11.9% | 9.3% |
| Standard Deviation (Population) | 11.8% | 9.2% |
Similar Demographics by 3 or more Vehicles in Household
Demographics Similar to Taiwanese by 3 or more Vehicles in Household
In terms of 3 or more vehicles in household, the demographic groups most similar to Taiwanese are Immigrants (20.0%, a difference of 0.020%), Immigrants from Iran (20.0%, a difference of 0.030%), Lebanese (20.0%, a difference of 0.10%), Guatemalan (20.1%, a difference of 0.24%), and Slovak (20.1%, a difference of 0.29%).
| Demographics | Rating | Rank | 3 or more Vehicles in Household |
| Iranians | 84.0 /100 | #144 | Excellent 20.1% |
| Palestinians | 83.9 /100 | #145 | Excellent 20.1% |
| Australians | 83.6 /100 | #146 | Excellent 20.1% |
| Slovaks | 83.0 /100 | #147 | Excellent 20.1% |
| Guatemalans | 82.6 /100 | #148 | Excellent 20.1% |
| Immigrants | Iran | 80.9 /100 | #149 | Excellent 20.0% |
| Immigrants | Immigrants | 80.8 /100 | #150 | Excellent 20.0% |
| Taiwanese | 80.6 /100 | #151 | Excellent 20.0% |
| Lebanese | 79.8 /100 | #152 | Good 20.0% |
| Yuman | 75.6 /100 | #153 | Good 19.9% |
| Immigrants | Jordan | 75.0 /100 | #154 | Good 19.9% |
| Tlingit-Haida | 73.4 /100 | #155 | Good 19.9% |
| Thais | 71.1 /100 | #156 | Good 19.8% |
| Hungarians | 70.5 /100 | #157 | Good 19.8% |
| Armenians | 68.8 /100 | #158 | Good 19.8% |
Demographics Similar to Samoans by 3 or more Vehicles in Household
In terms of 3 or more vehicles in household, the demographic groups most similar to Samoans are Native Hawaiian (24.9%, a difference of 0.10%), Nepalese (24.9%, a difference of 0.19%), Shoshone (24.9%, a difference of 0.29%), Danish (24.7%, a difference of 0.98%), and Mexican (24.7%, a difference of 1.1%).
| Demographics | Rating | Rank | 3 or more Vehicles in Household |
| Yakama | 100.0 /100 | #1 | Exceptional 31.0% |
| Spanish American Indians | 100.0 /100 | #2 | Exceptional 26.9% |
| Tongans | 100.0 /100 | #3 | Exceptional 26.5% |
| Arapaho | 100.0 /100 | #4 | Exceptional 26.4% |
| Puget Sound Salish | 100.0 /100 | #5 | Exceptional 26.4% |
| Immigrants | Fiji | 100.0 /100 | #6 | Exceptional 26.1% |
| Colville | 100.0 /100 | #7 | Exceptional 25.8% |
| Samoans | 100.0 /100 | #8 | Exceptional 25.0% |
| Native Hawaiians | 100.0 /100 | #9 | Exceptional 24.9% |
| Nepalese | 100.0 /100 | #10 | Exceptional 24.9% |
| Shoshone | 100.0 /100 | #11 | Exceptional 24.9% |
| Danes | 100.0 /100 | #12 | Exceptional 24.7% |
| Mexicans | 100.0 /100 | #13 | Exceptional 24.7% |
| Immigrants | Mexico | 100.0 /100 | #14 | Exceptional 24.6% |
| Hawaiians | 100.0 /100 | #15 | Exceptional 24.3% |